


Figure I: Comparison of the deformation of 8 aggregate swatch prints aged over 1 year with various pectin/chitosan and cellulose compositions.
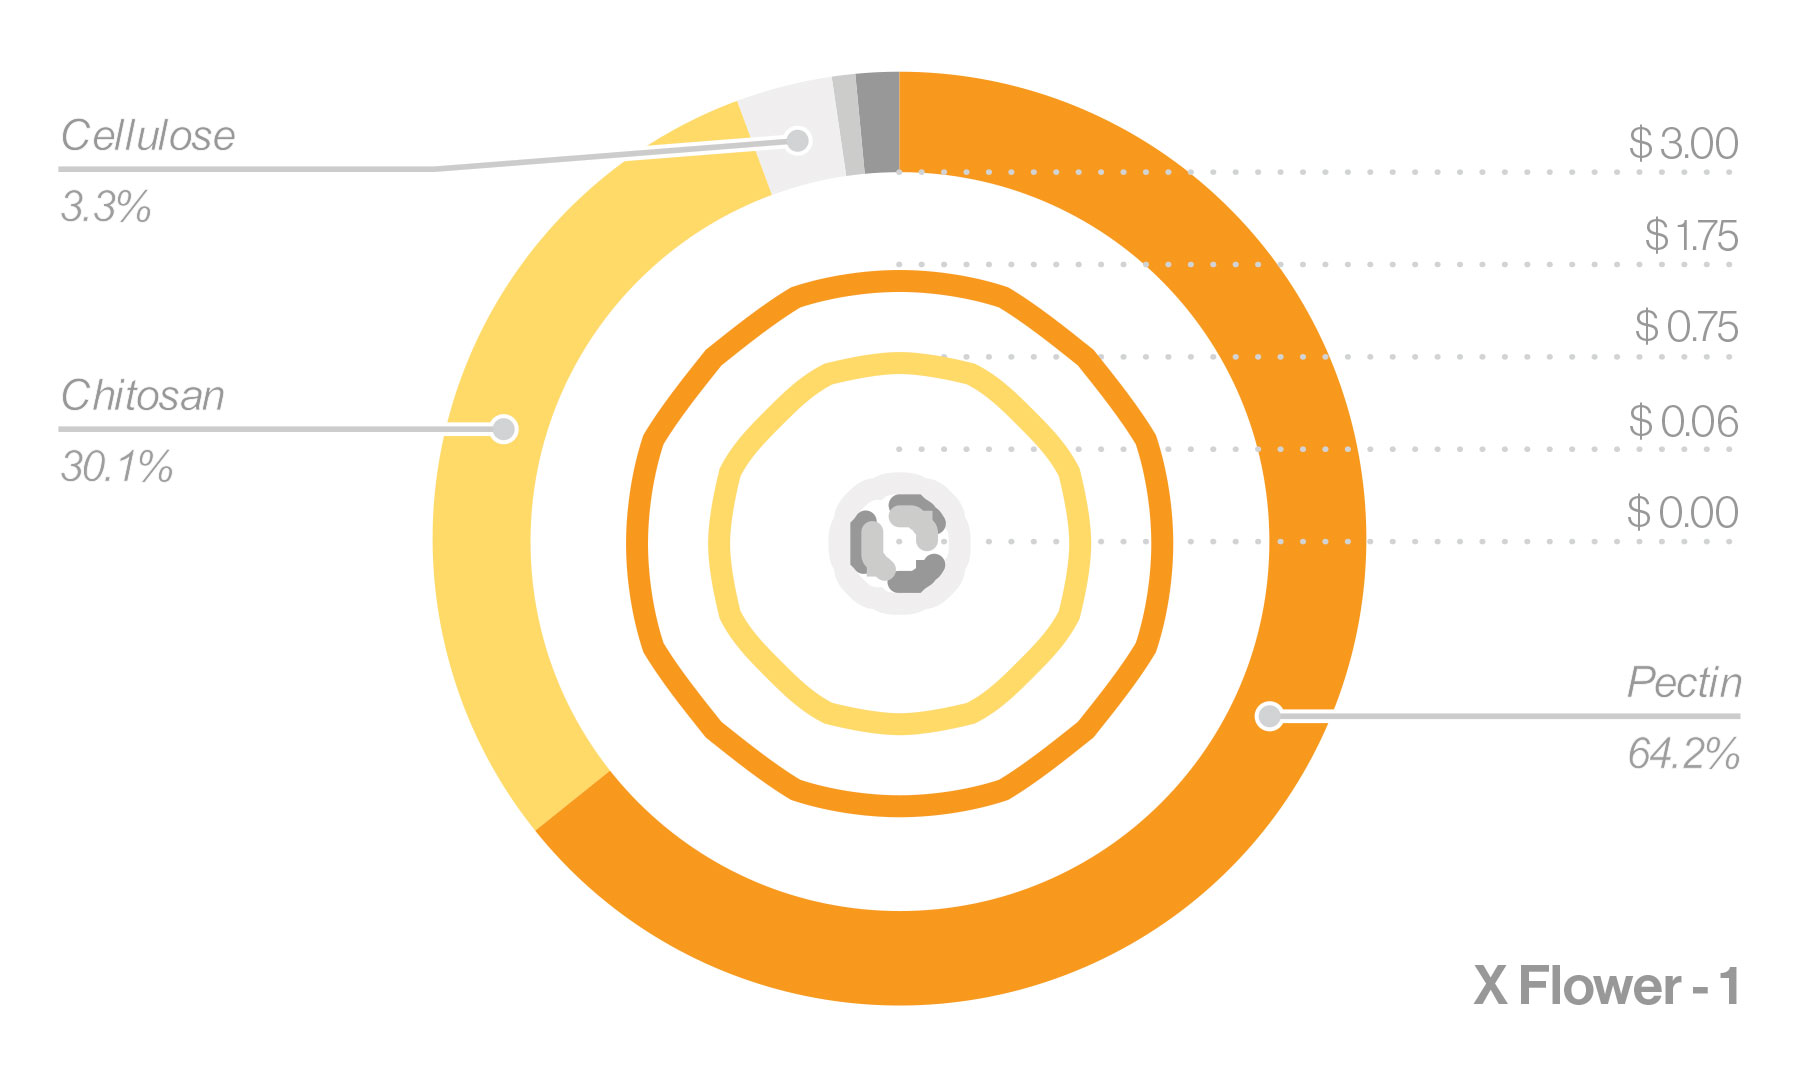

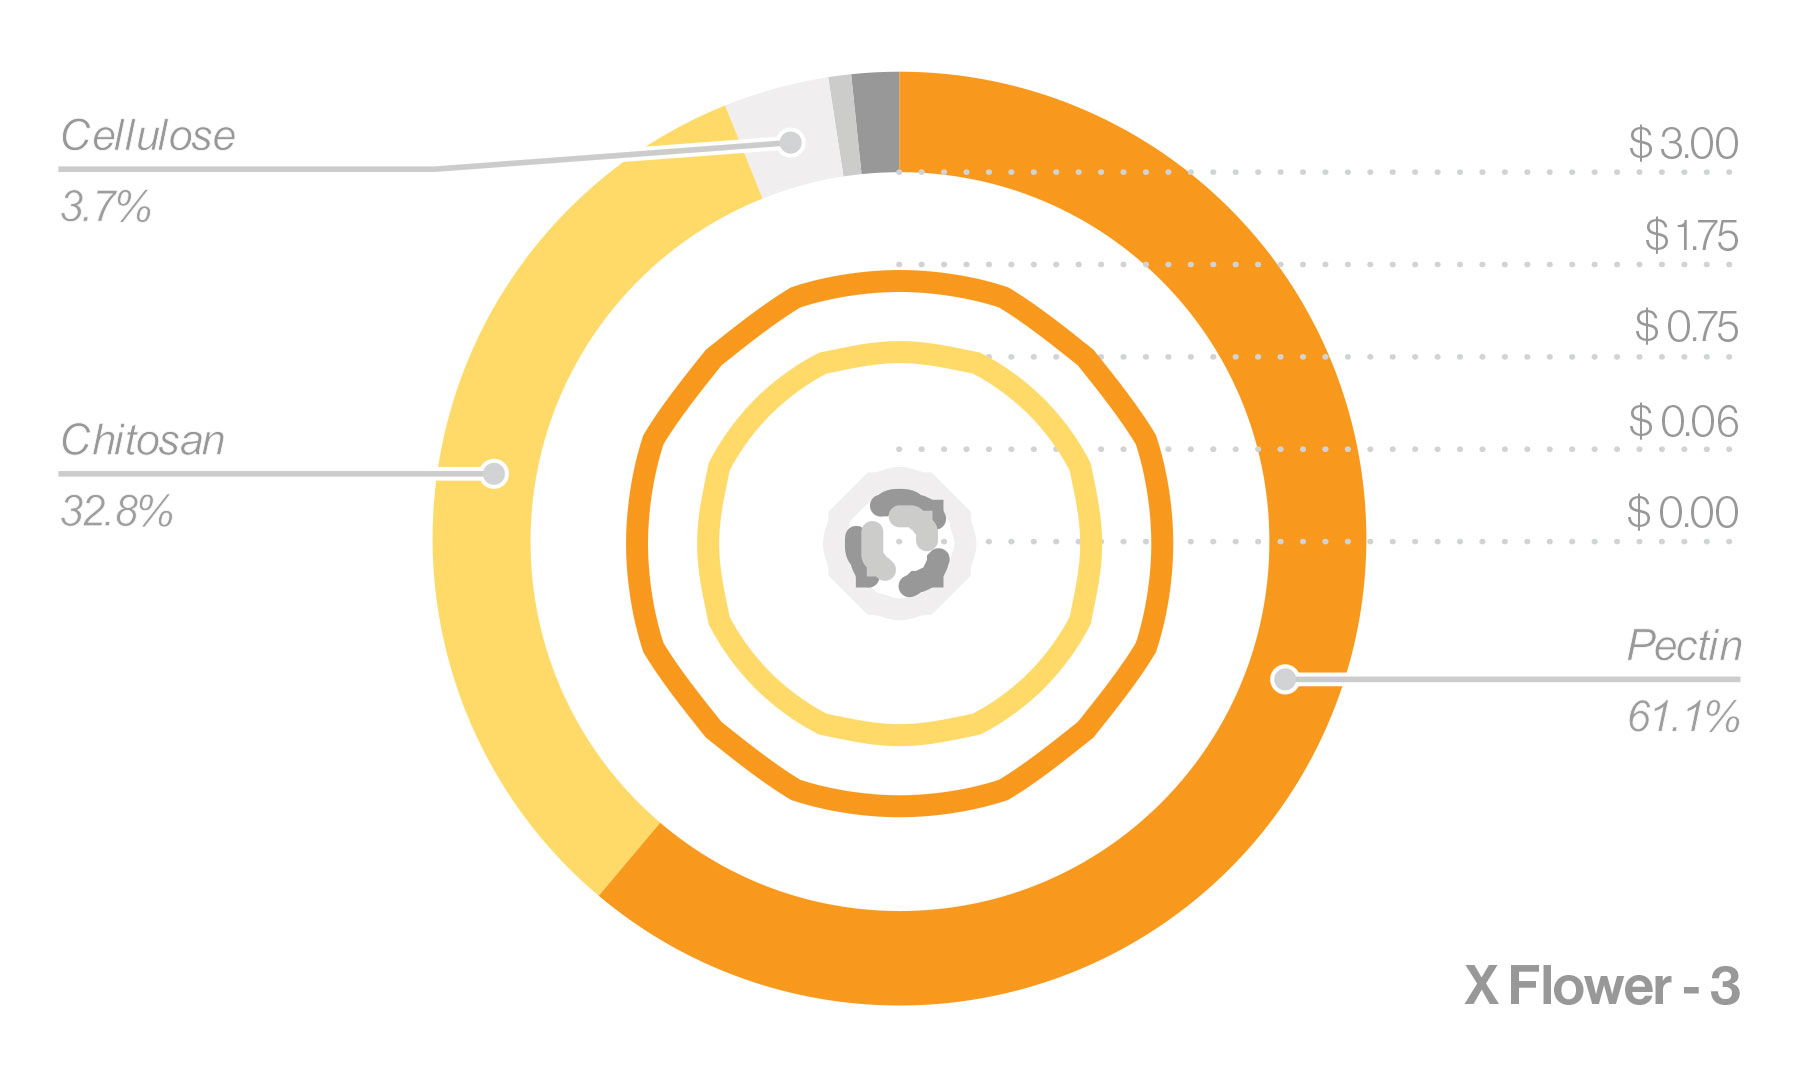


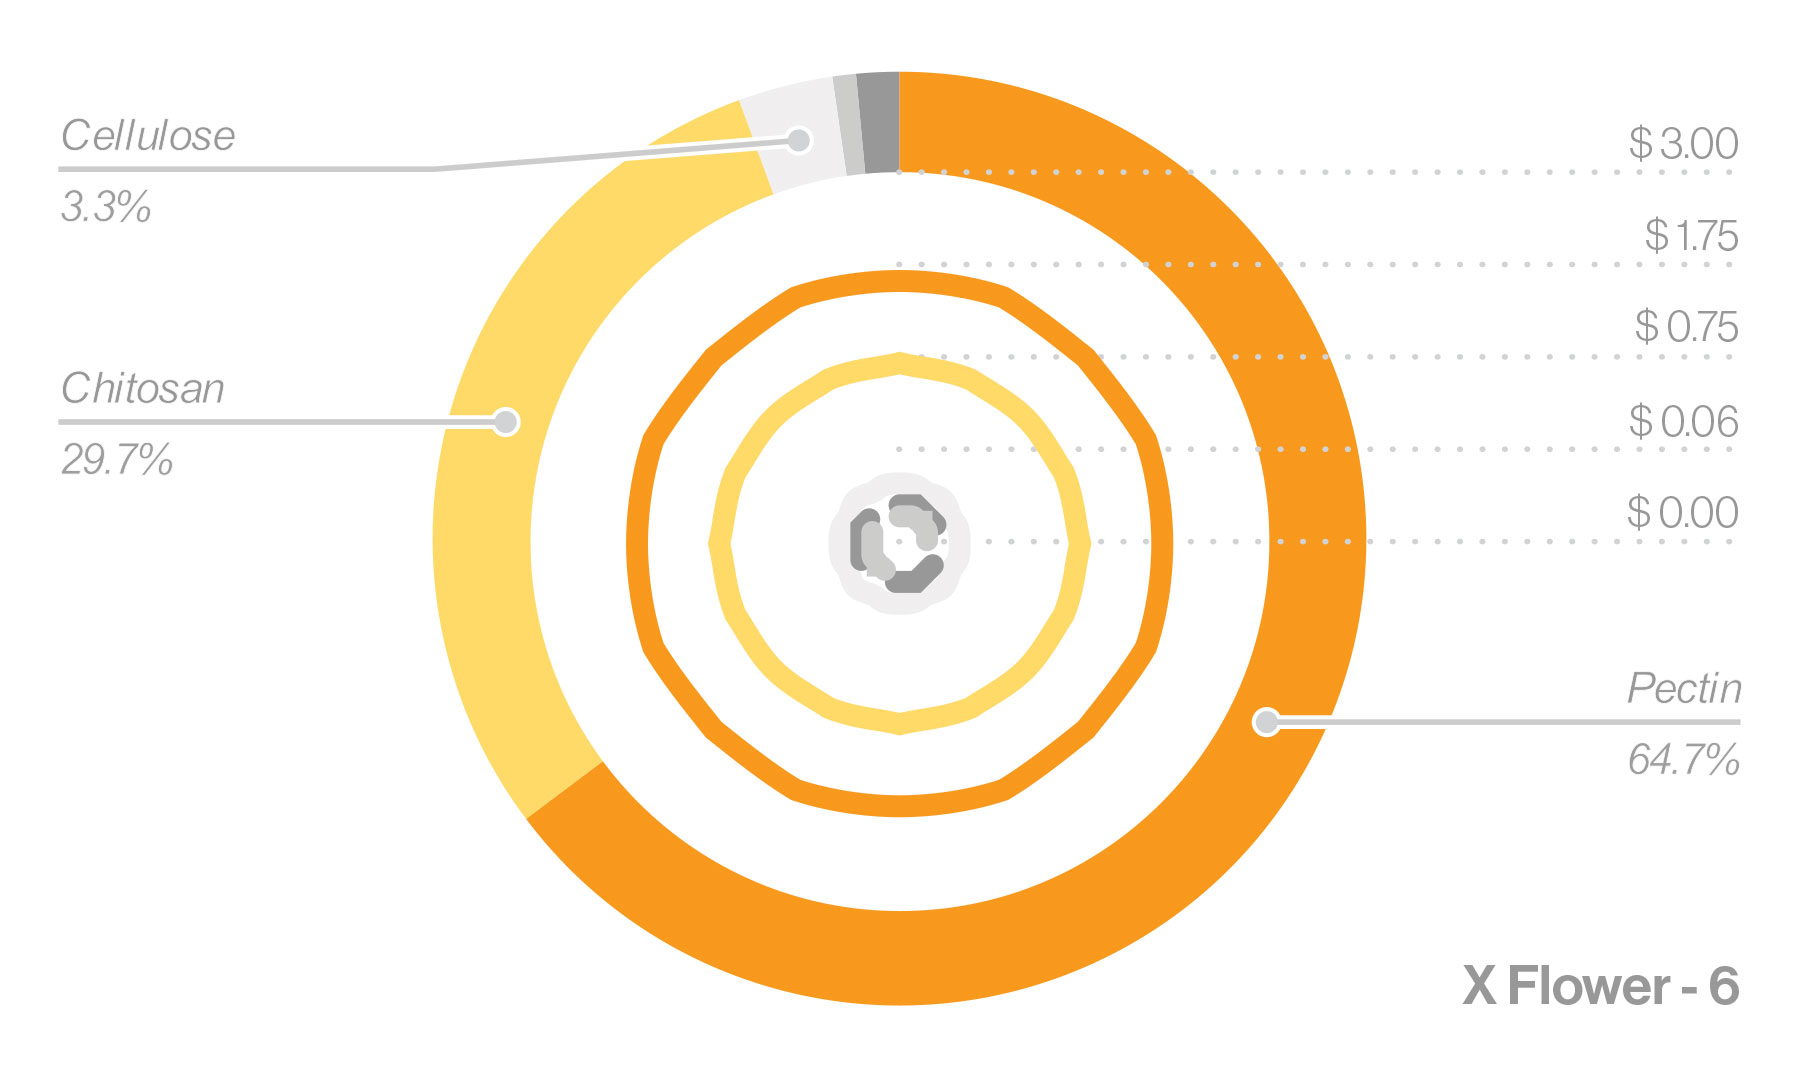


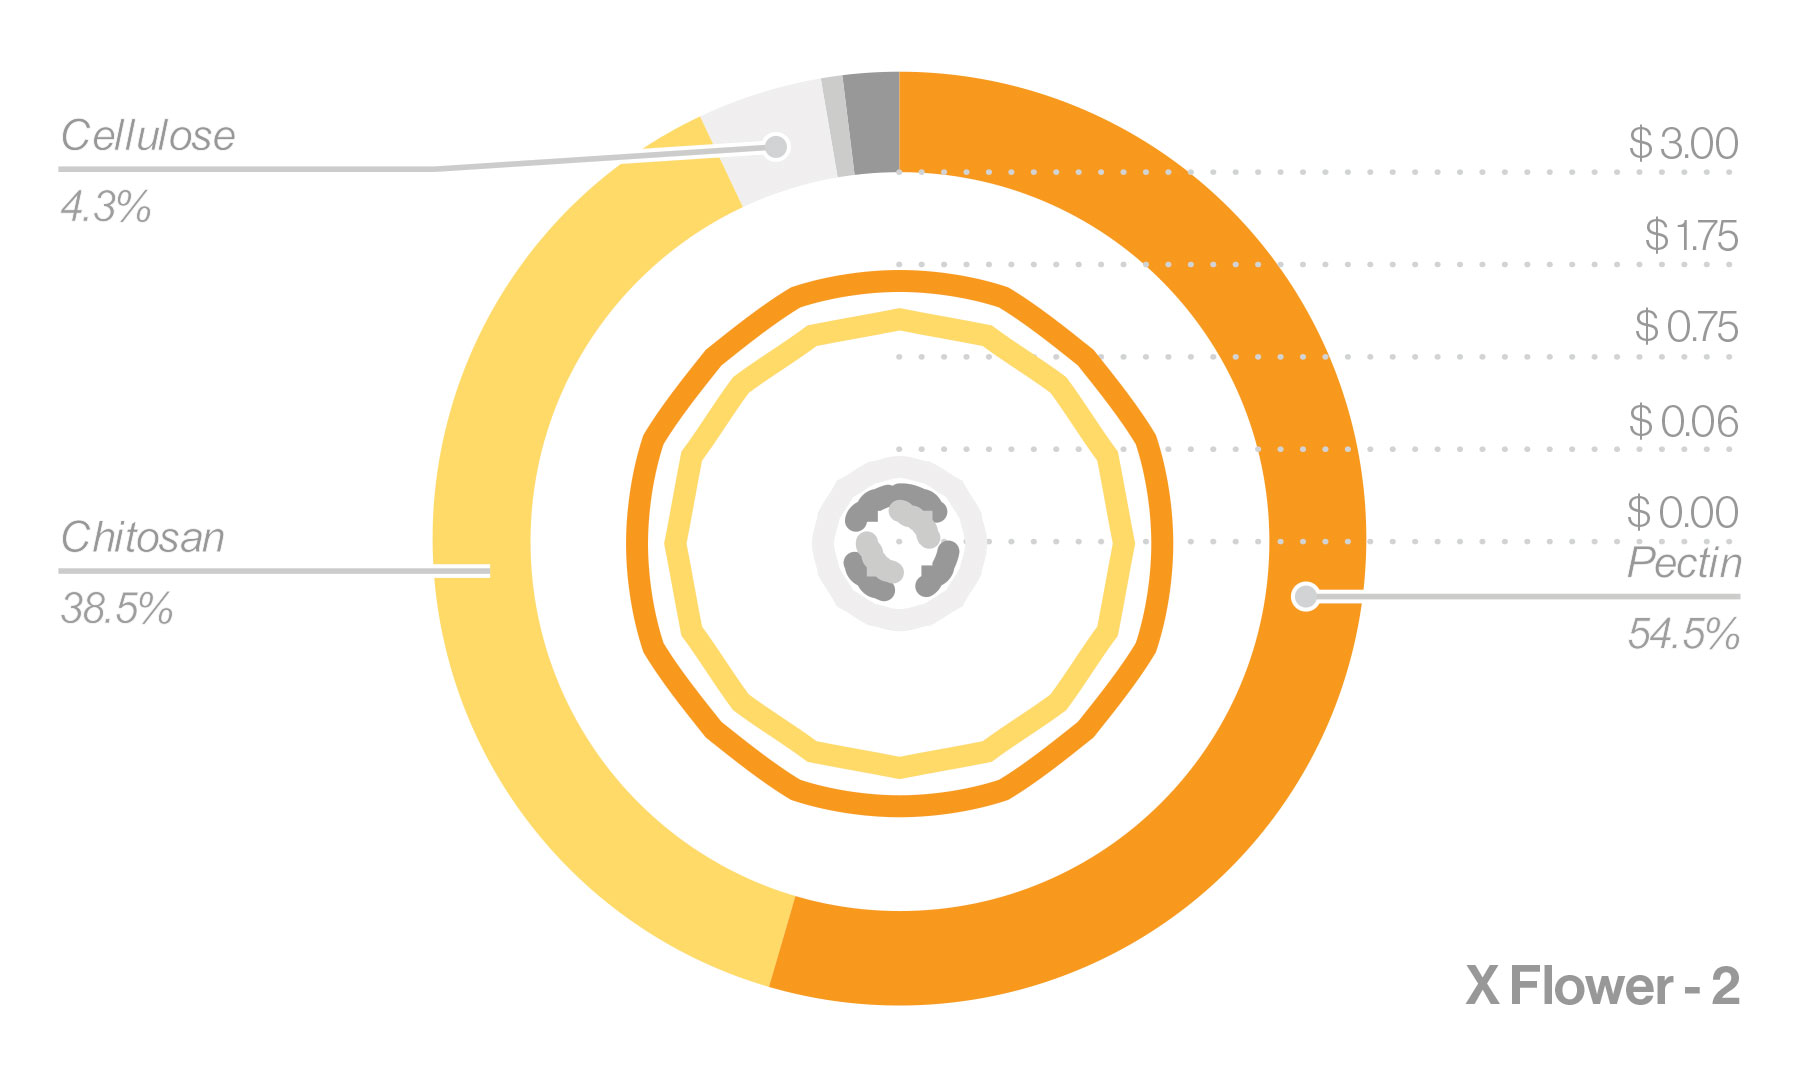

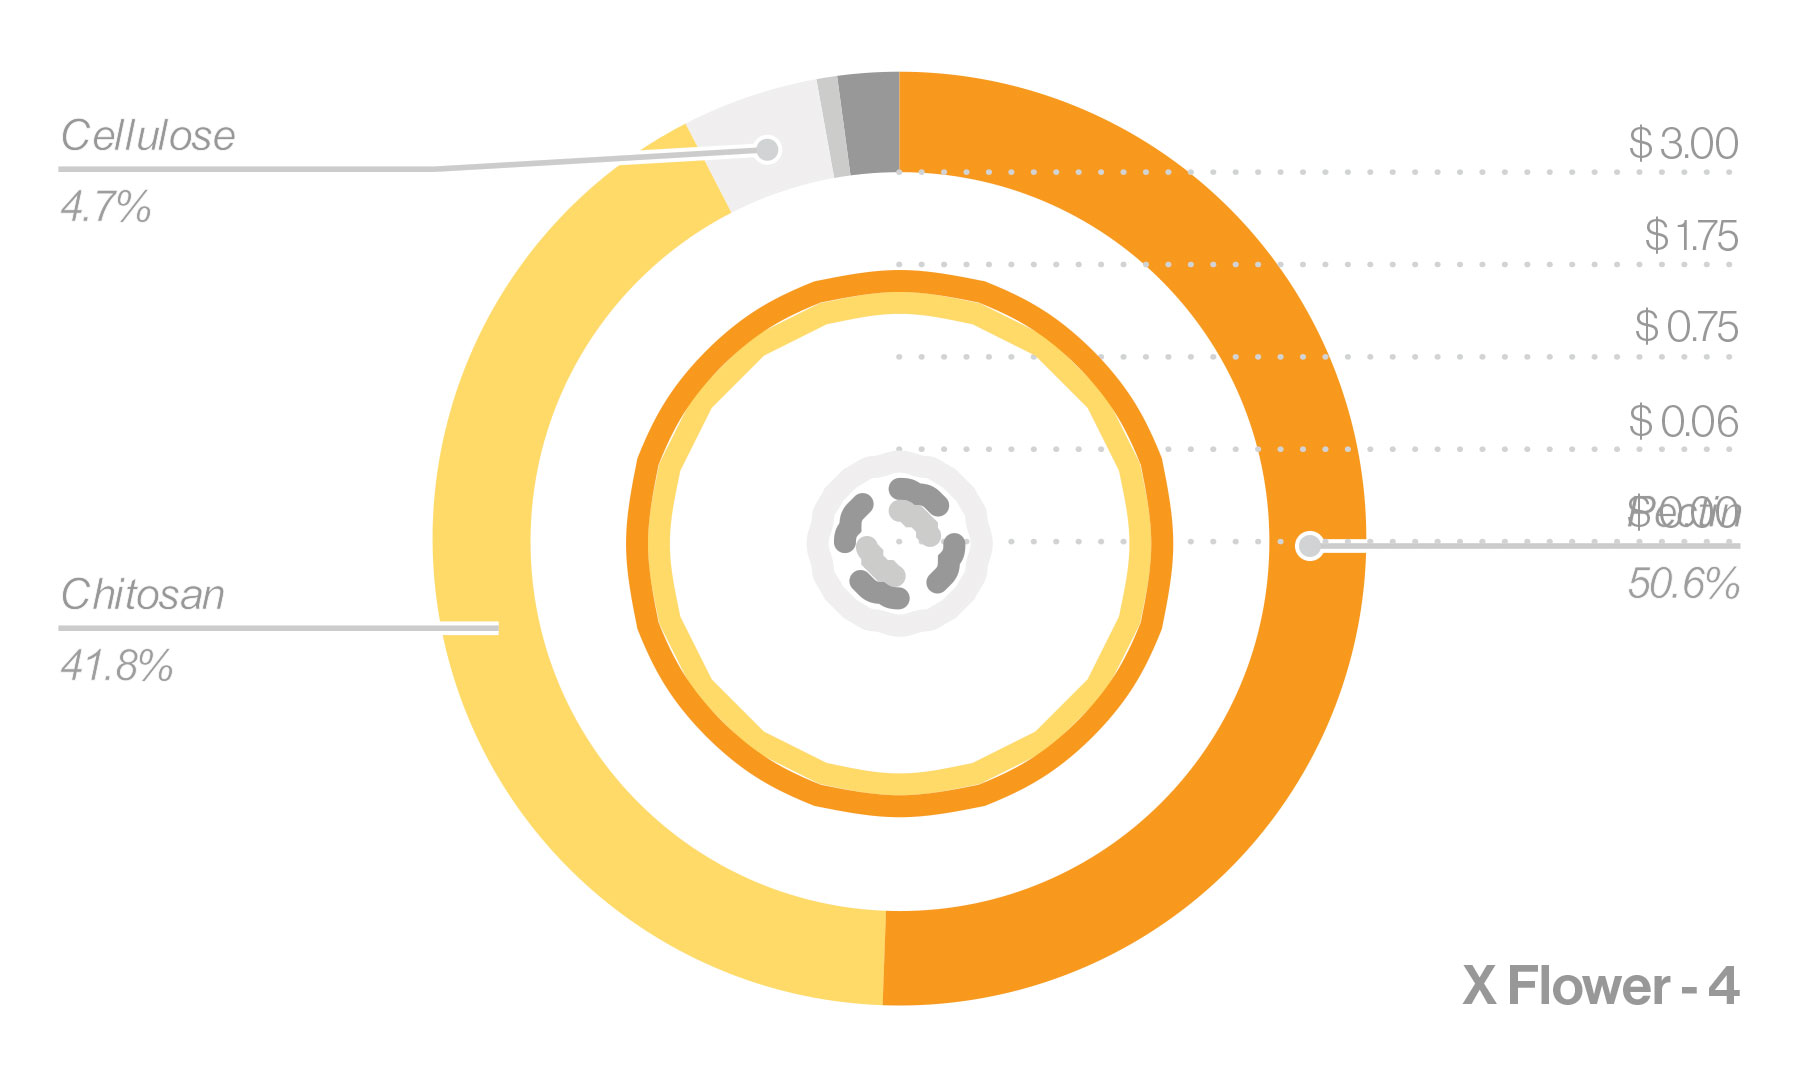


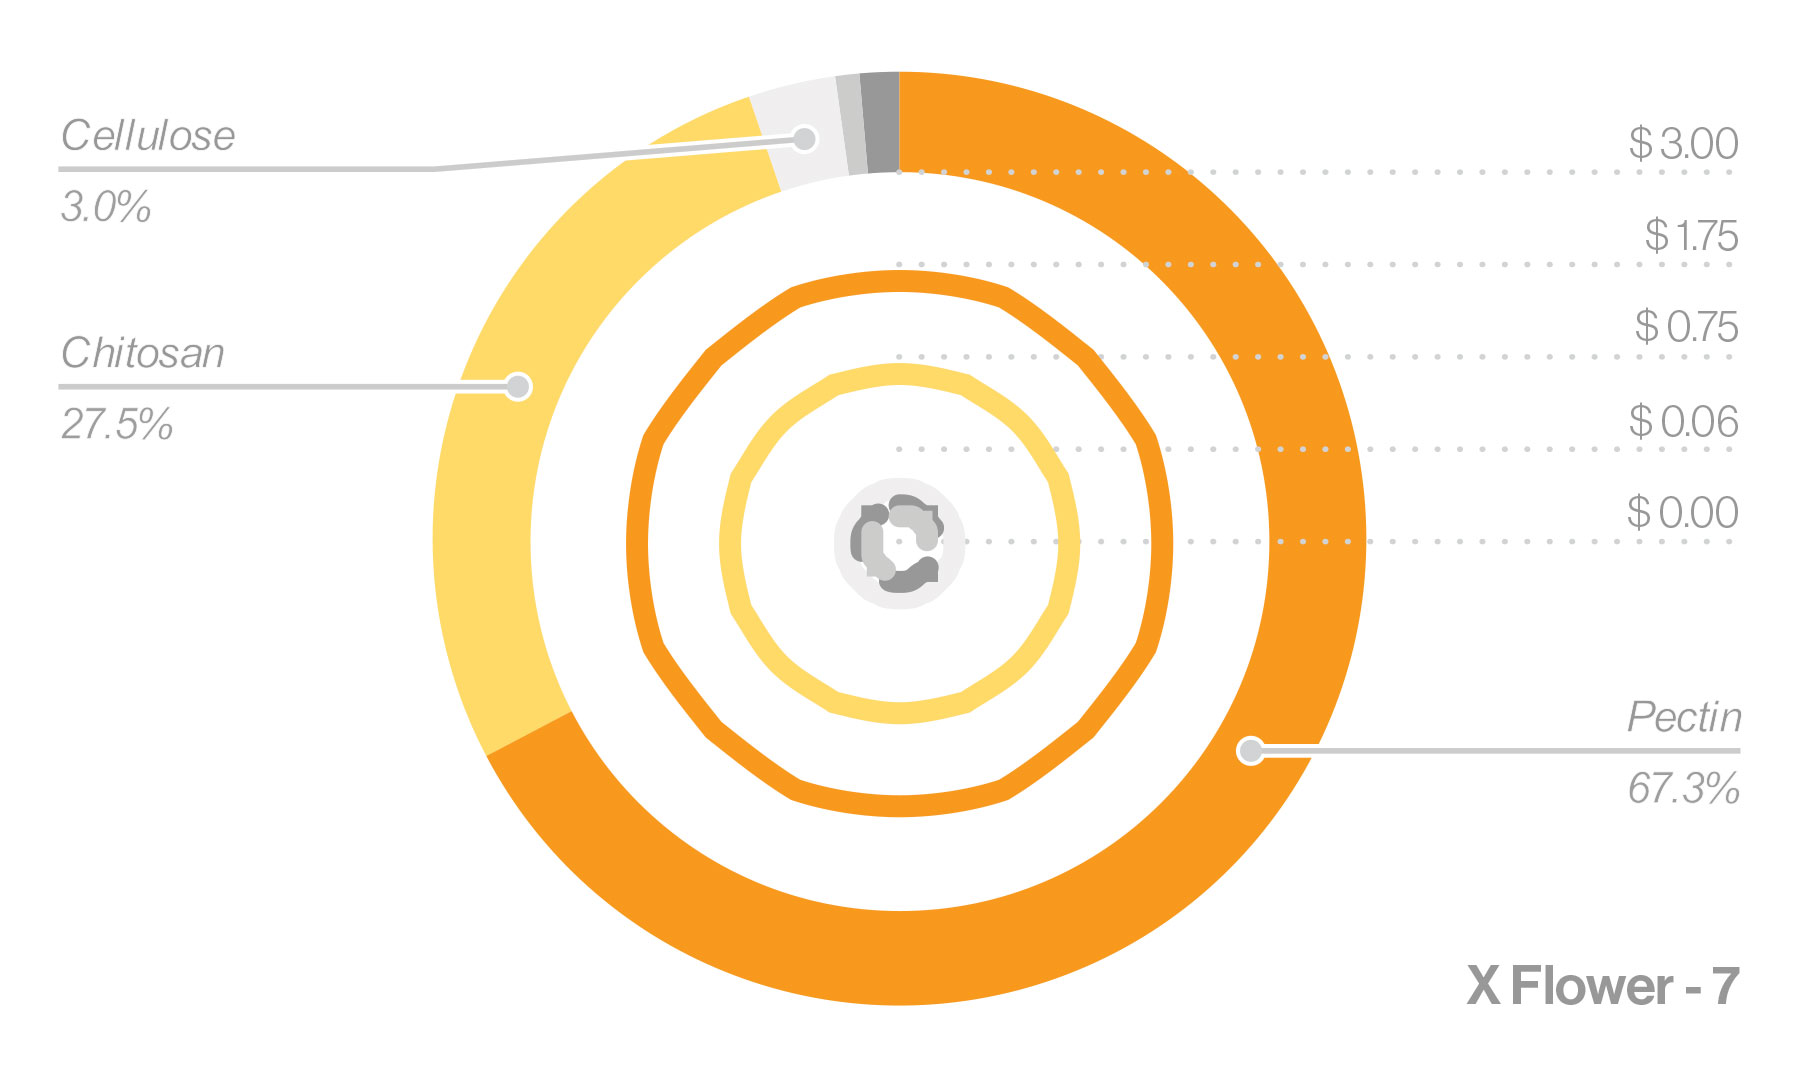

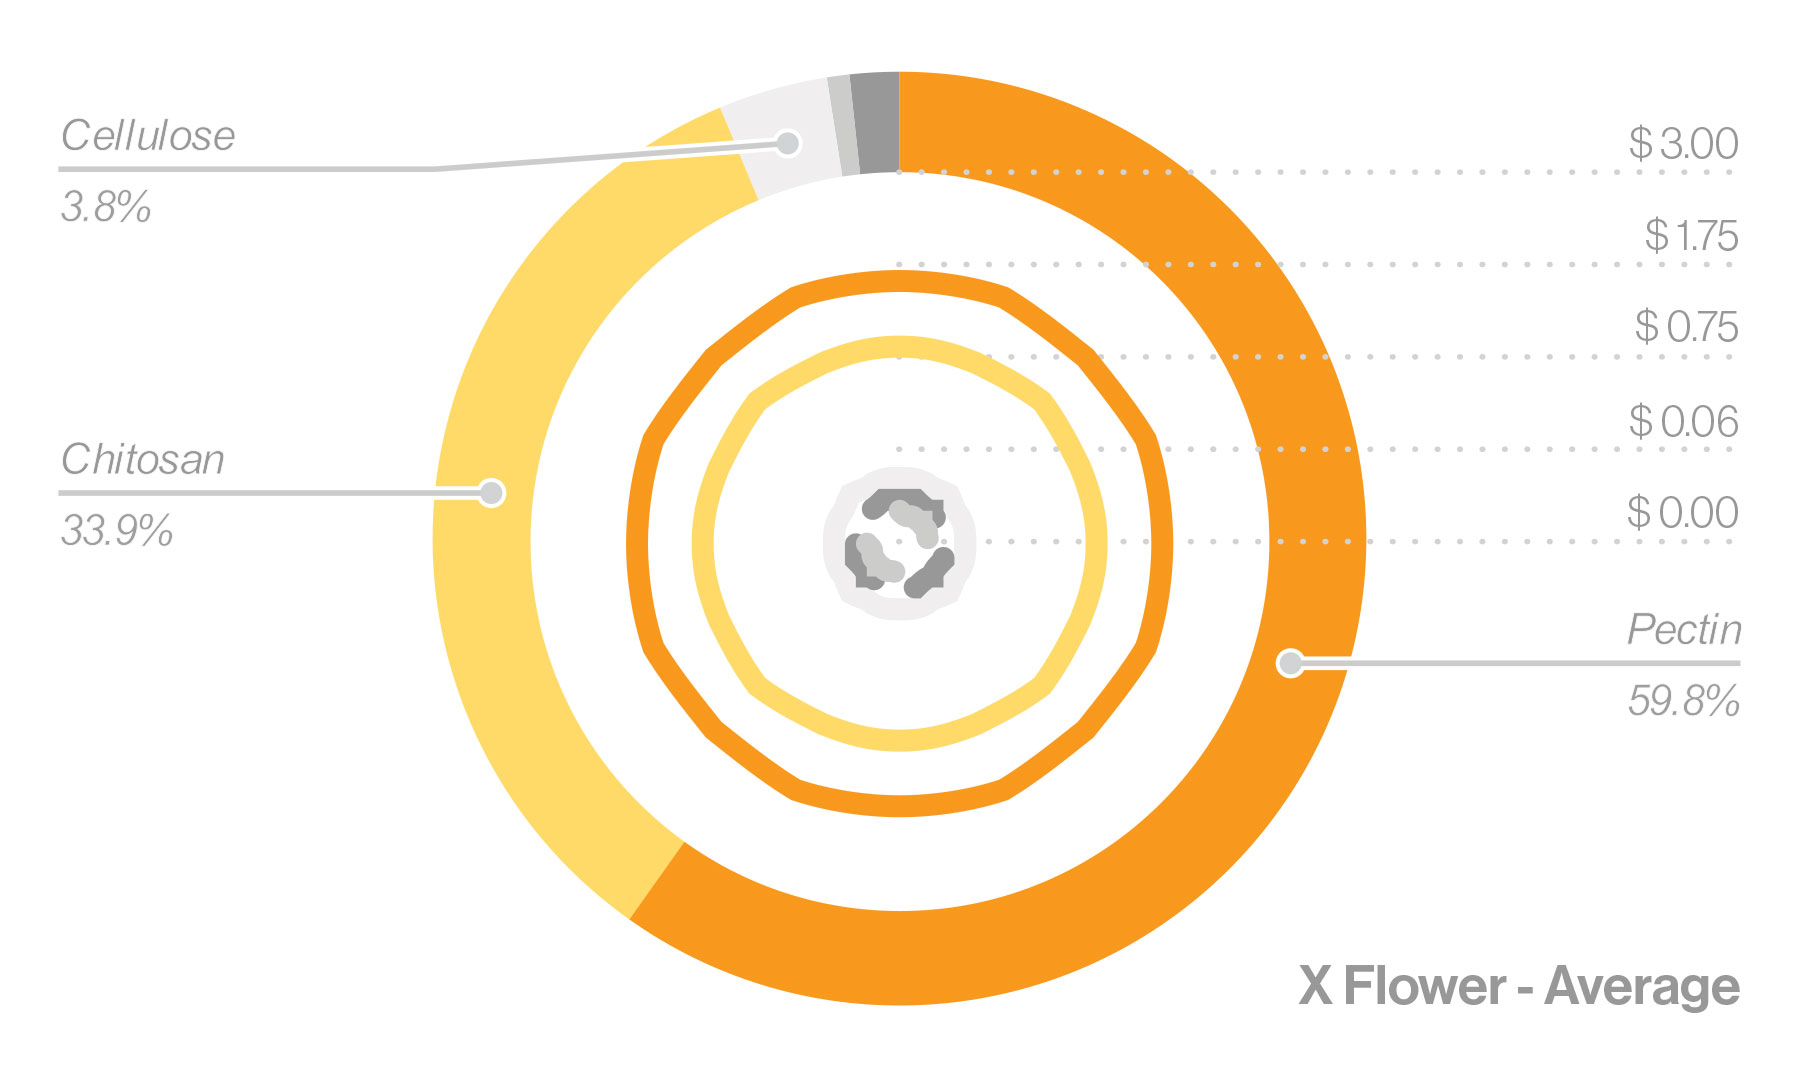
Figure II: Composite pie chart circle diagram comparing ingredient volume and cost of materials for each single material print (8 swatch types).
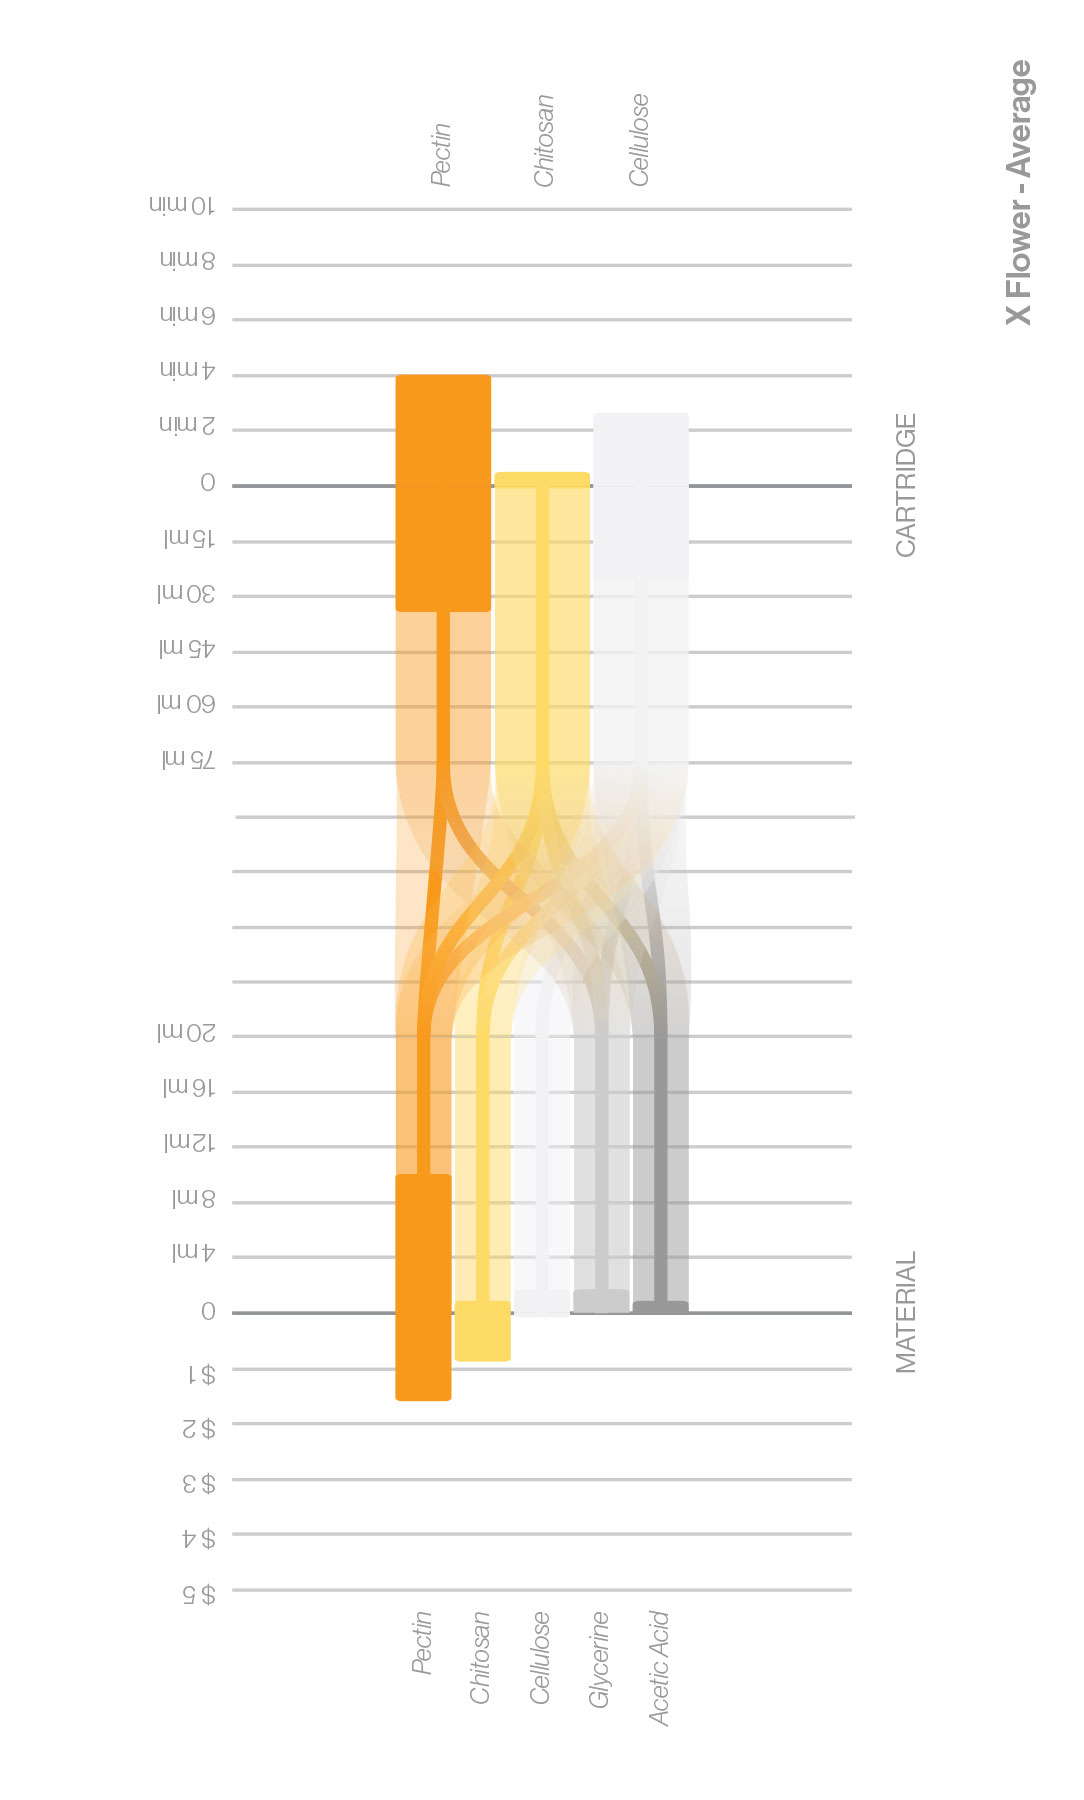


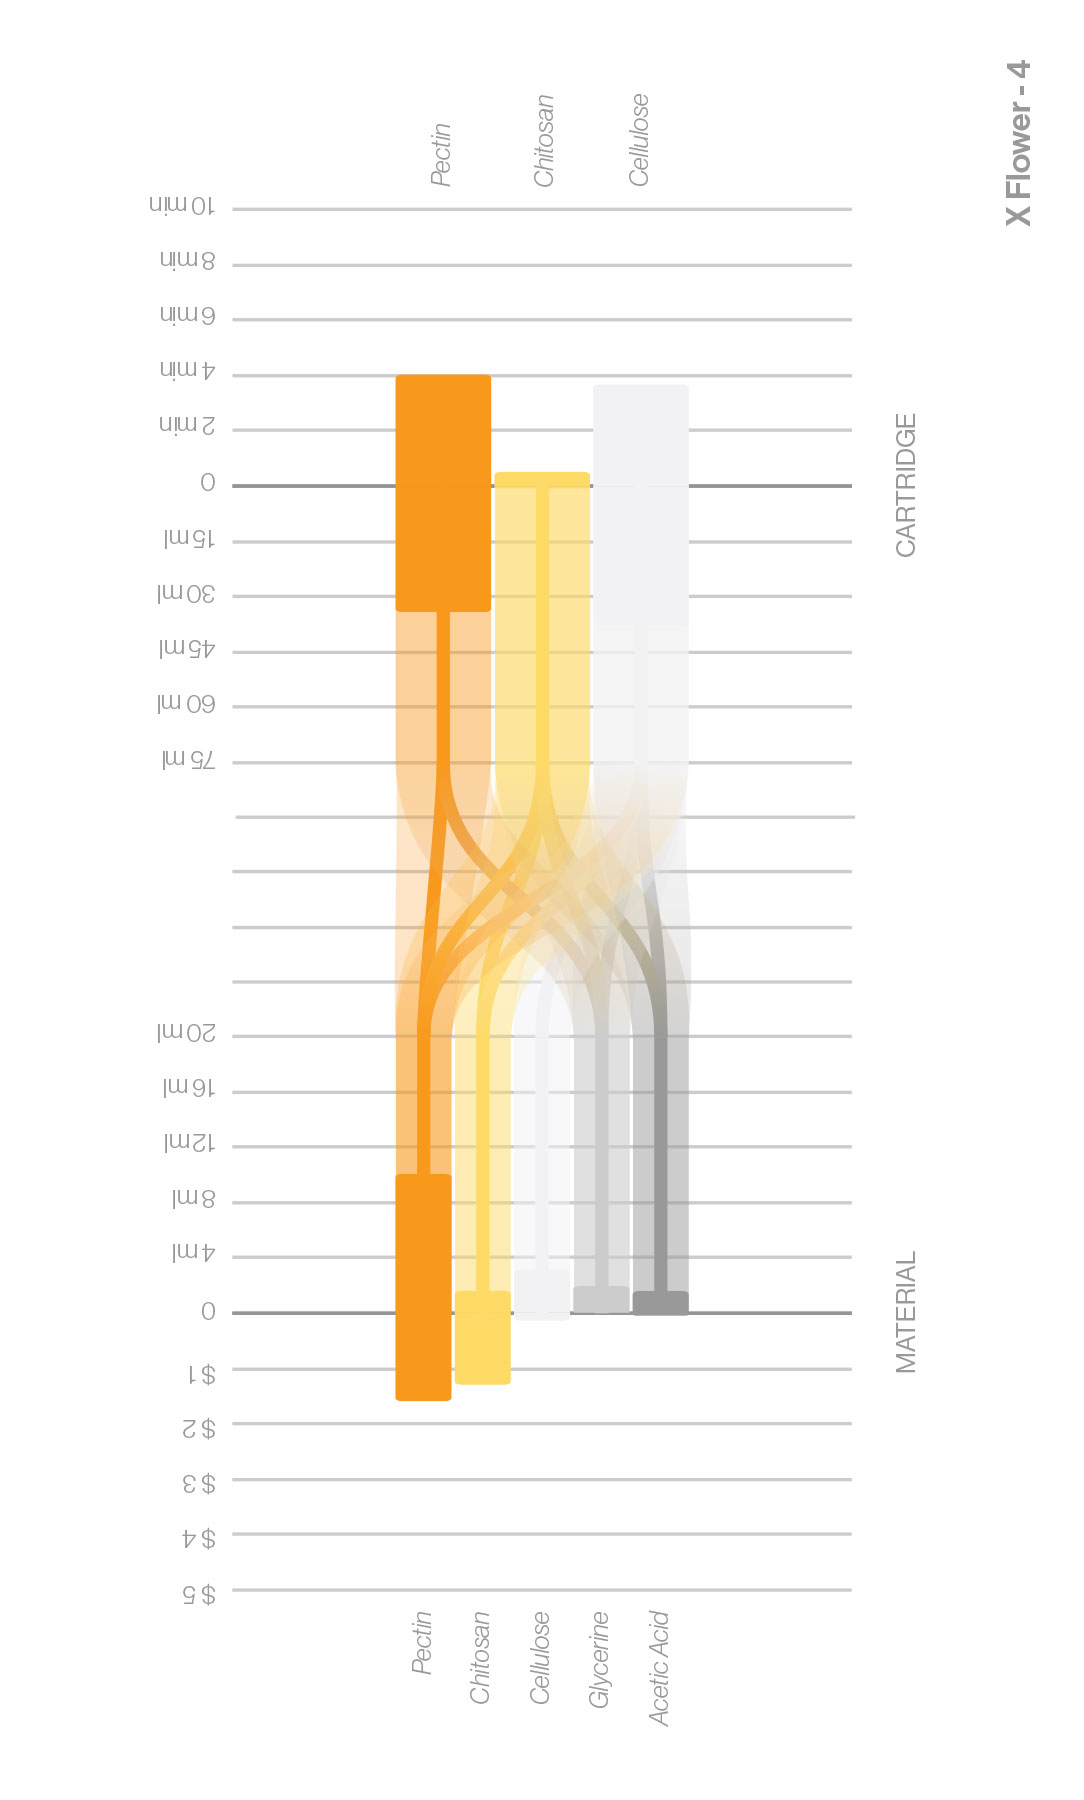


Figure III: Diagram comparing volume of material, print duration, and cost for different biopolymer formulas used in each print in the series of 8 swatch types.
+
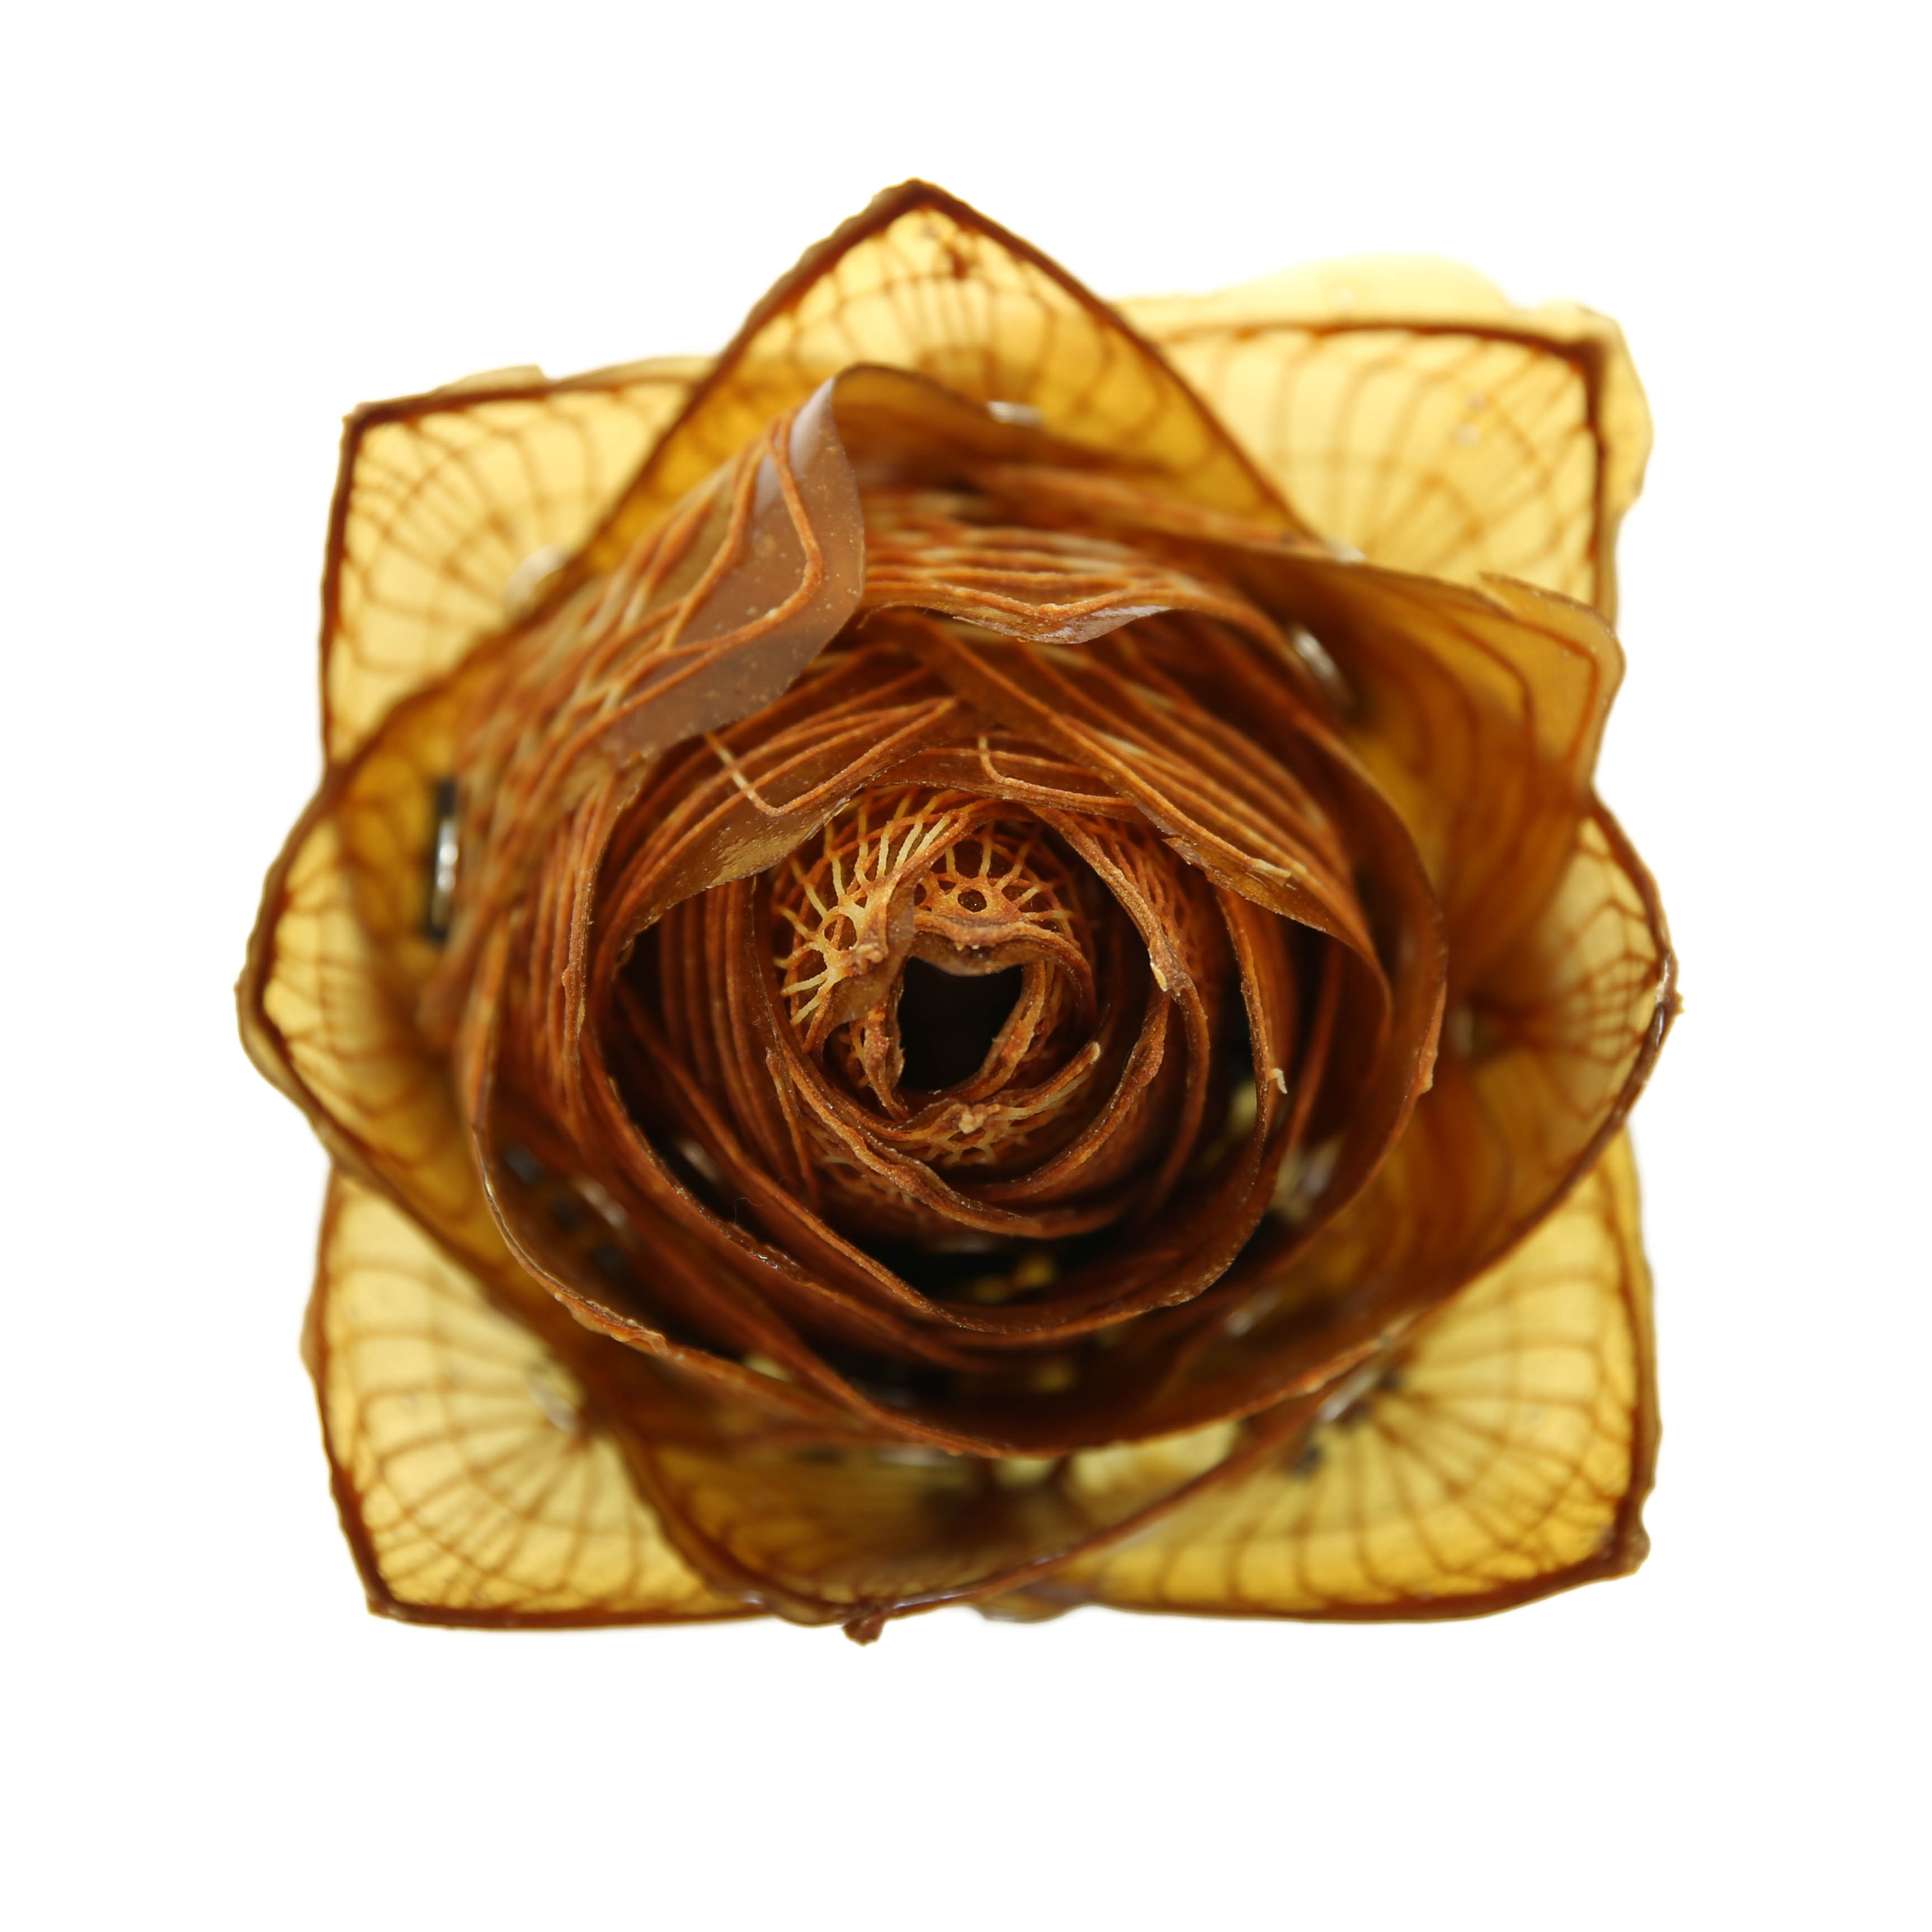
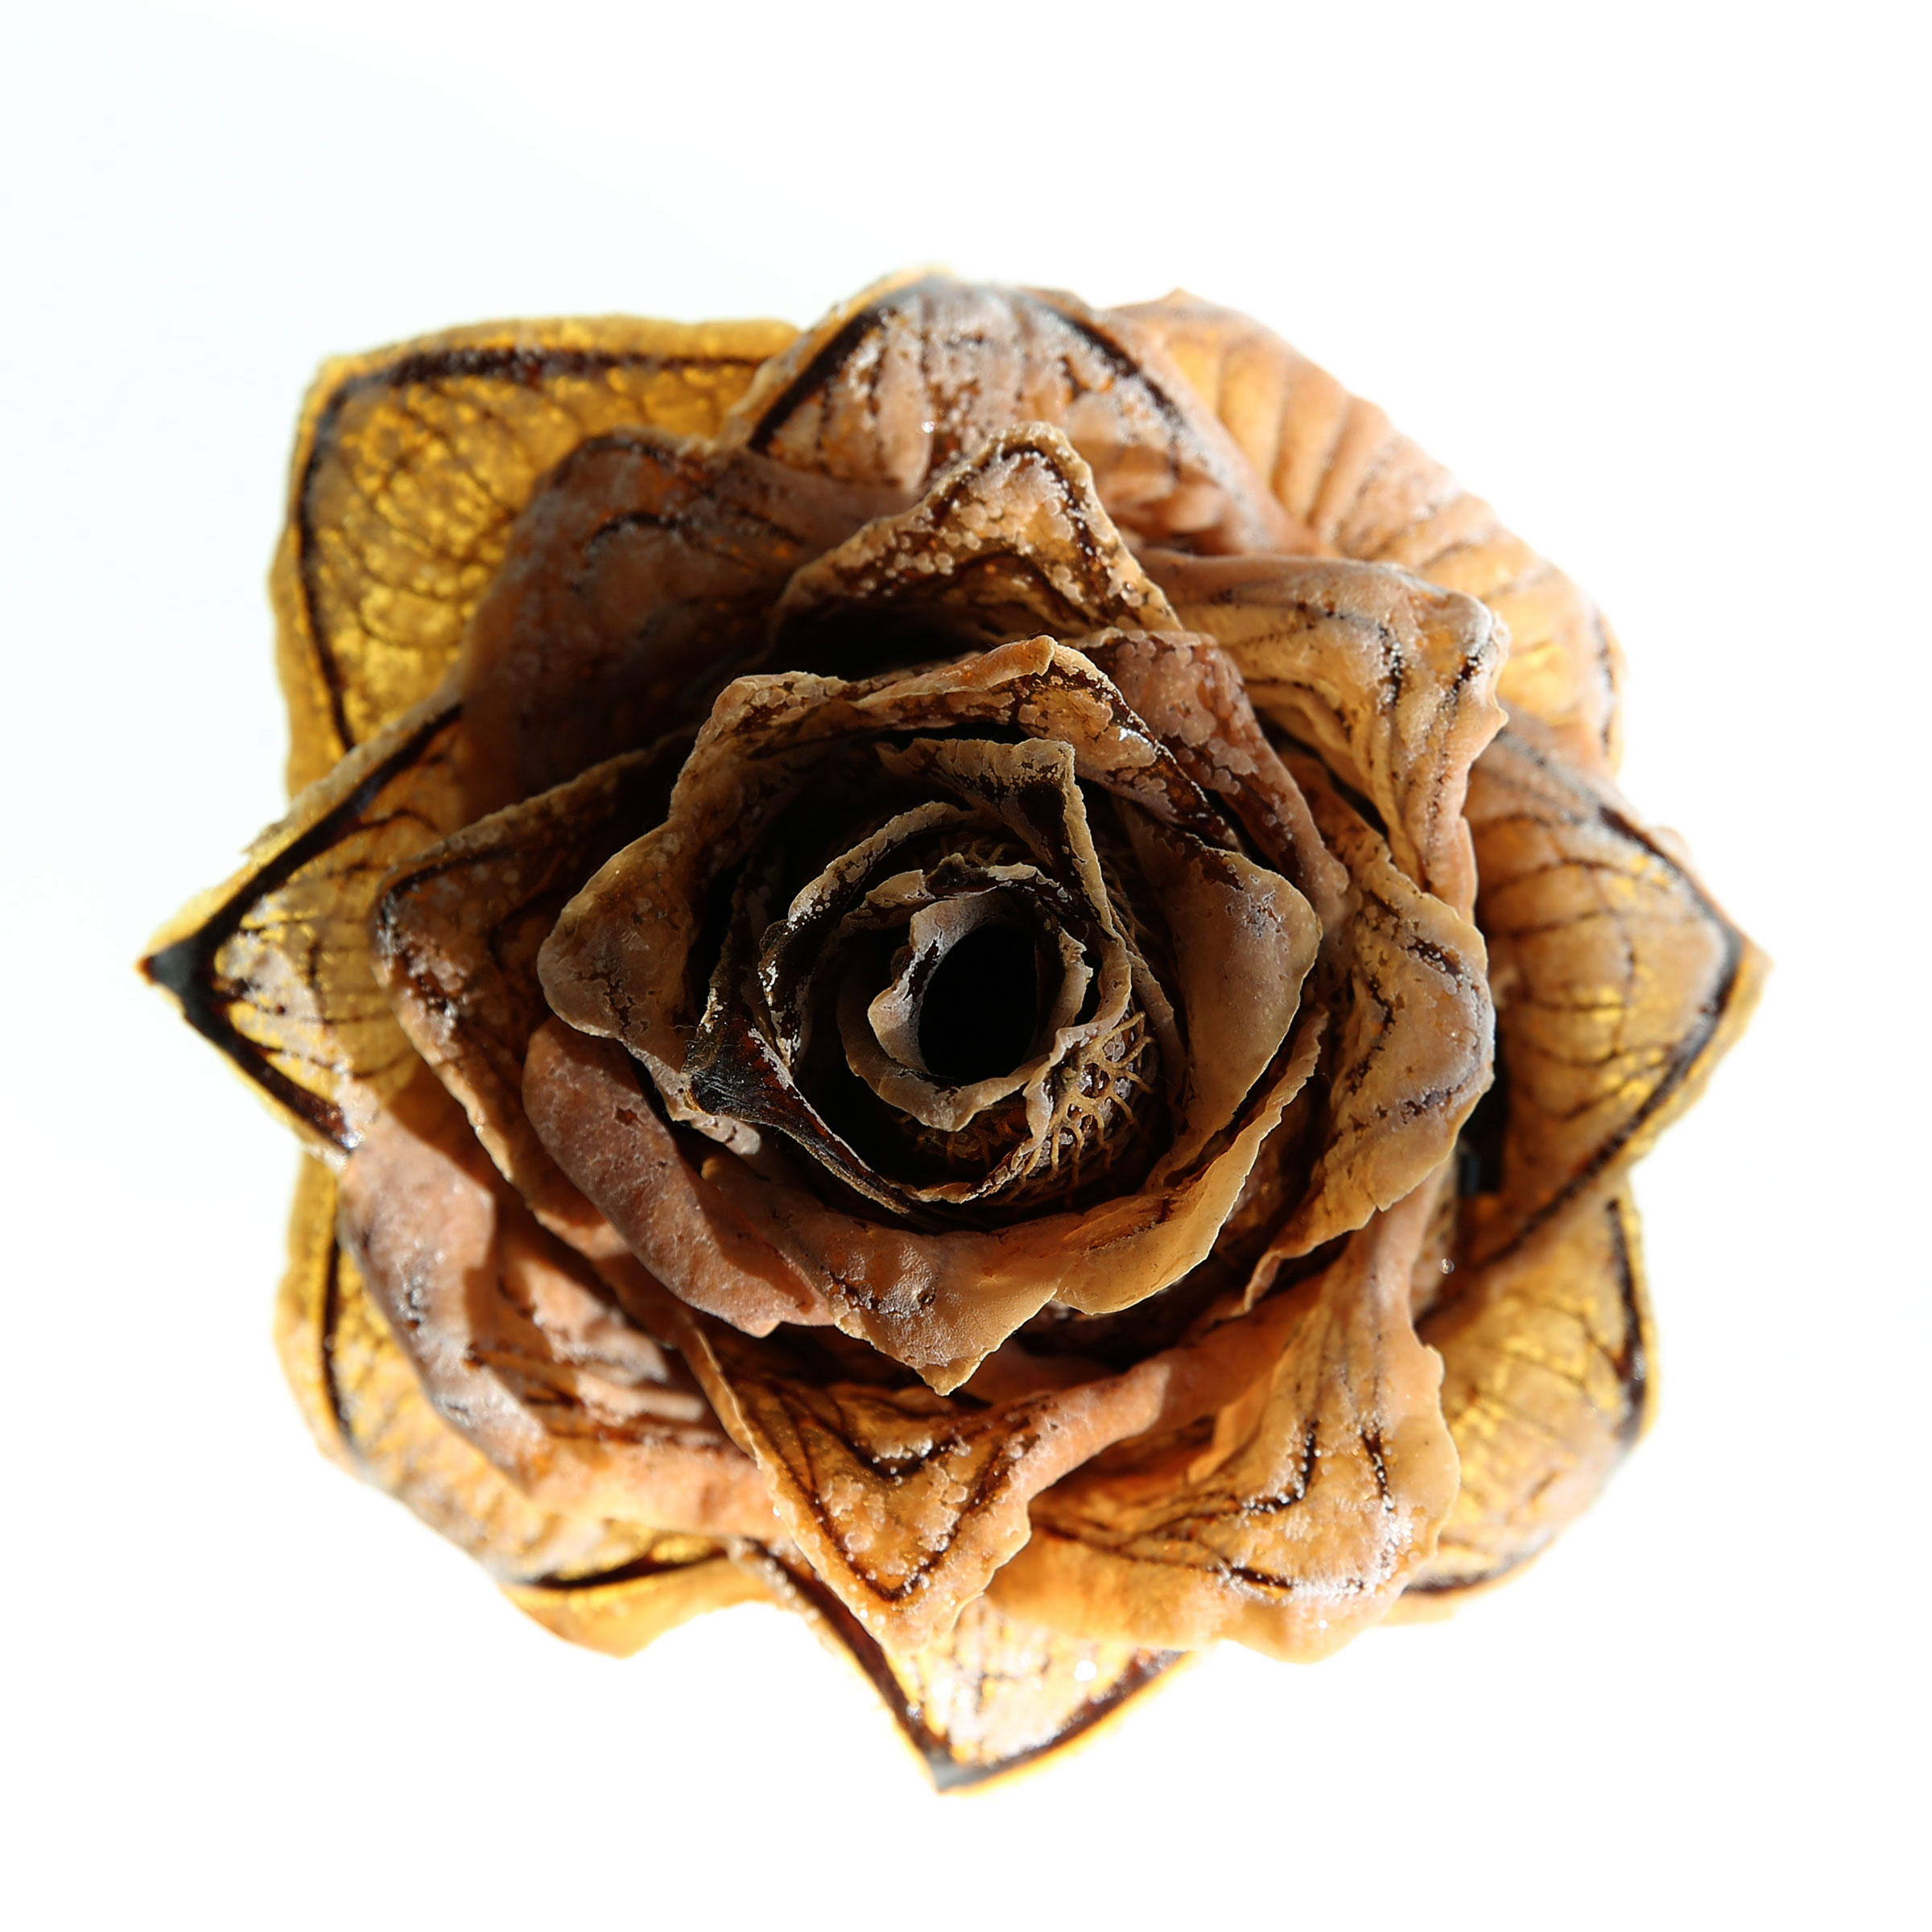
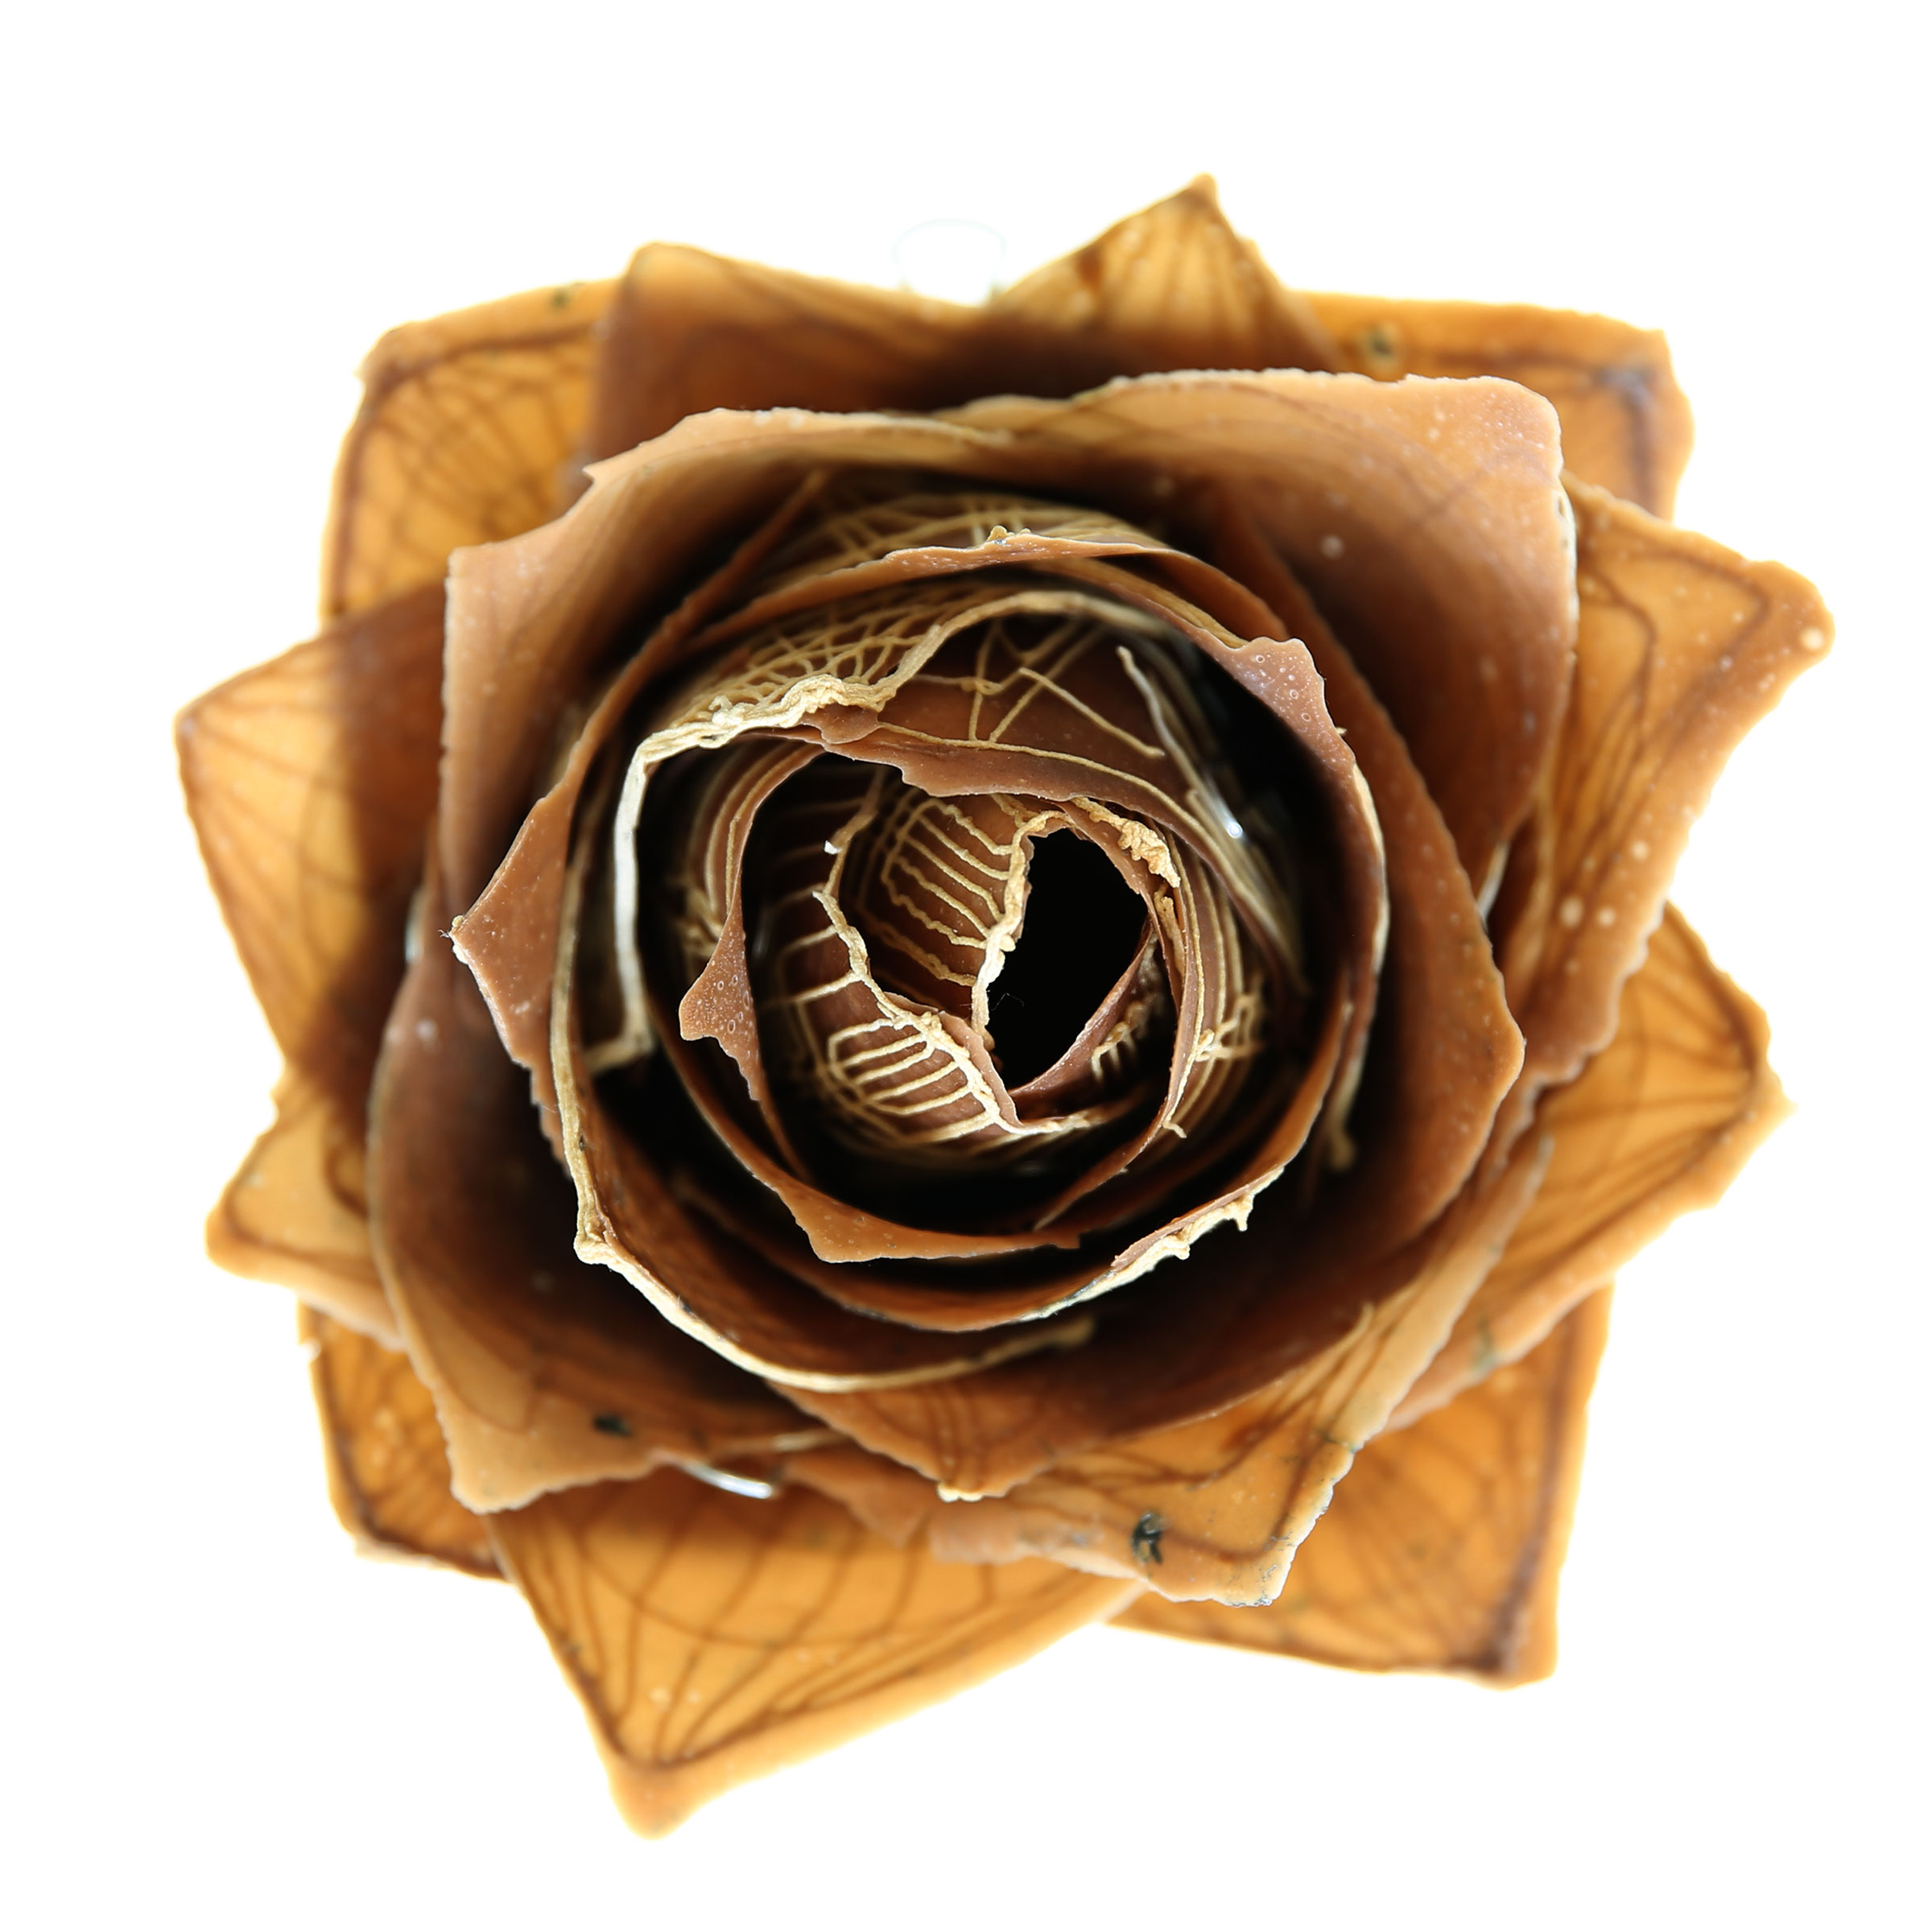
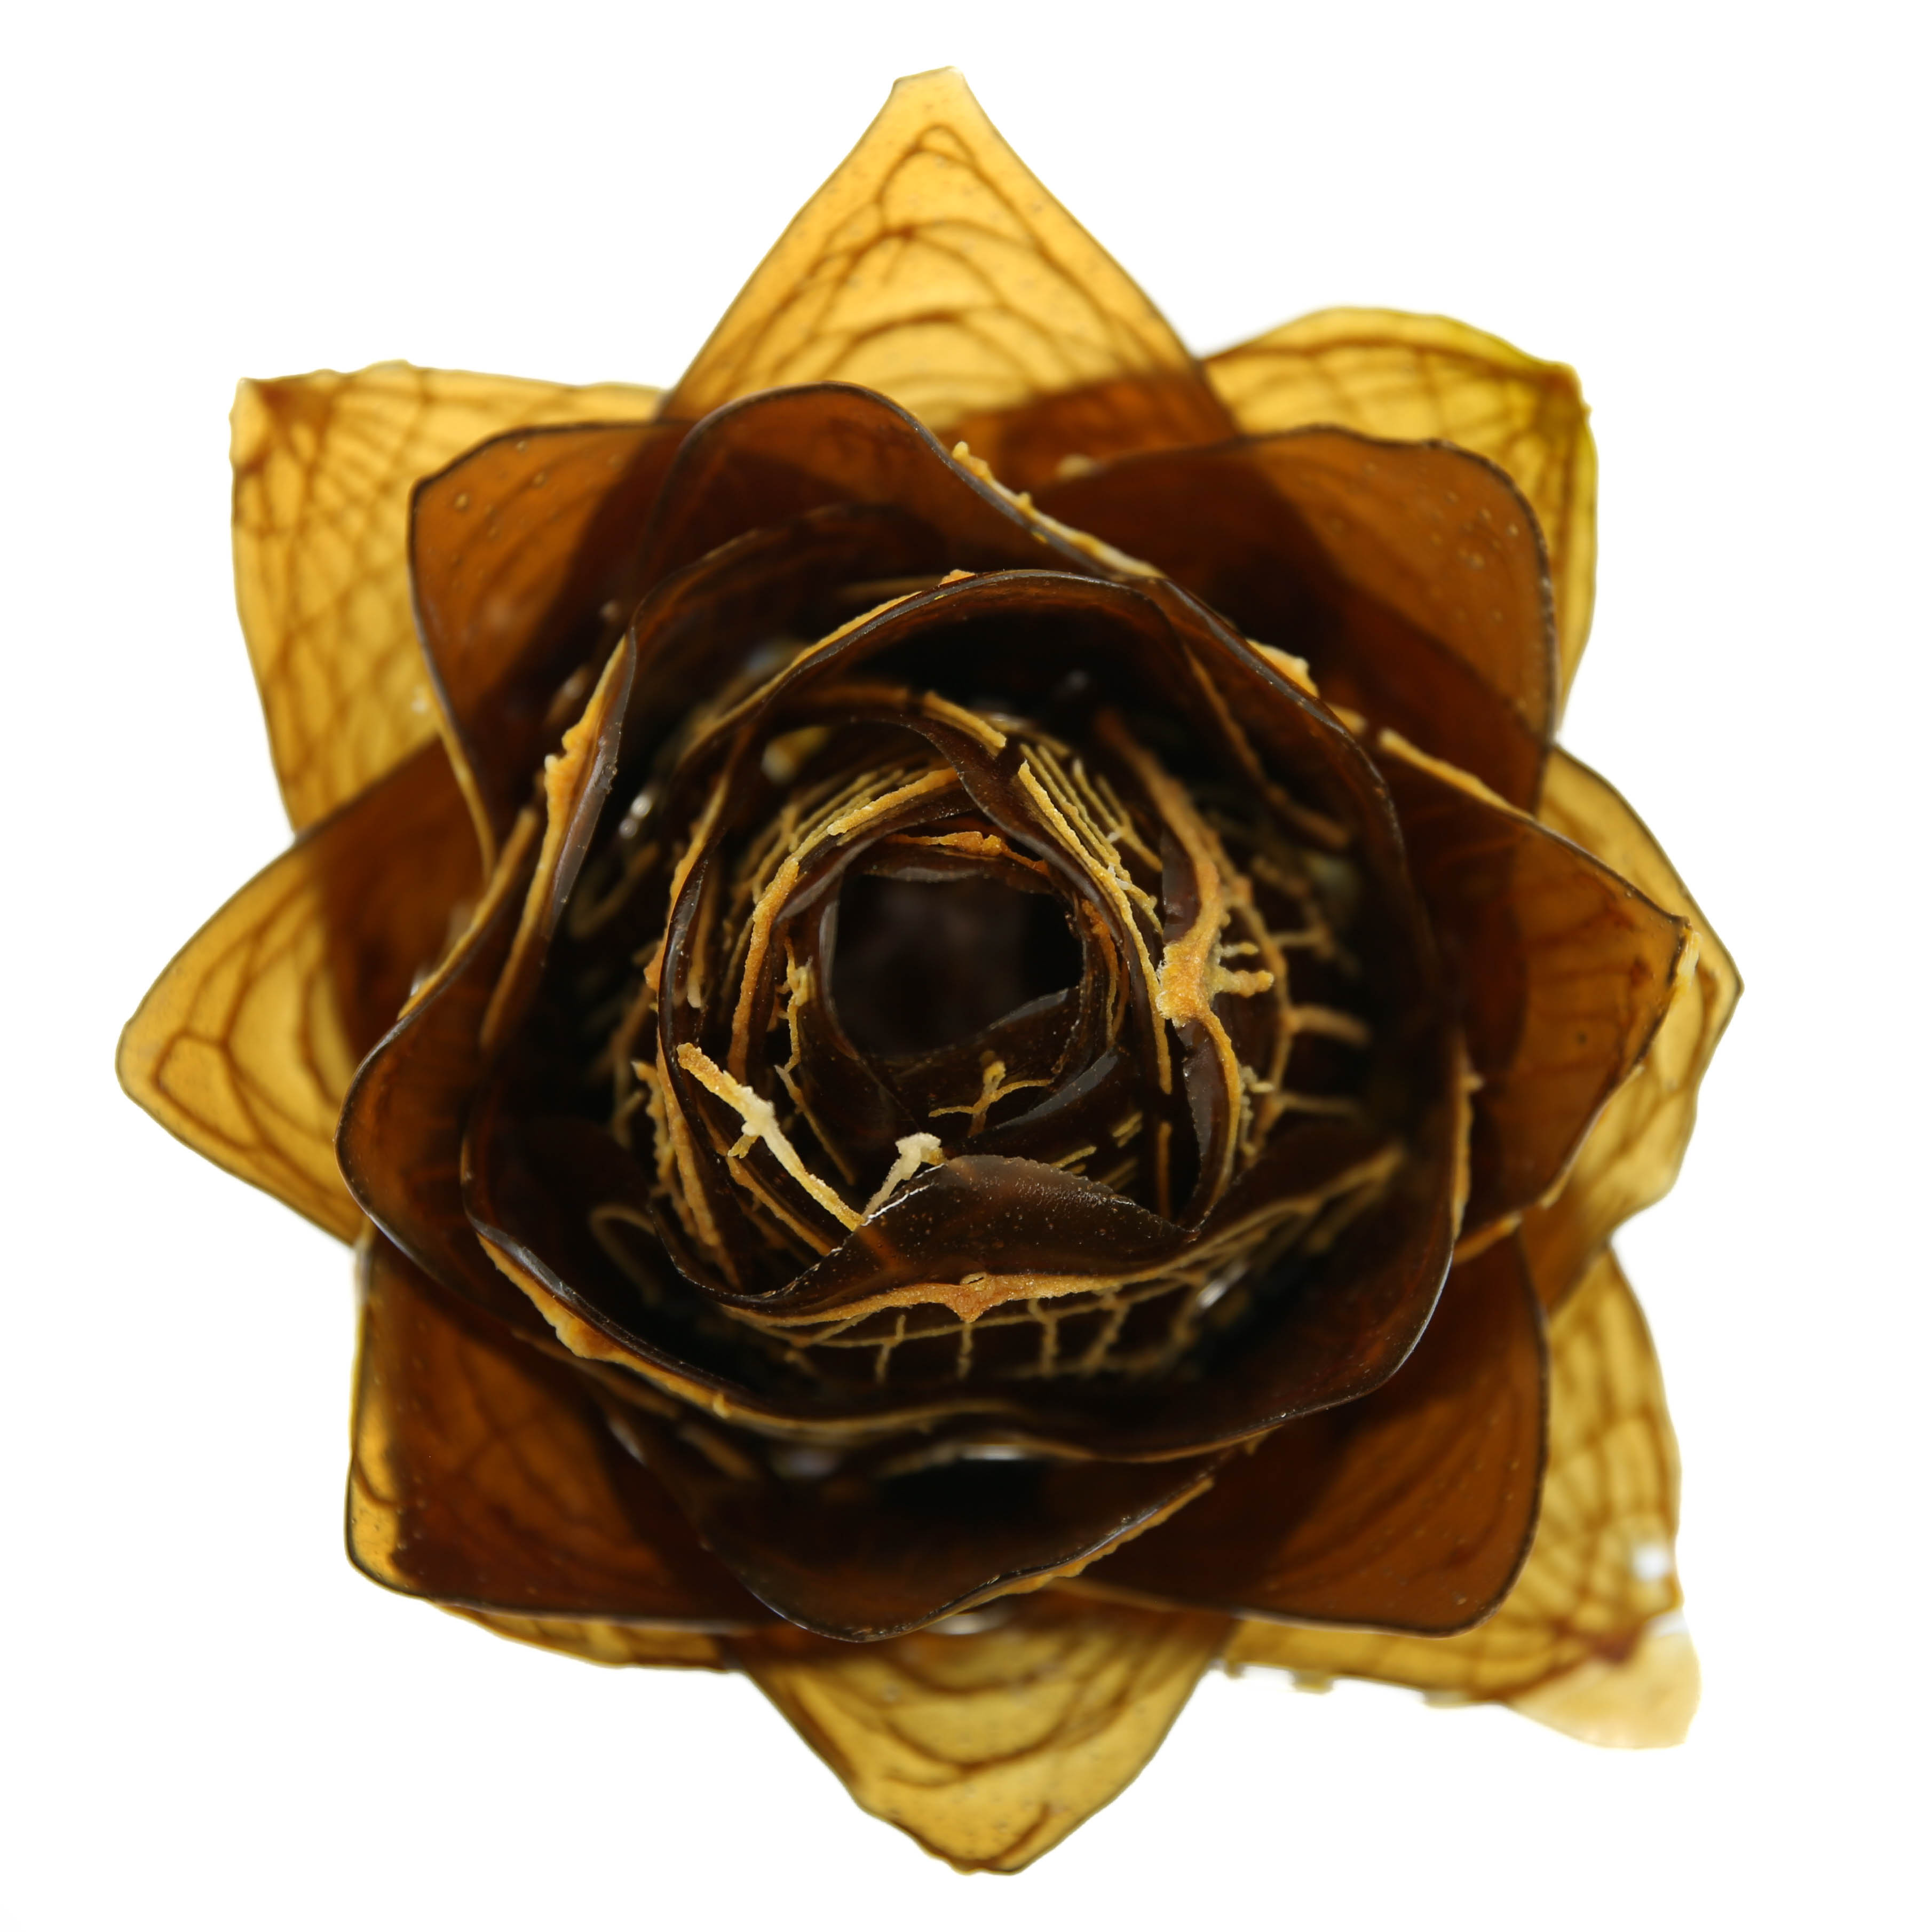
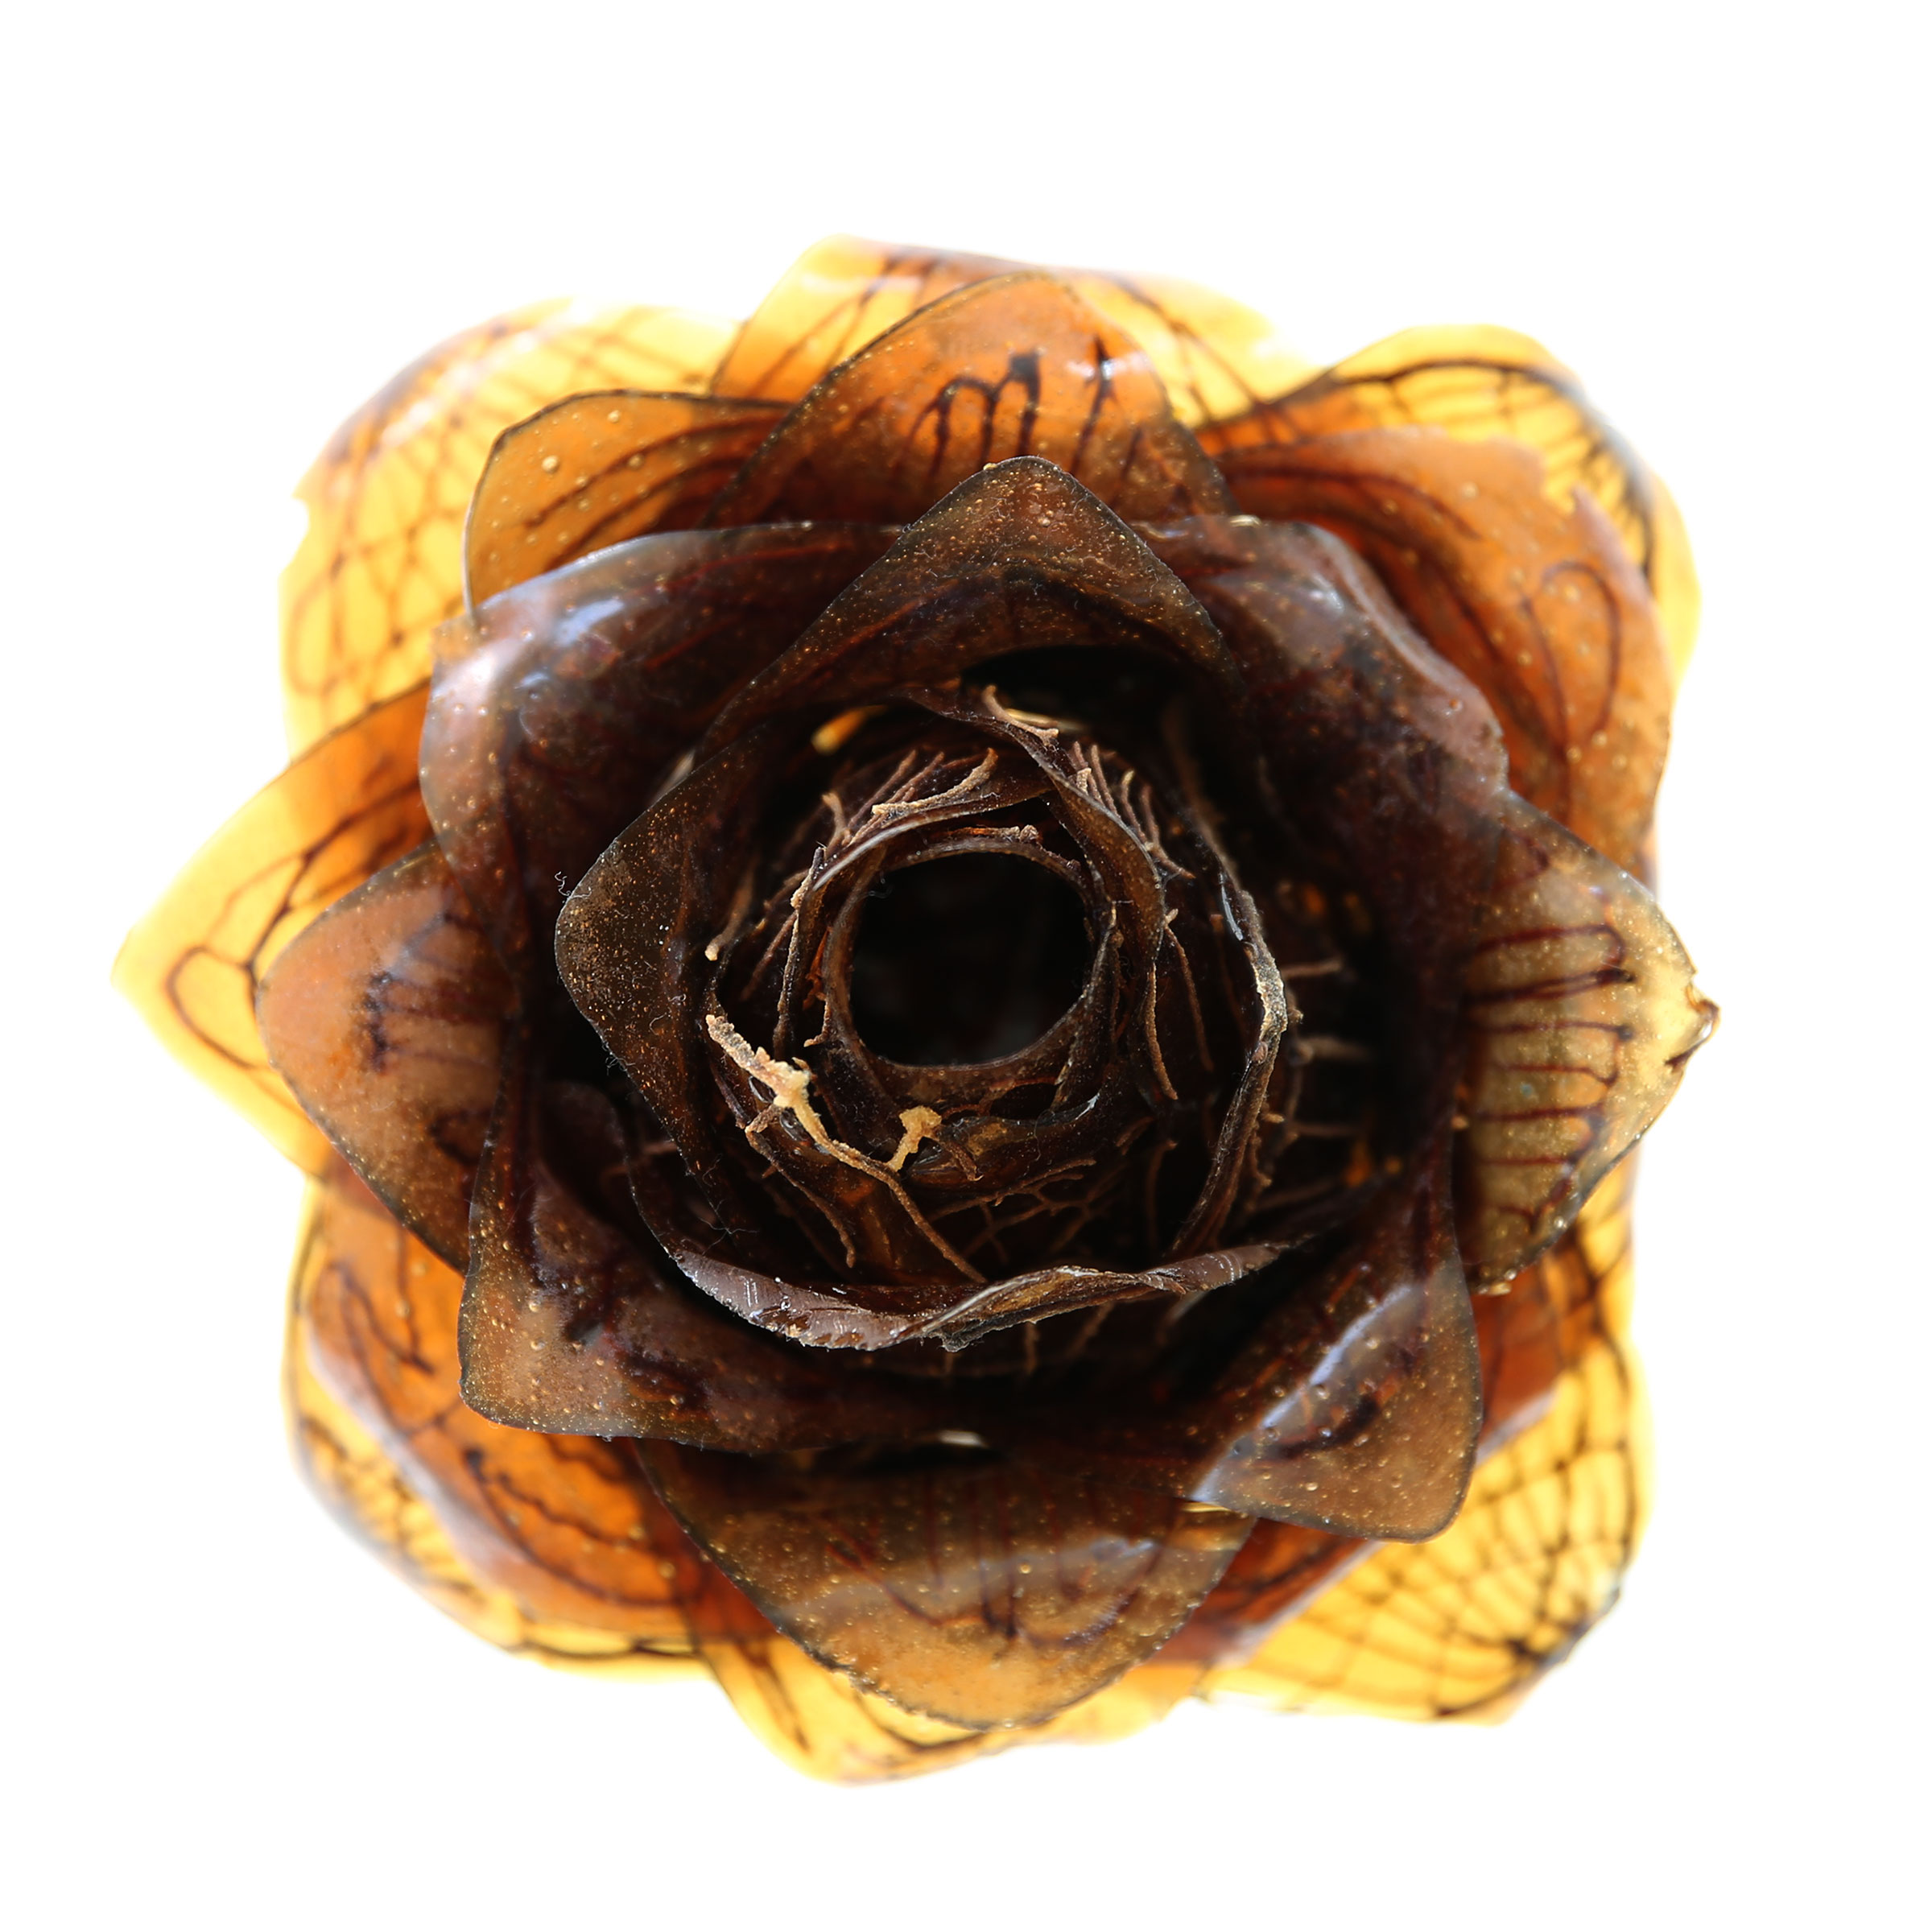
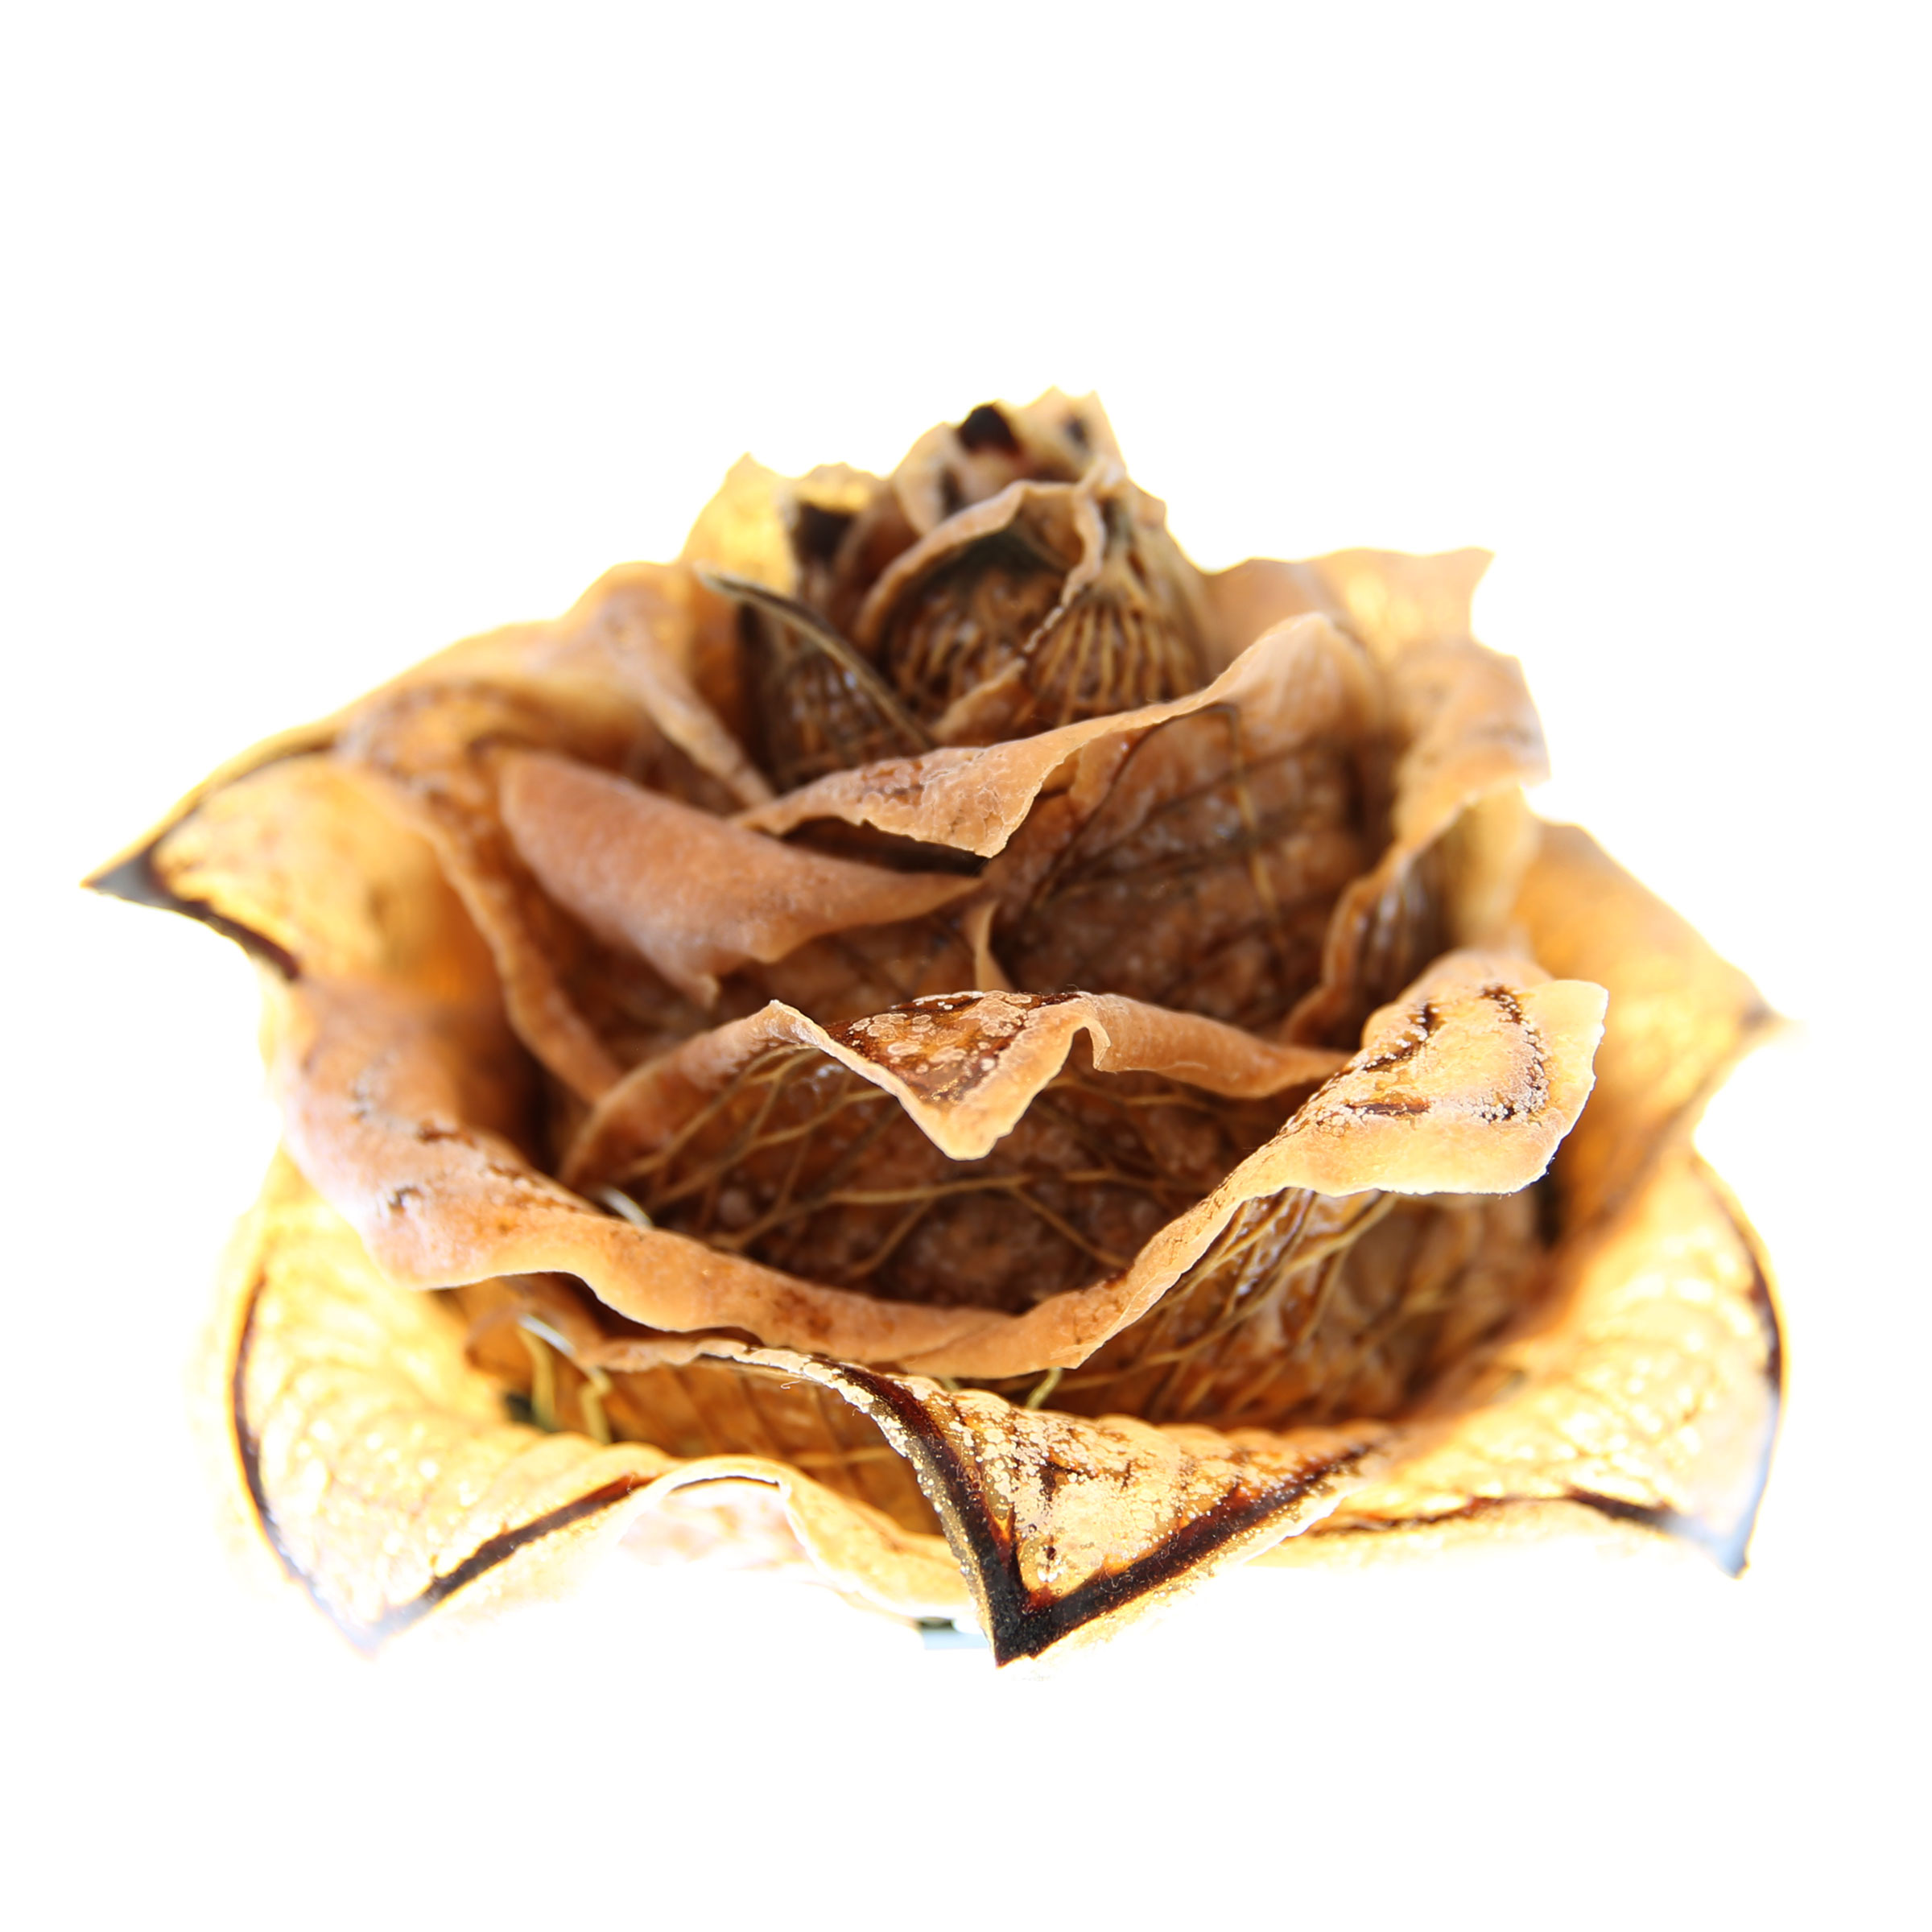
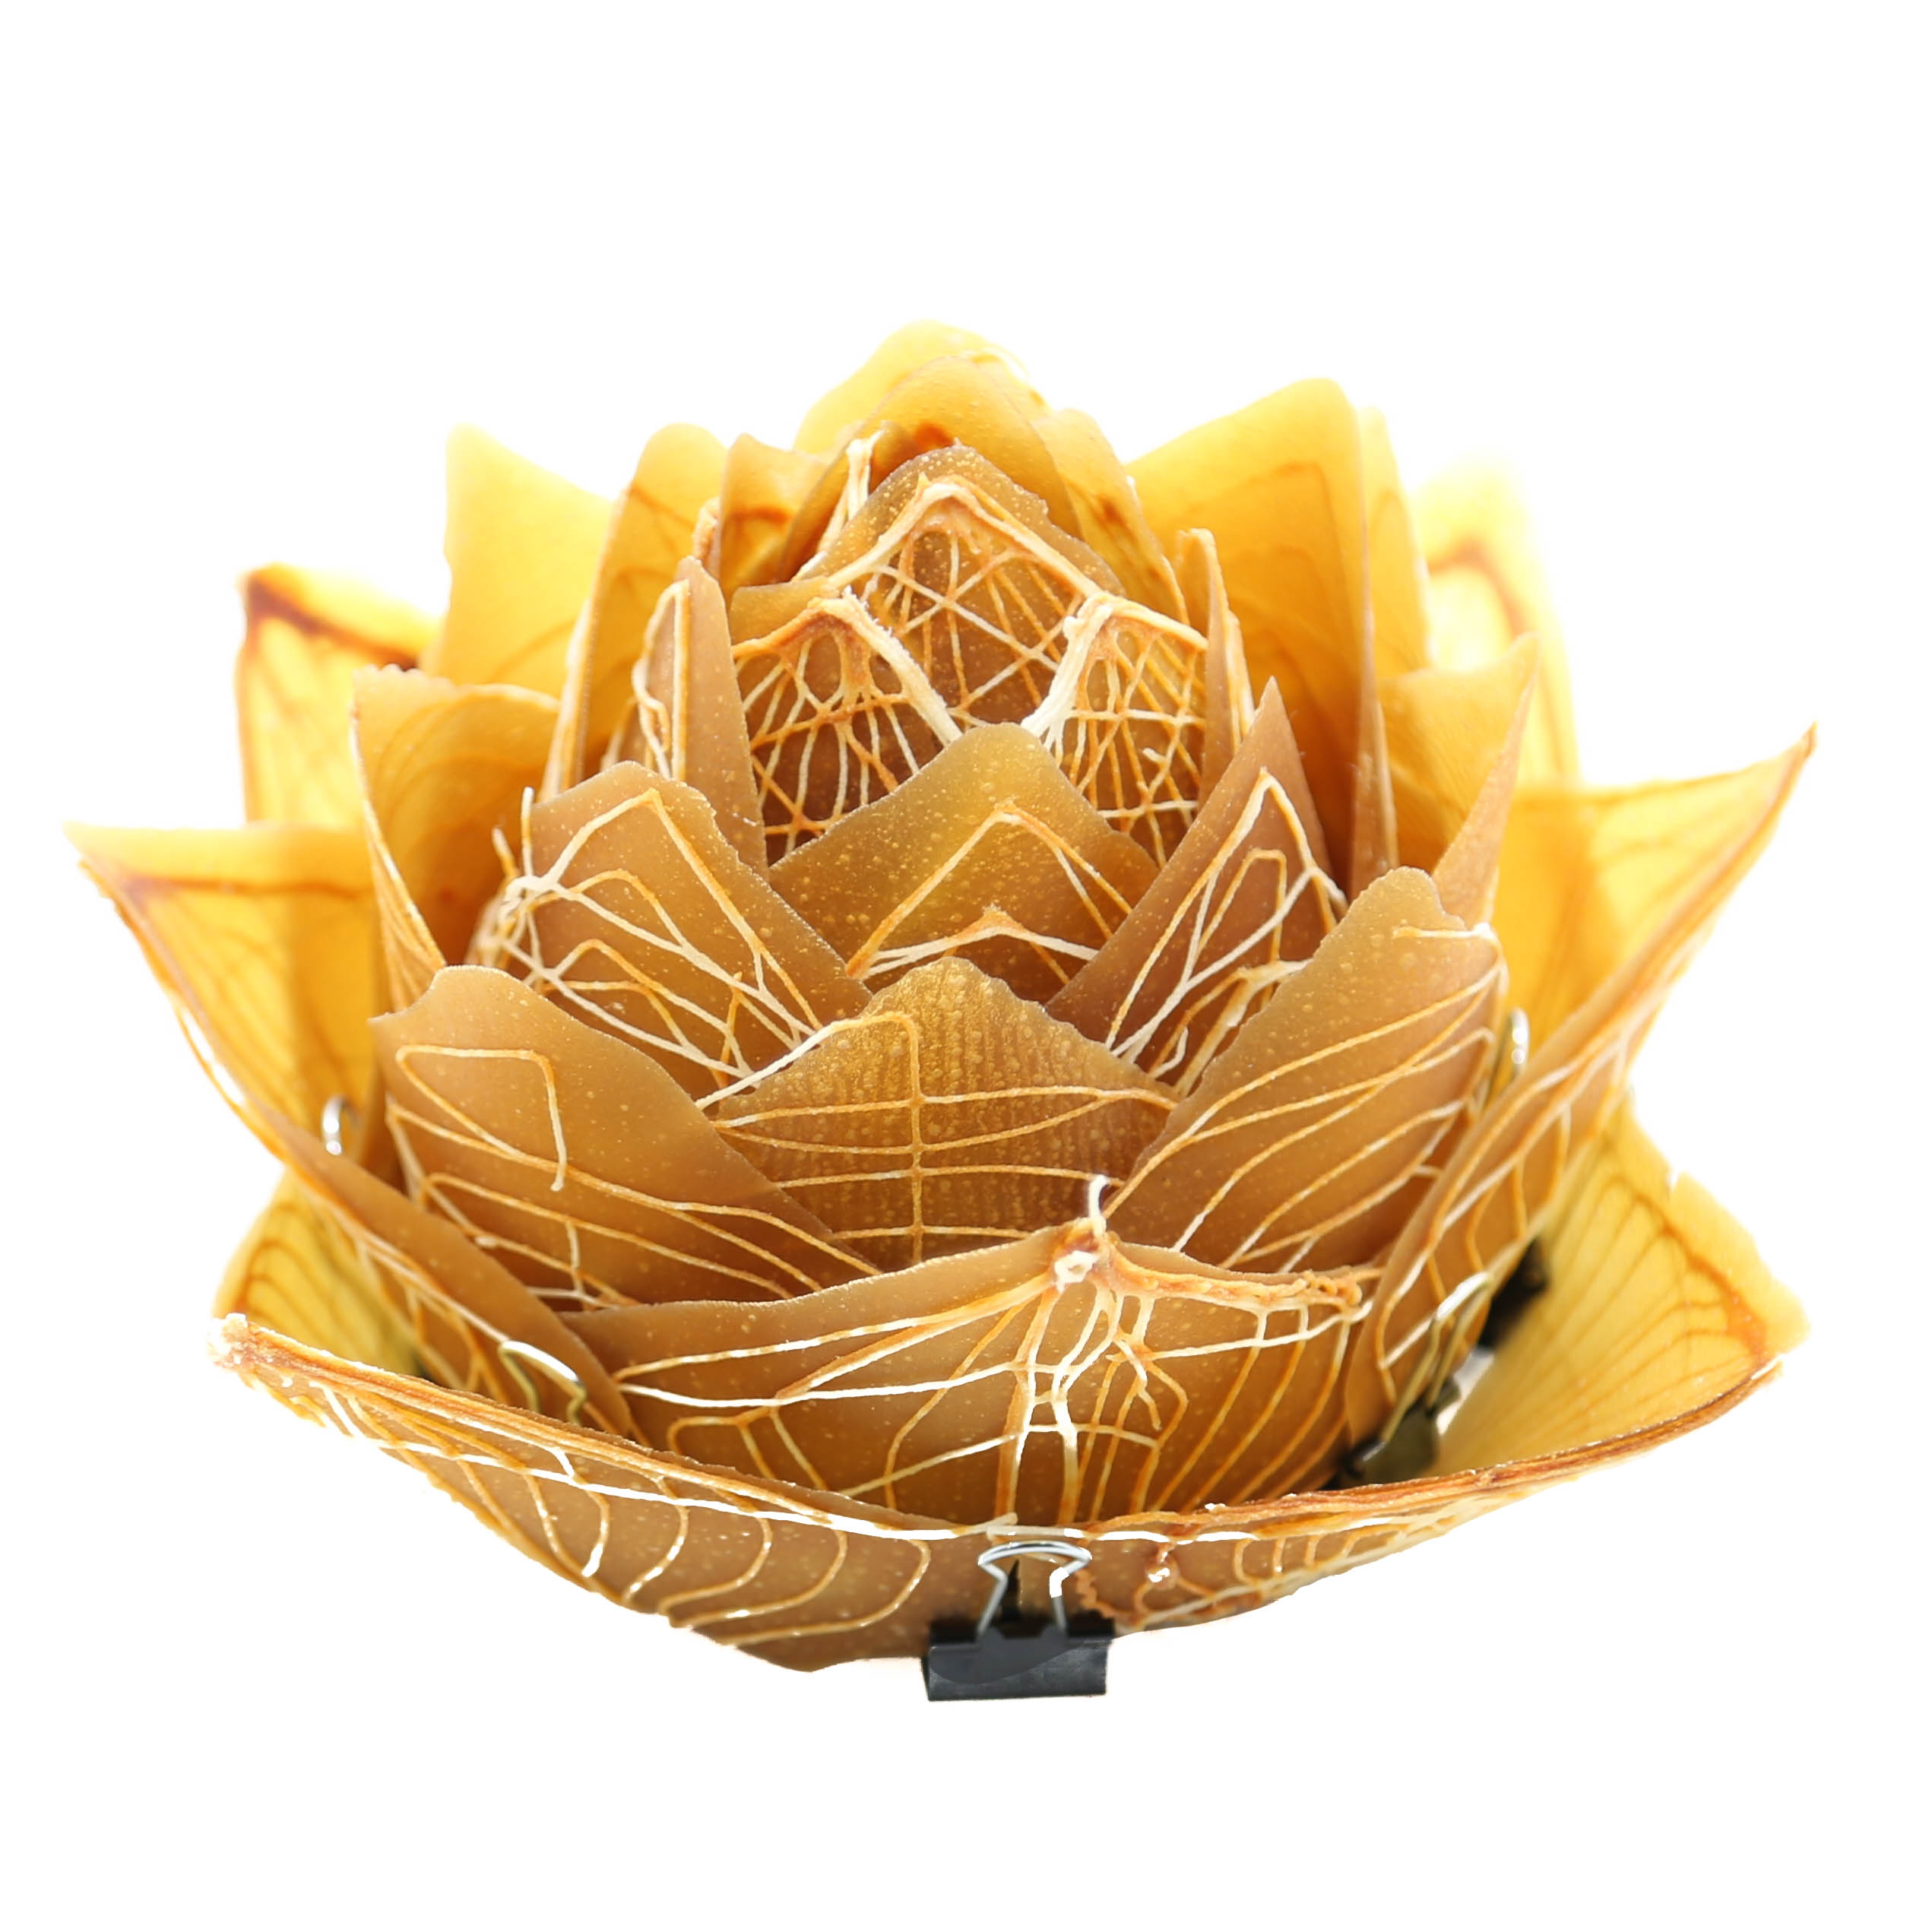
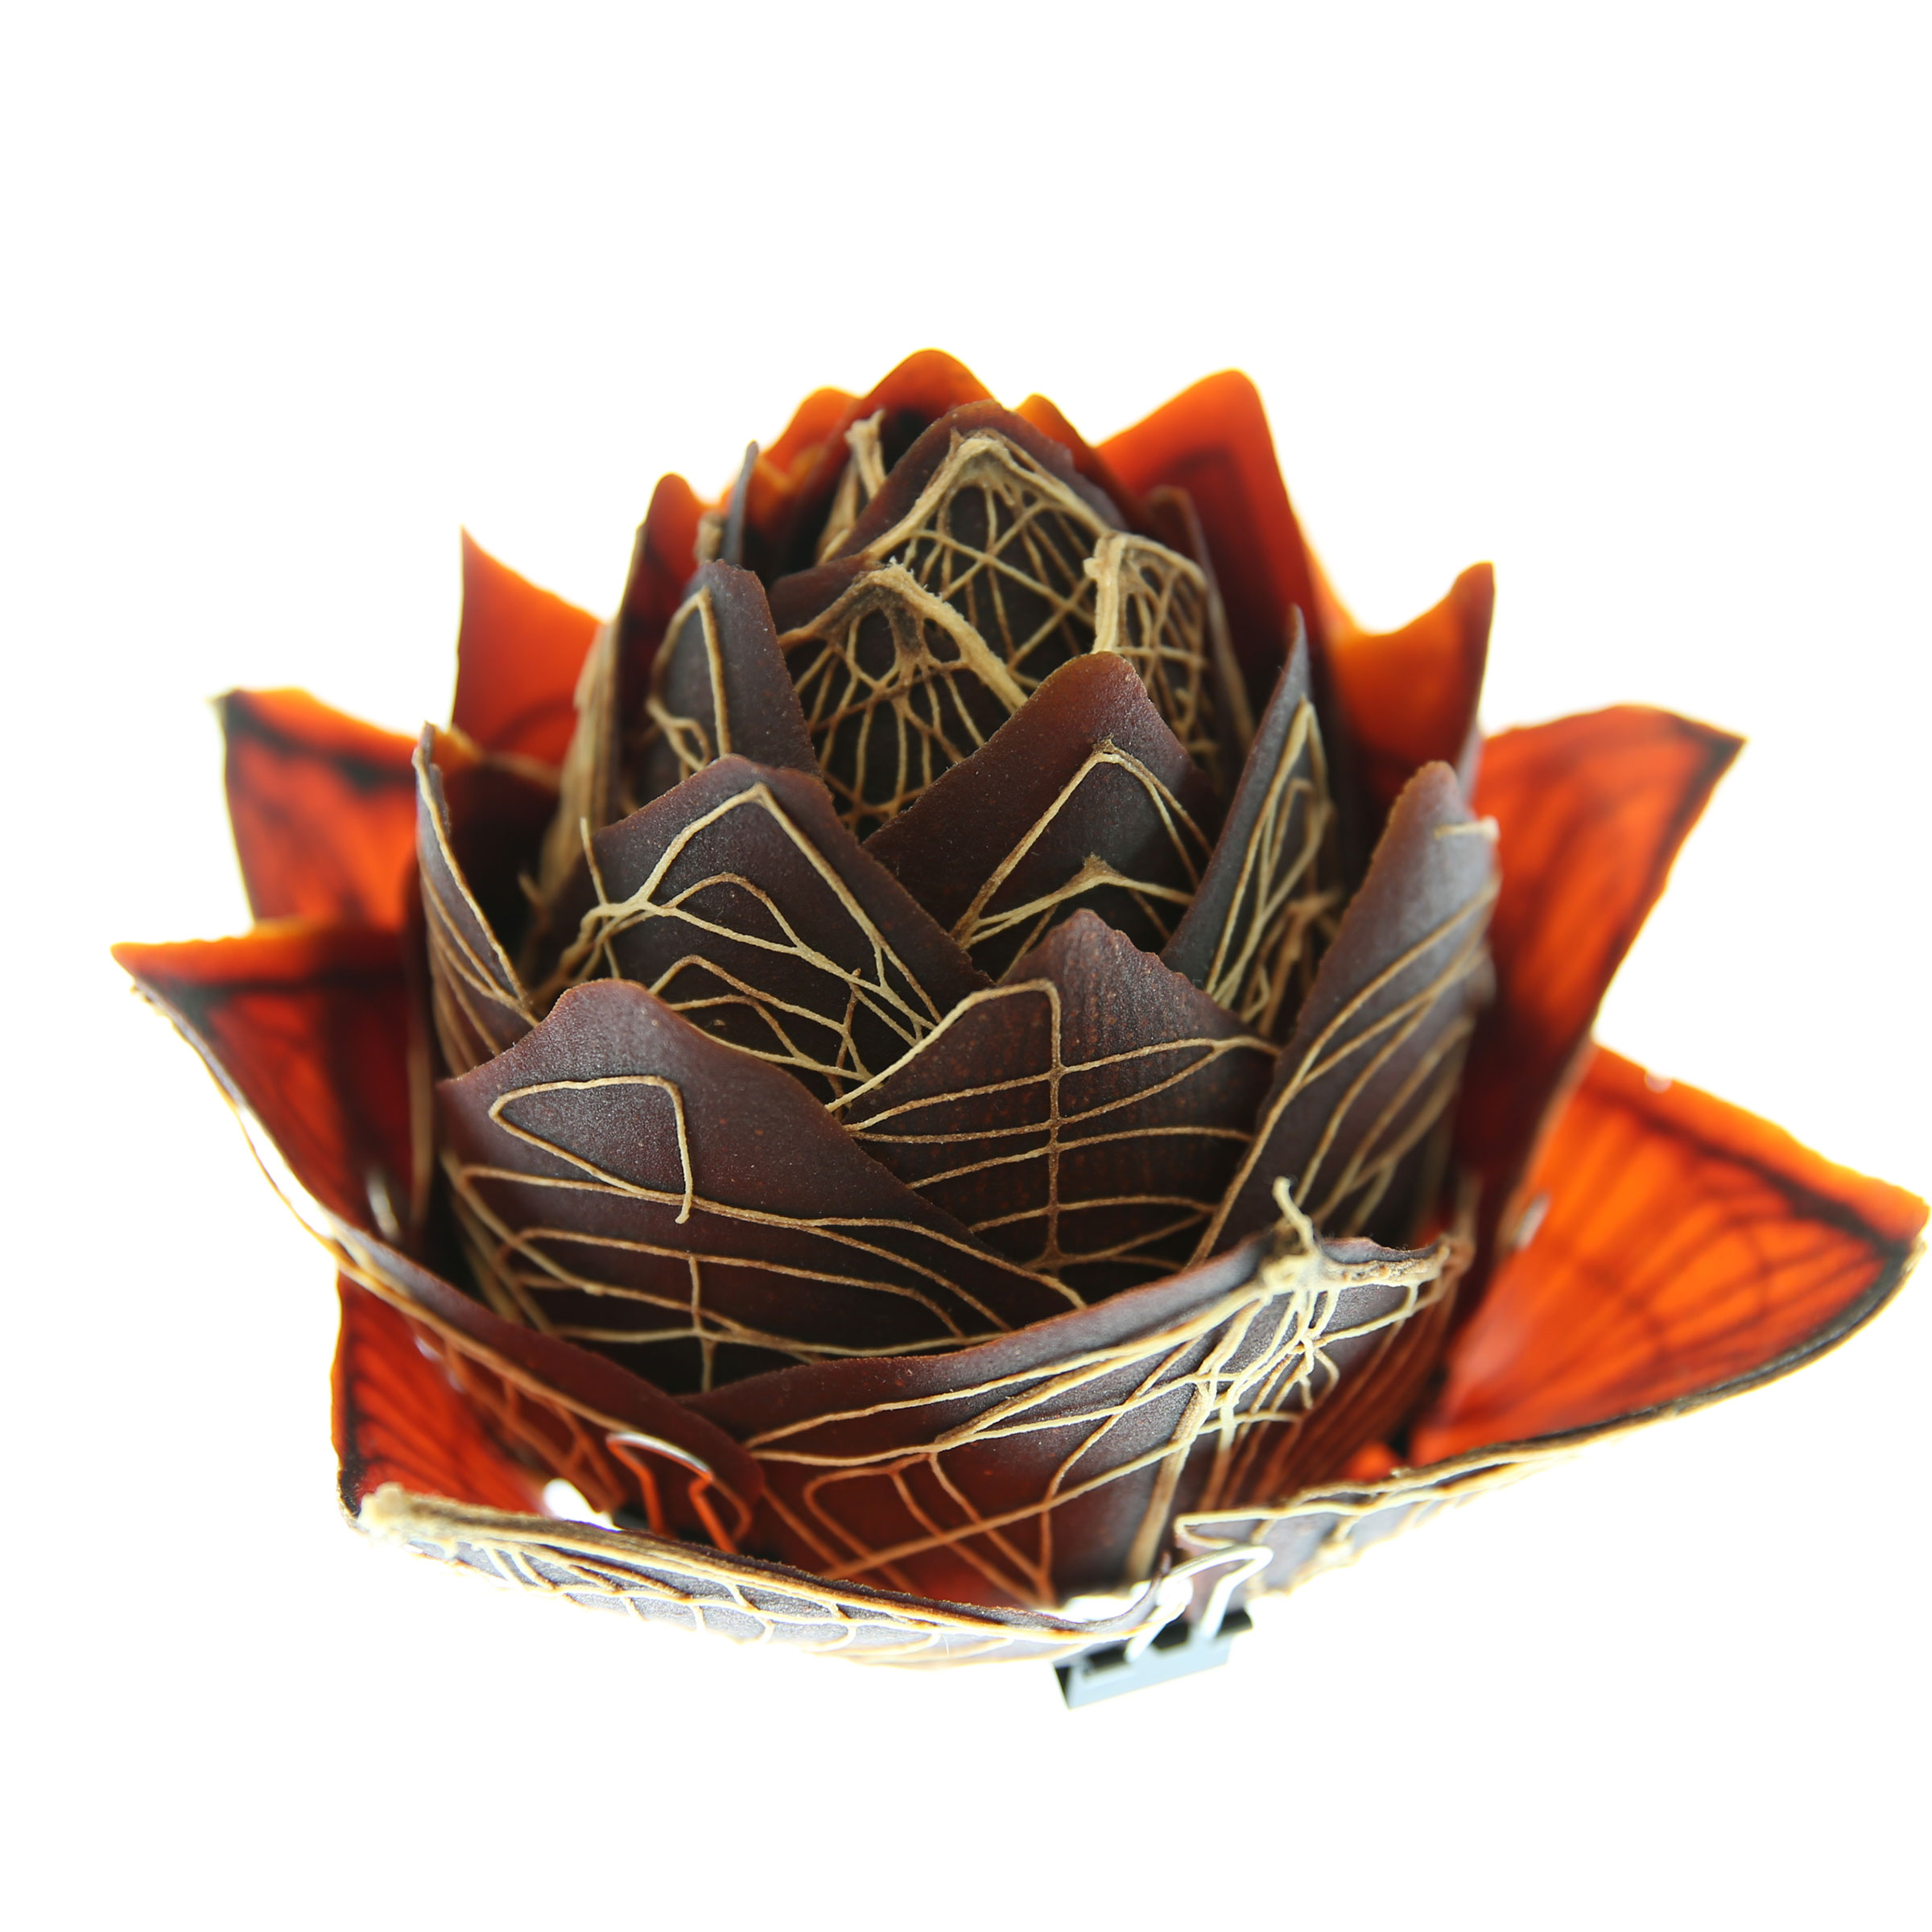
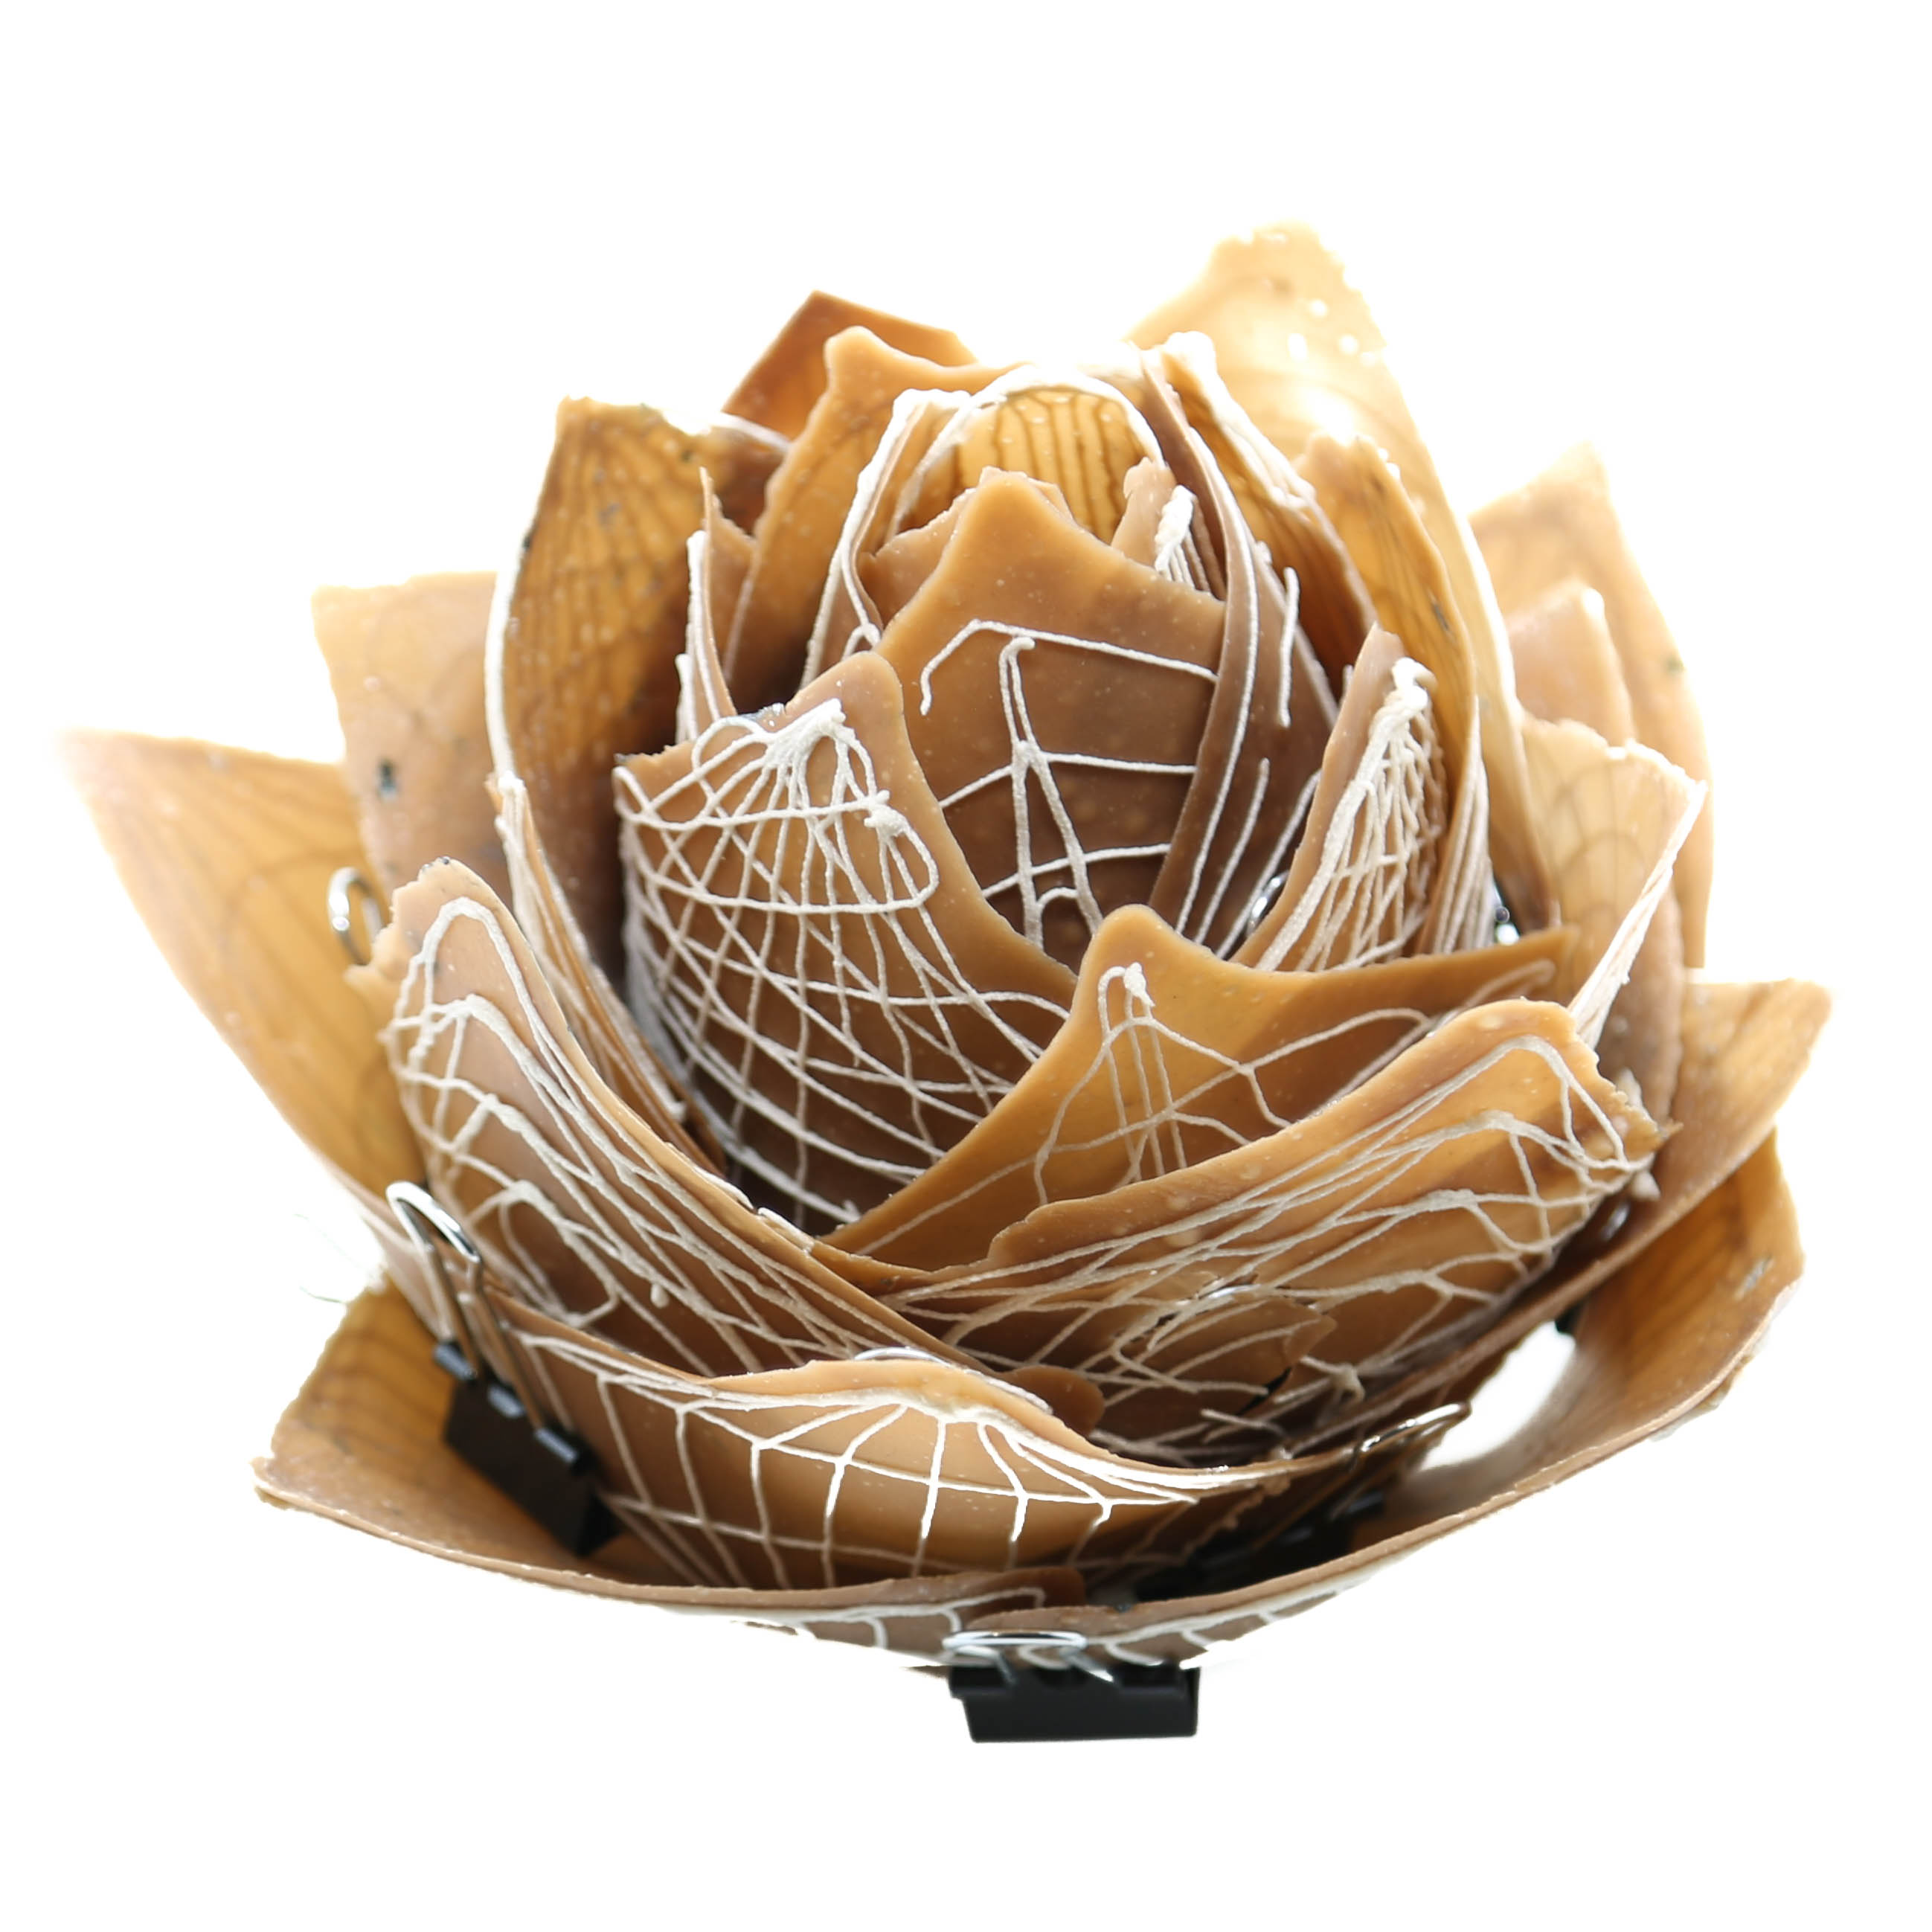
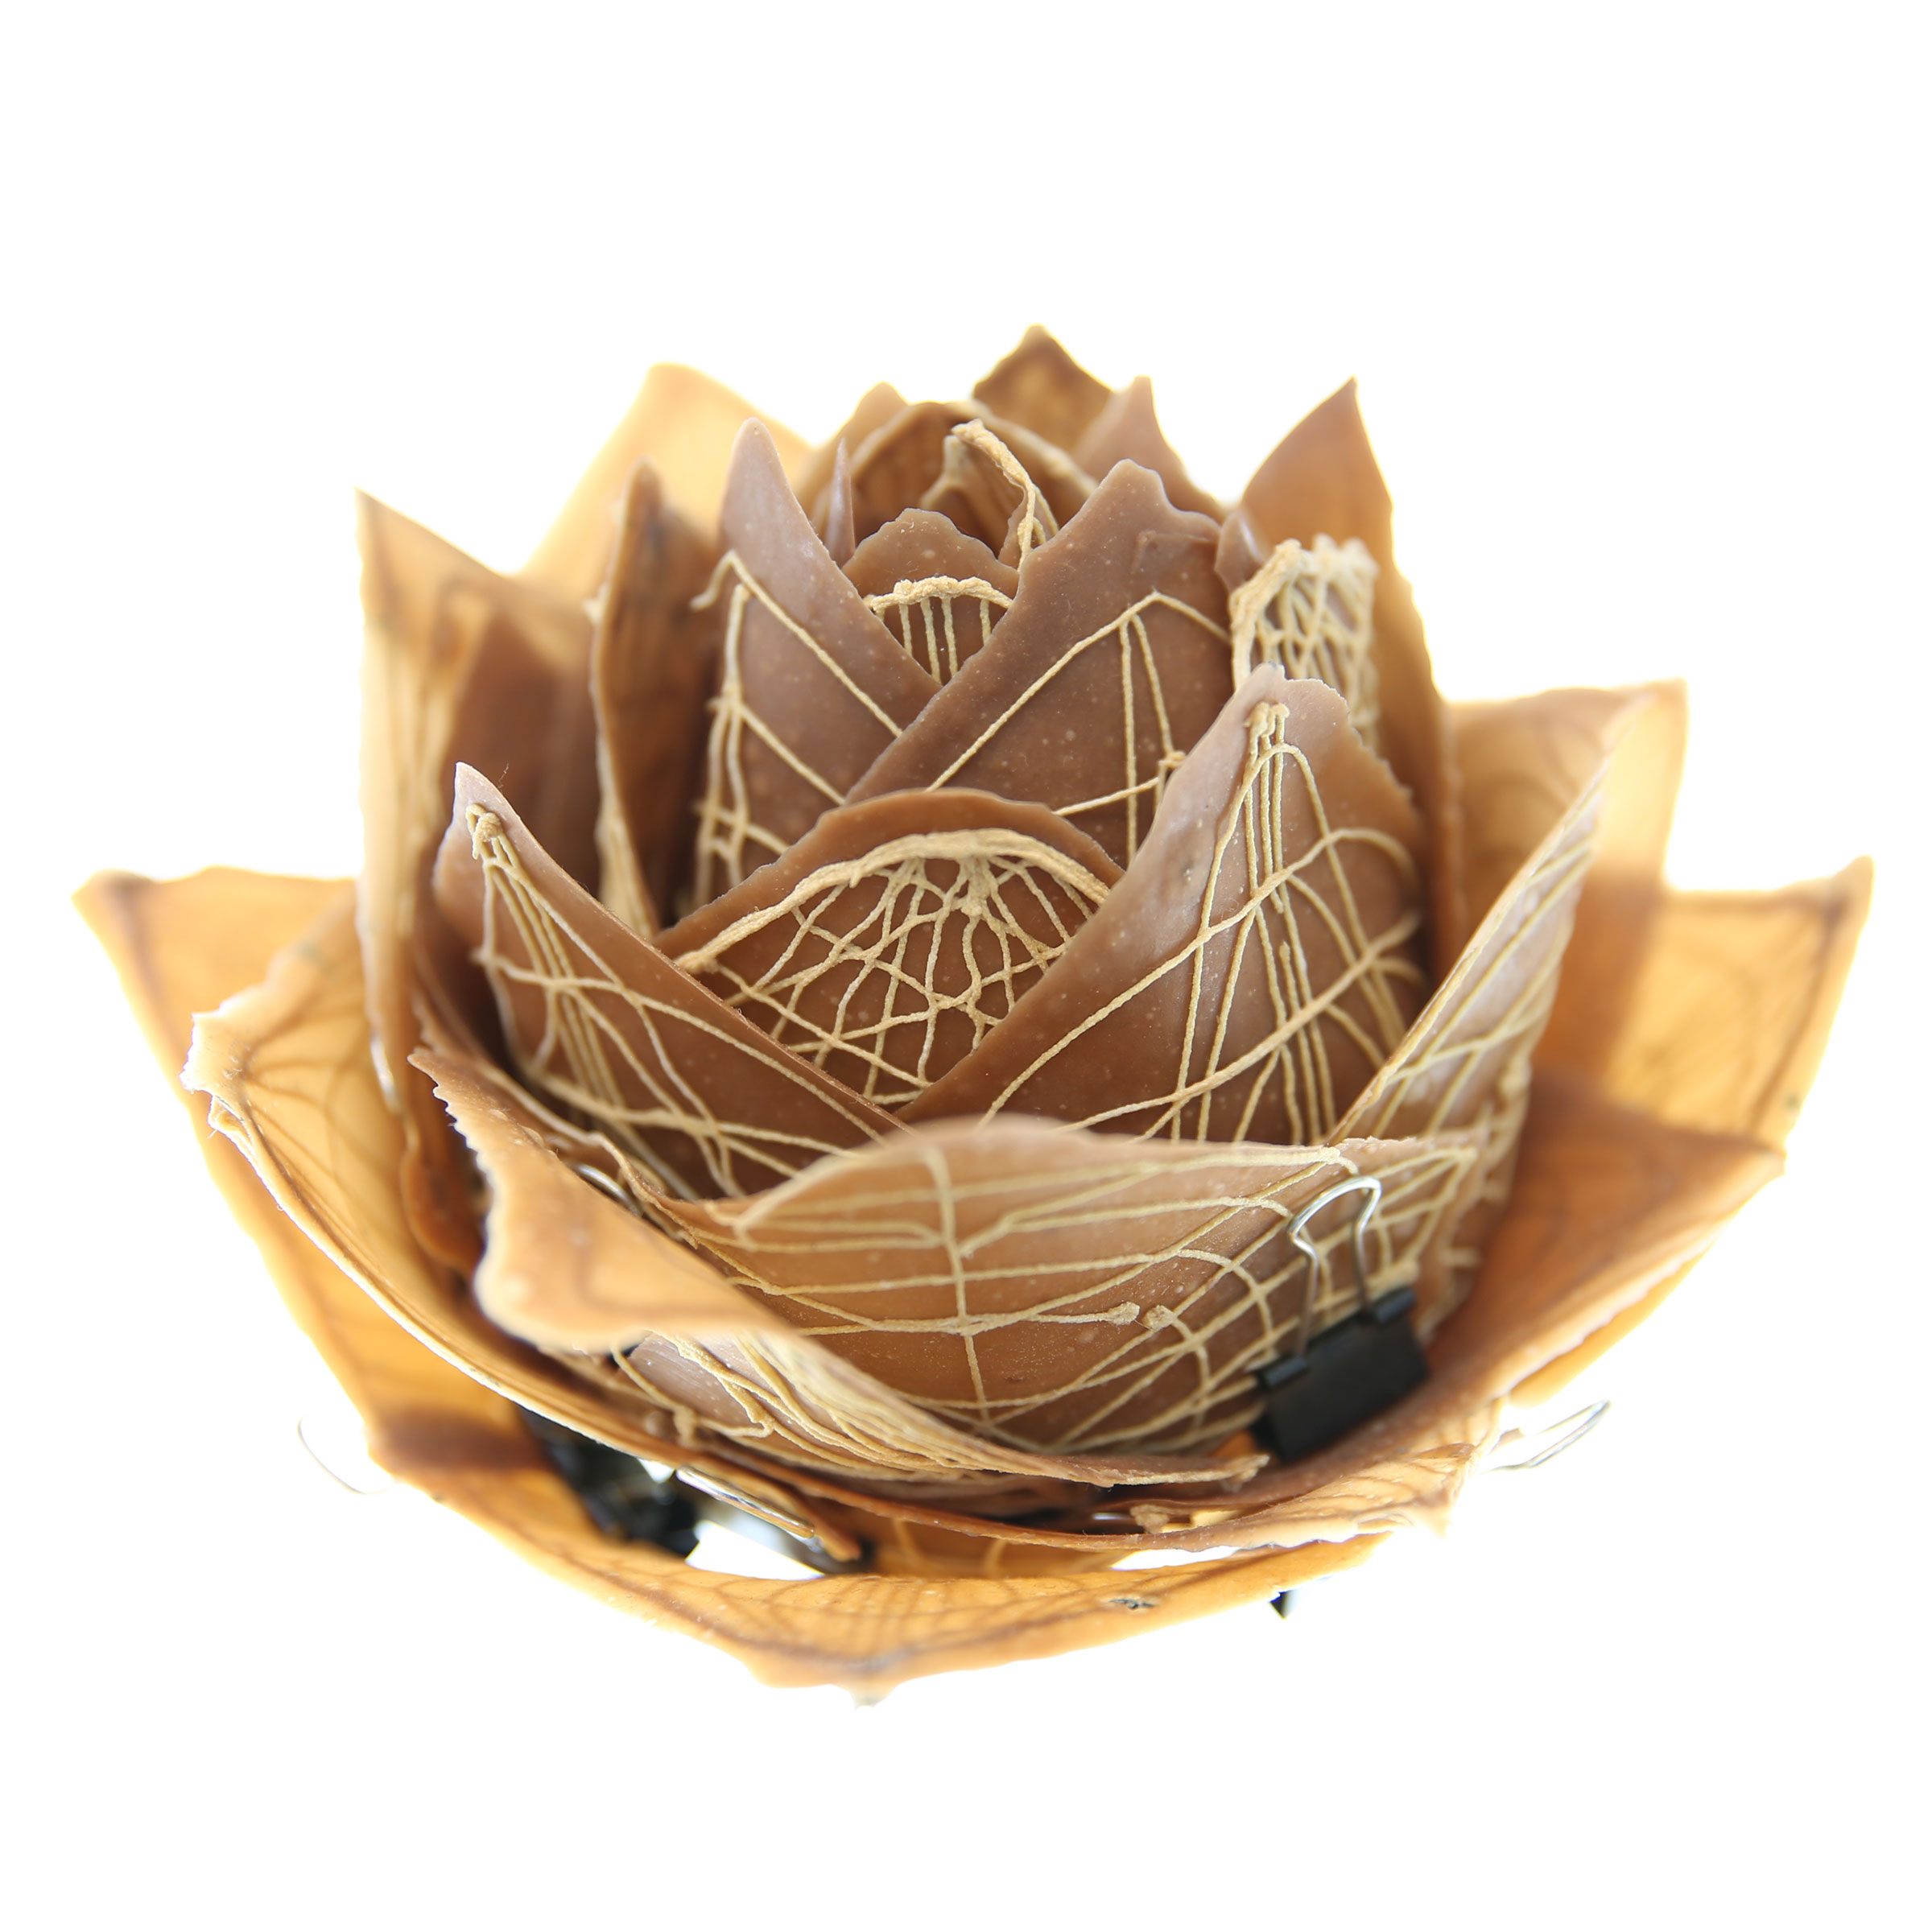
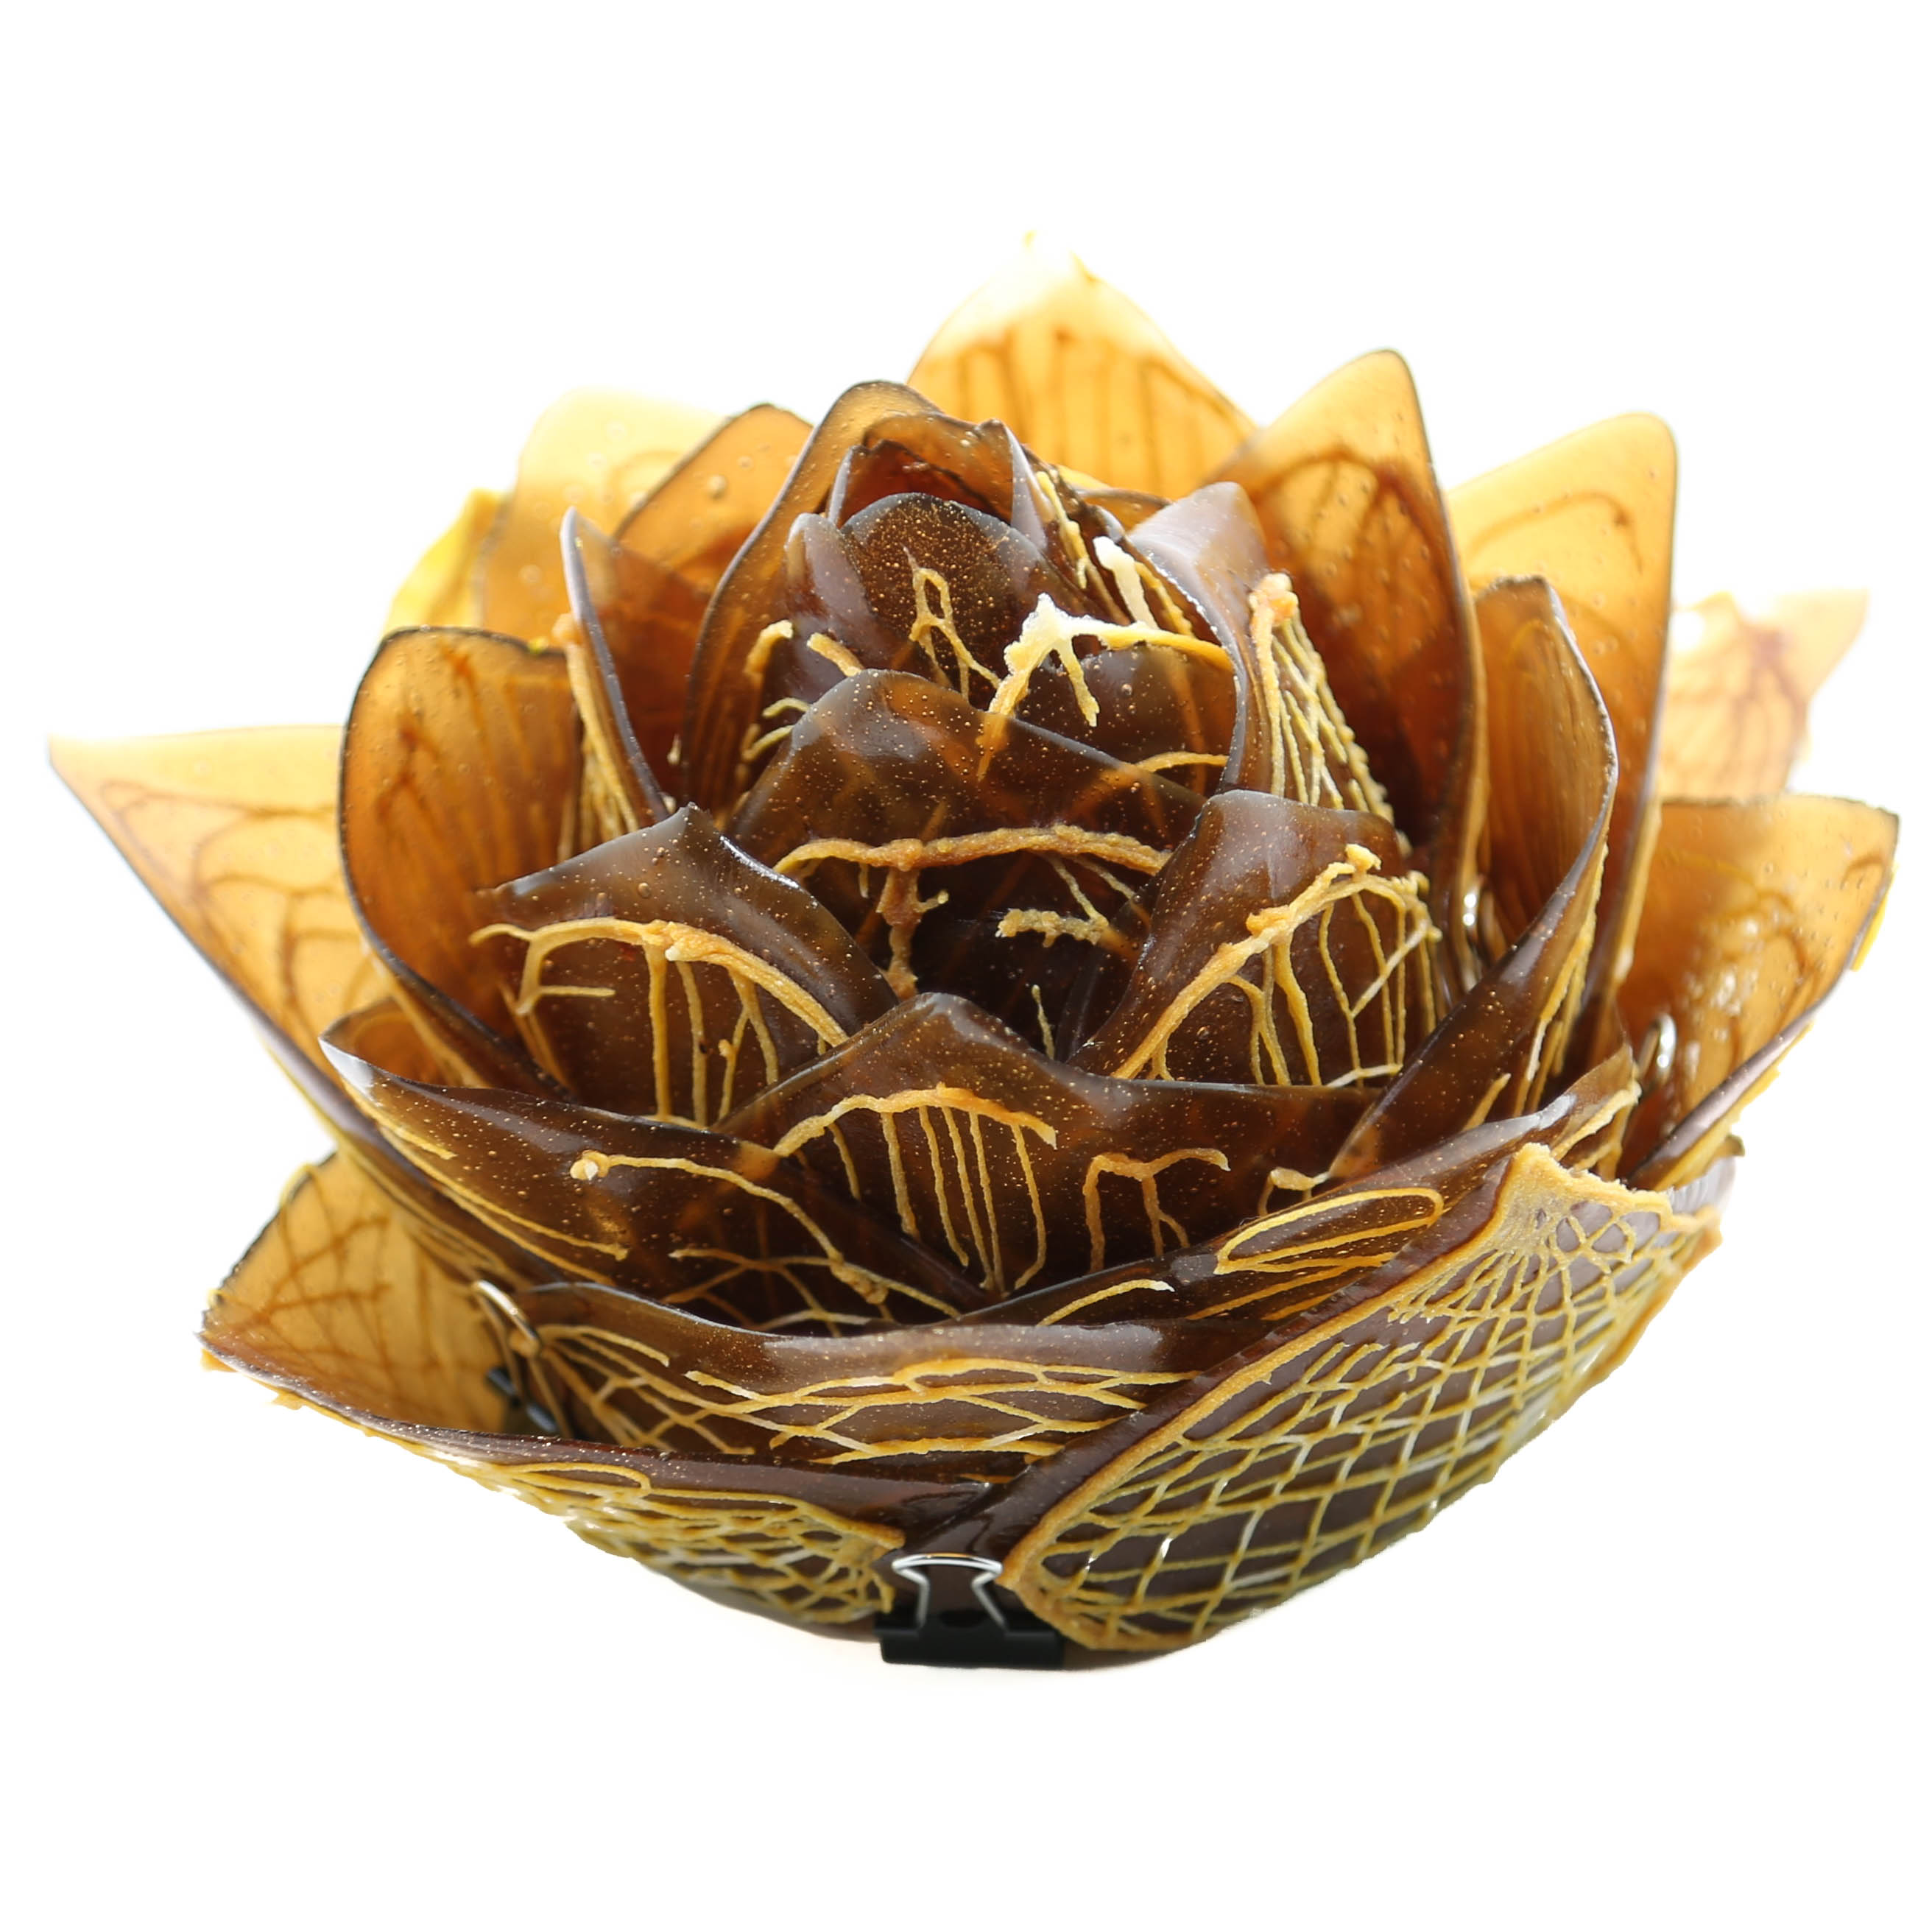
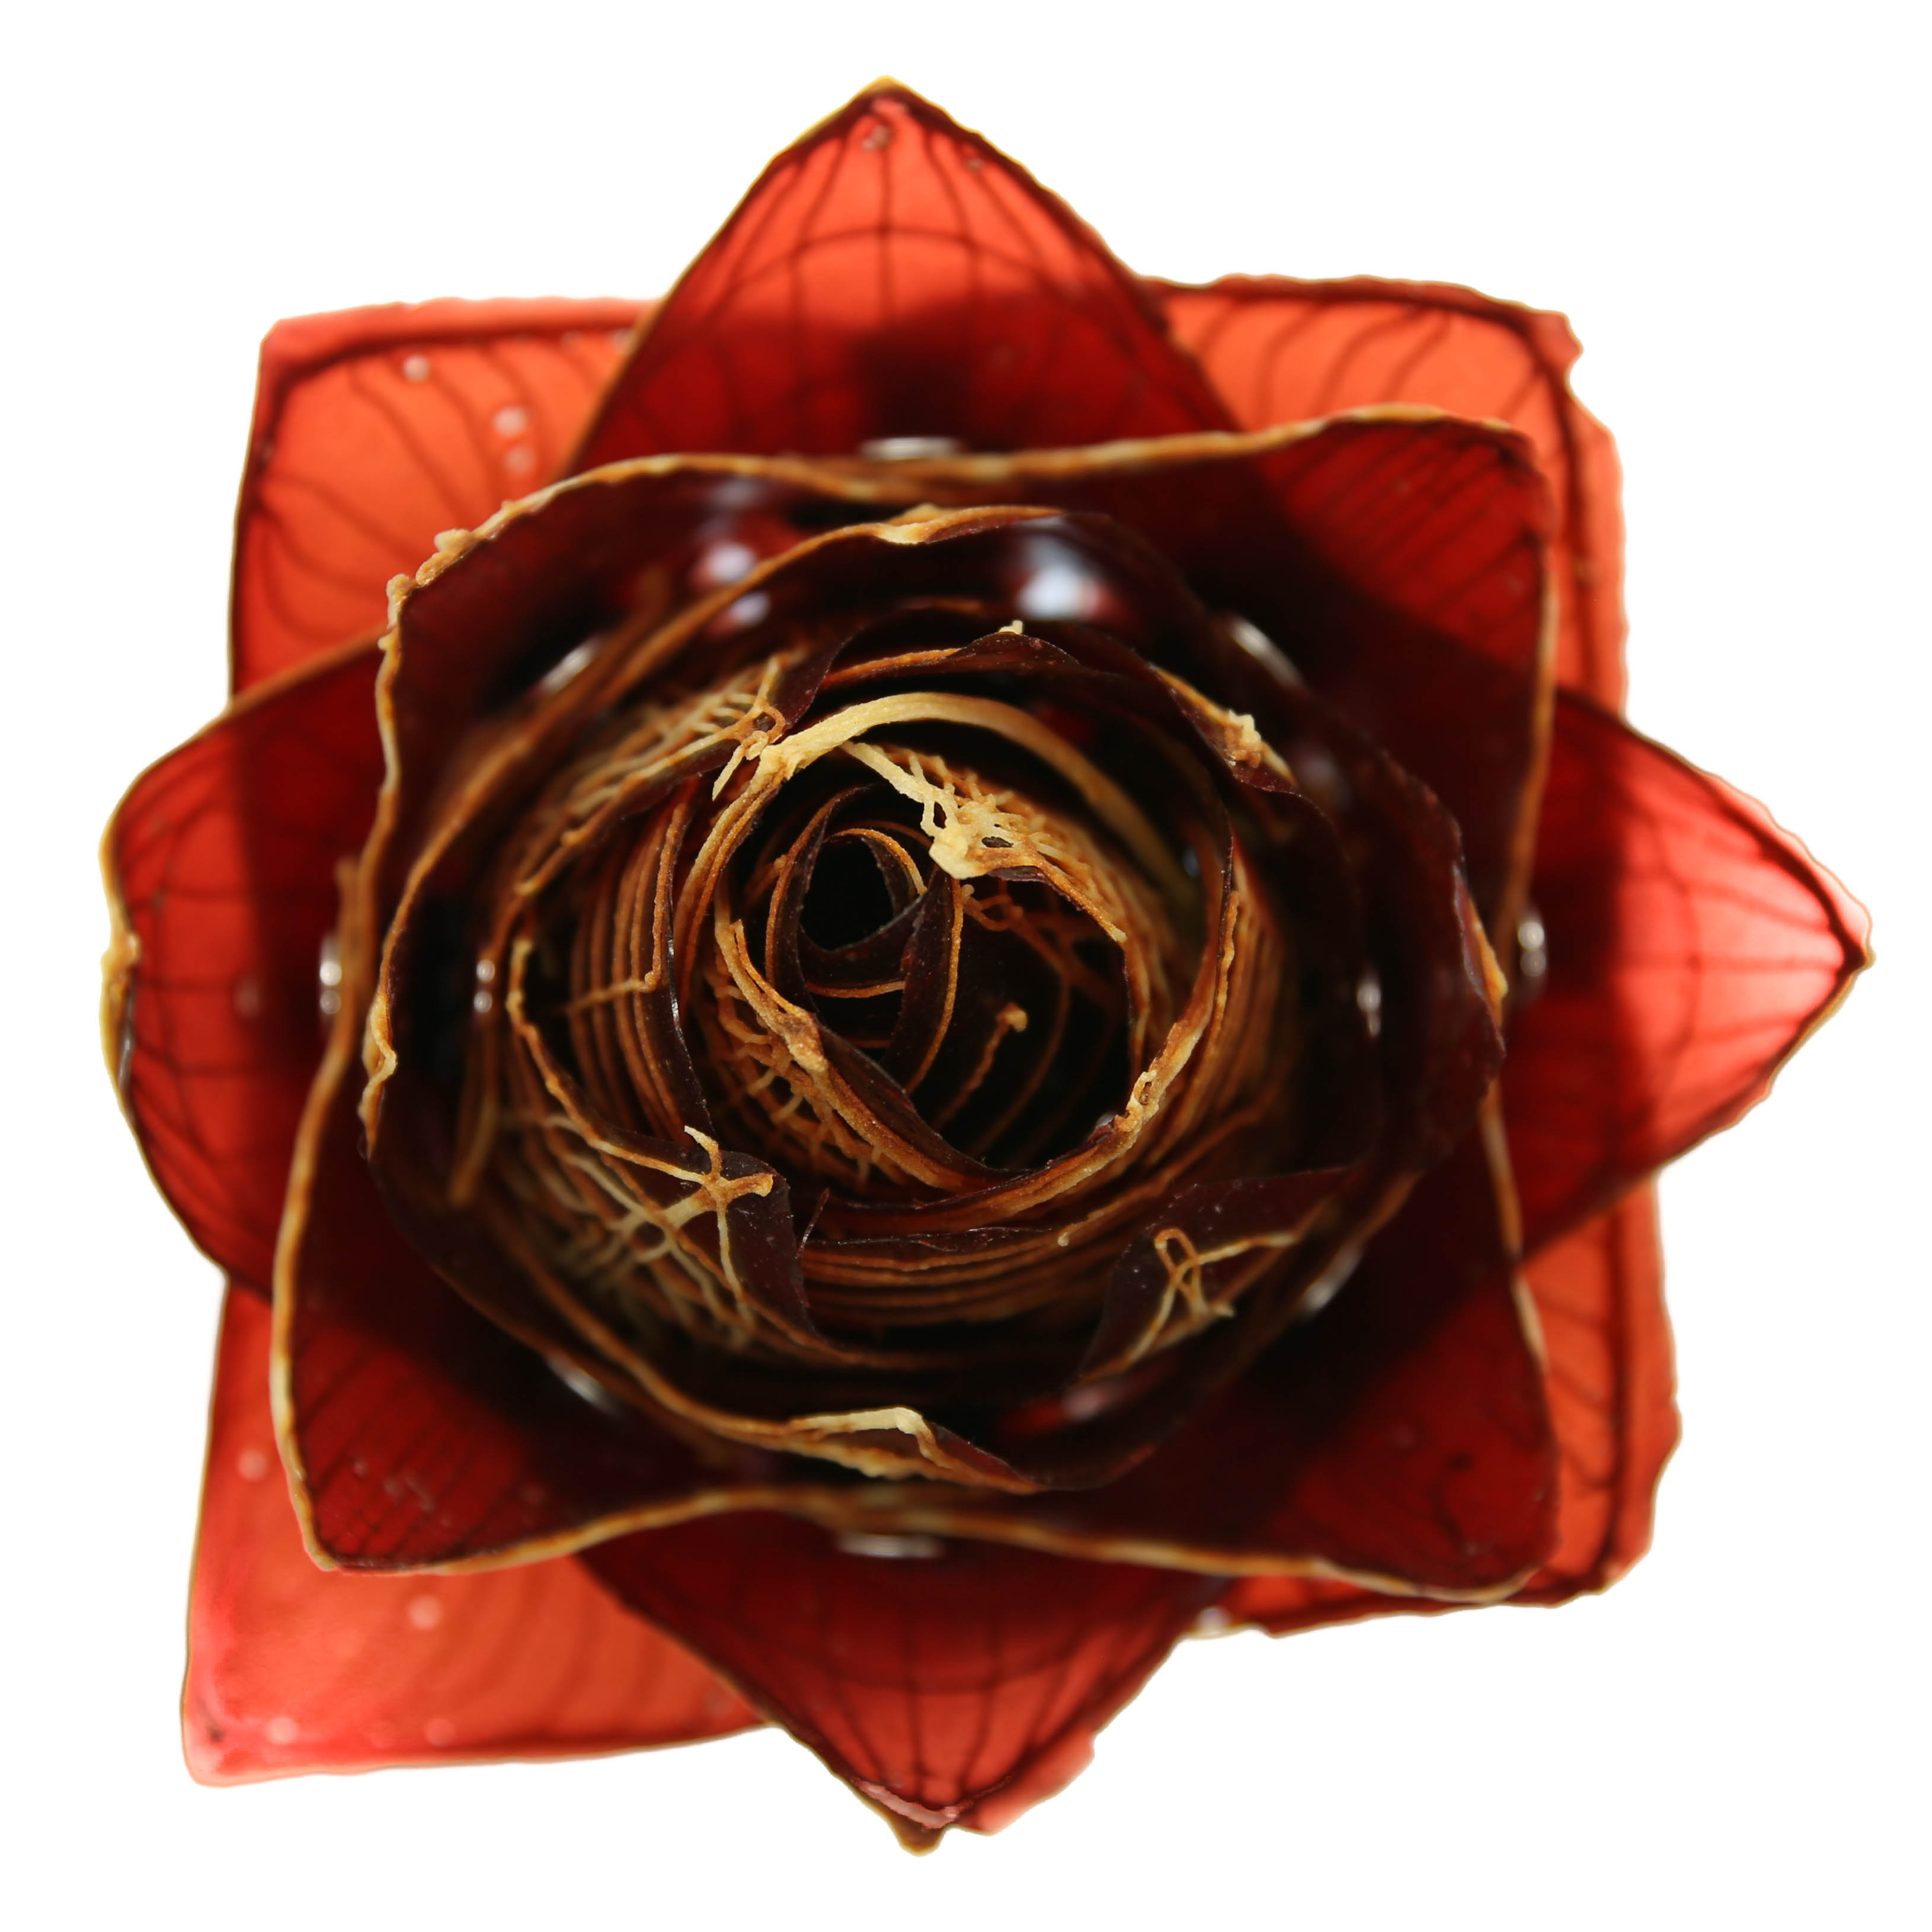
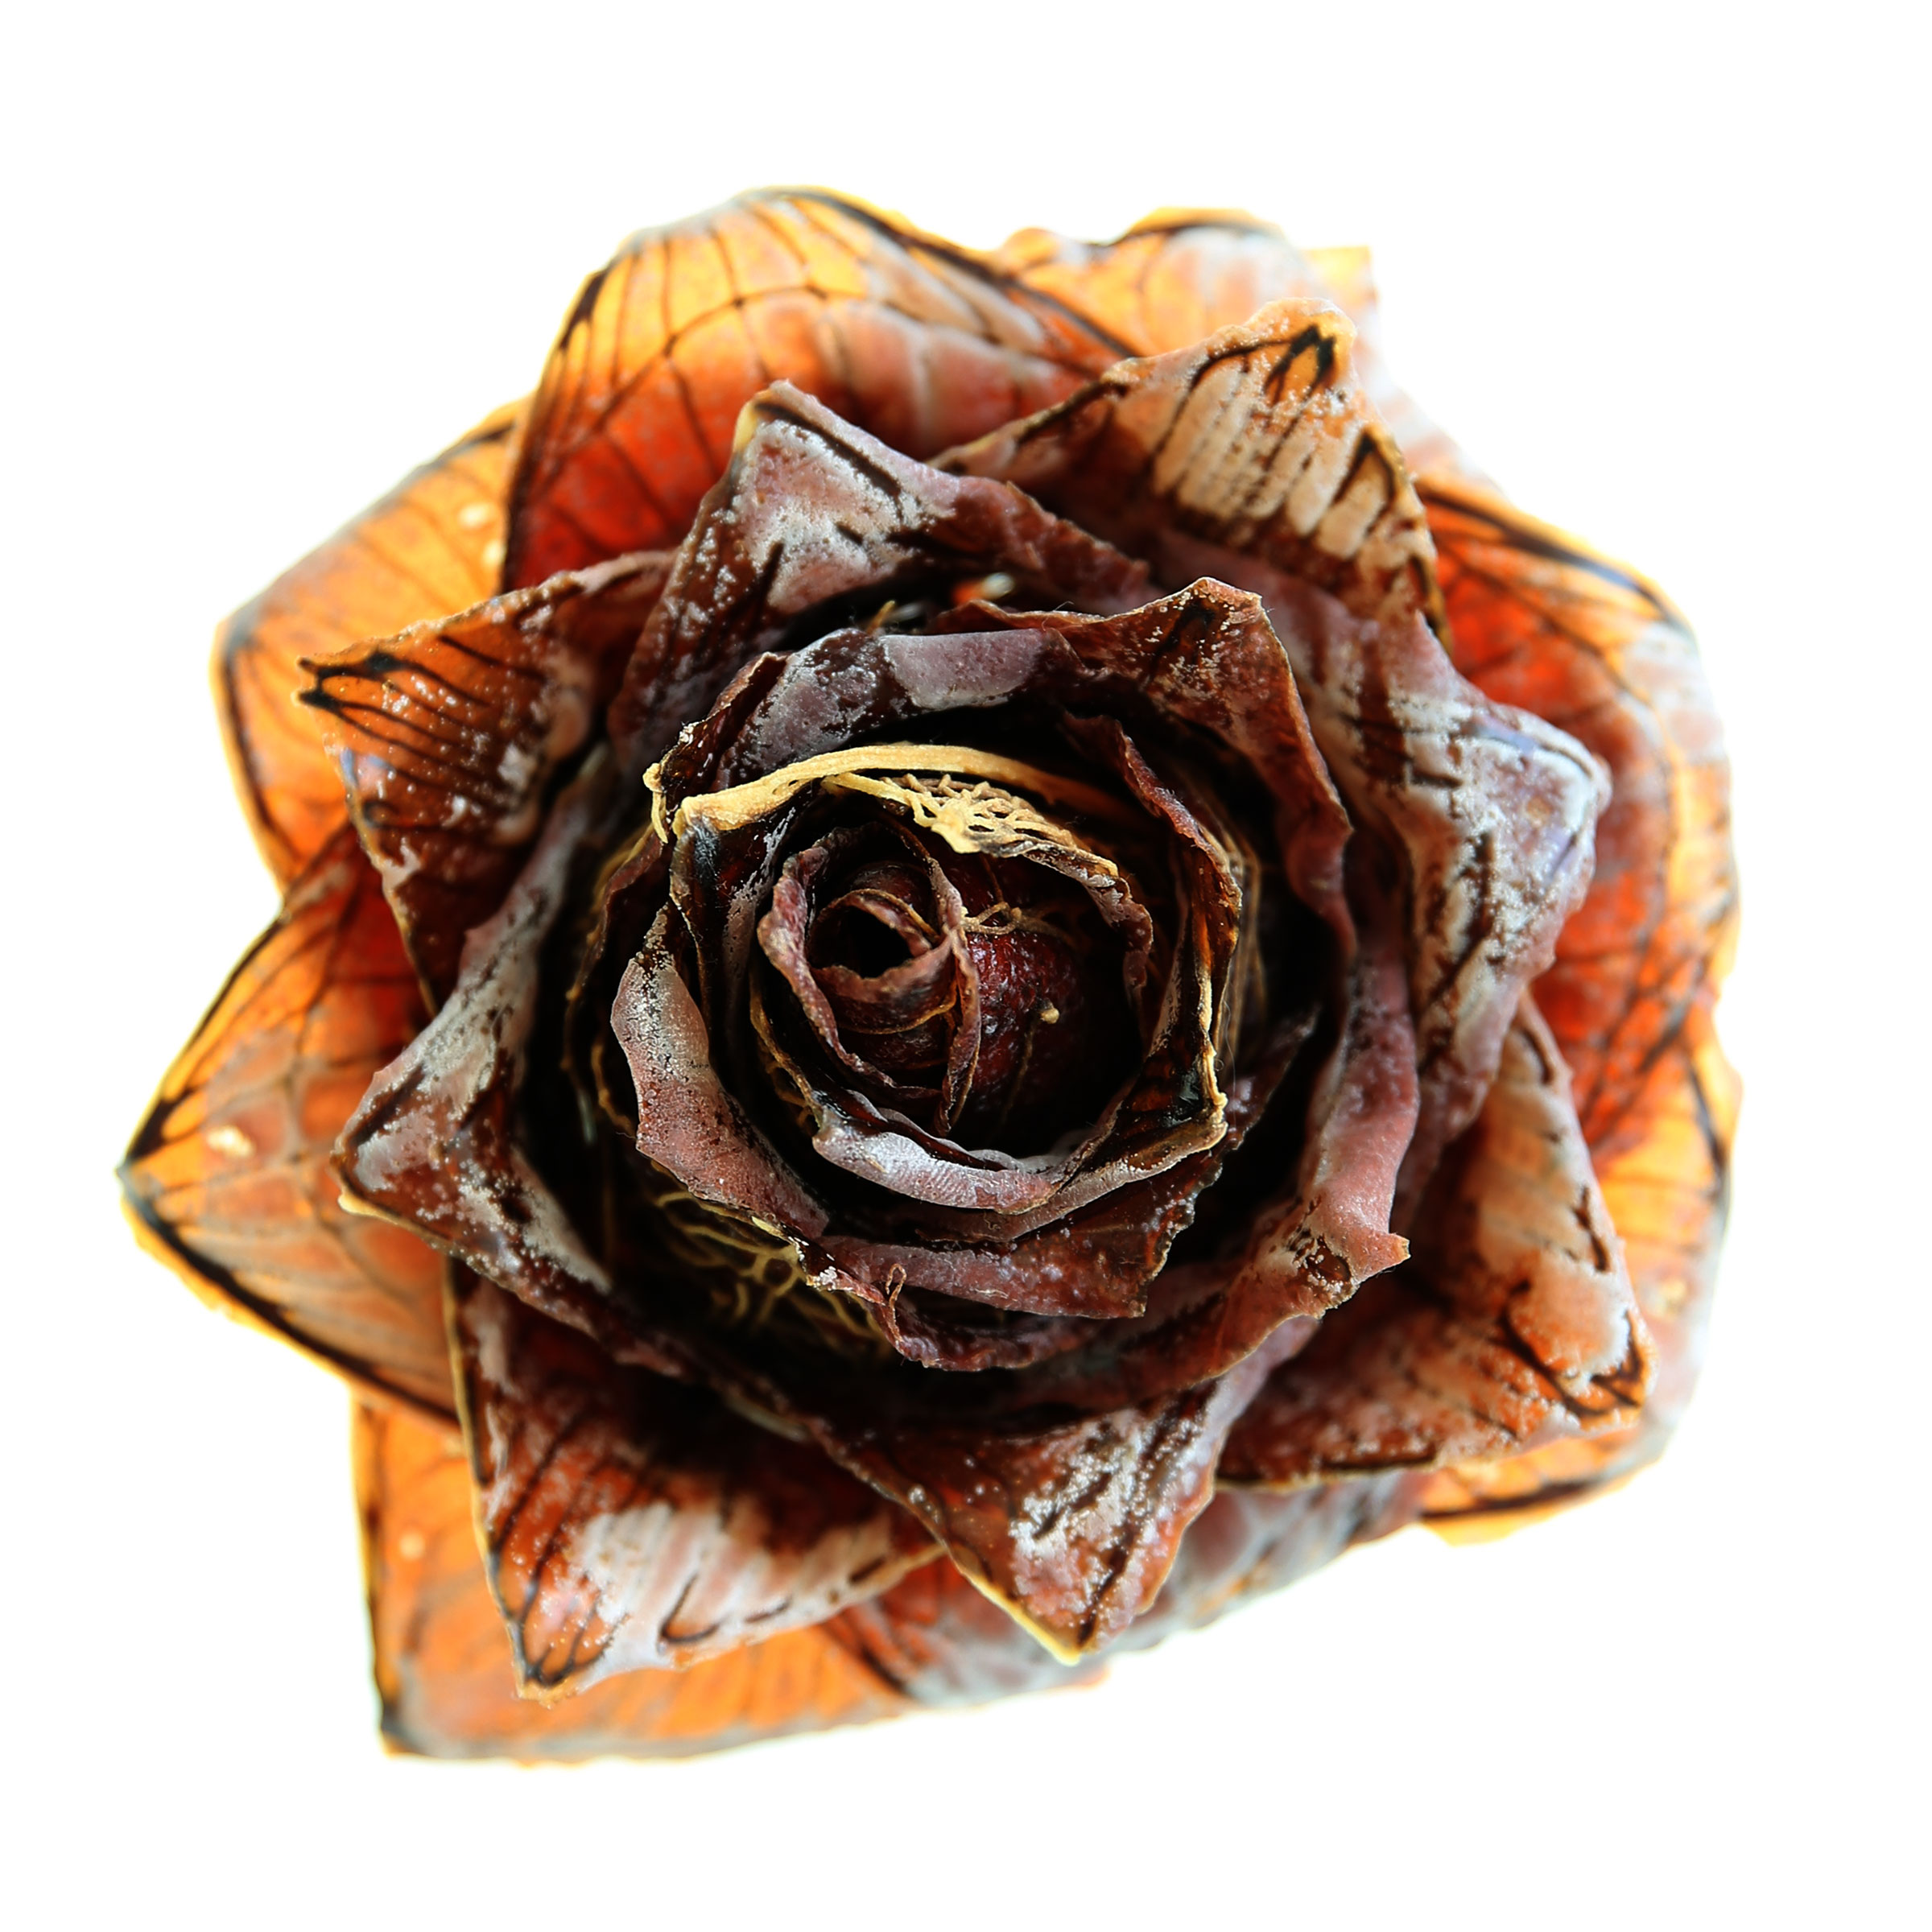
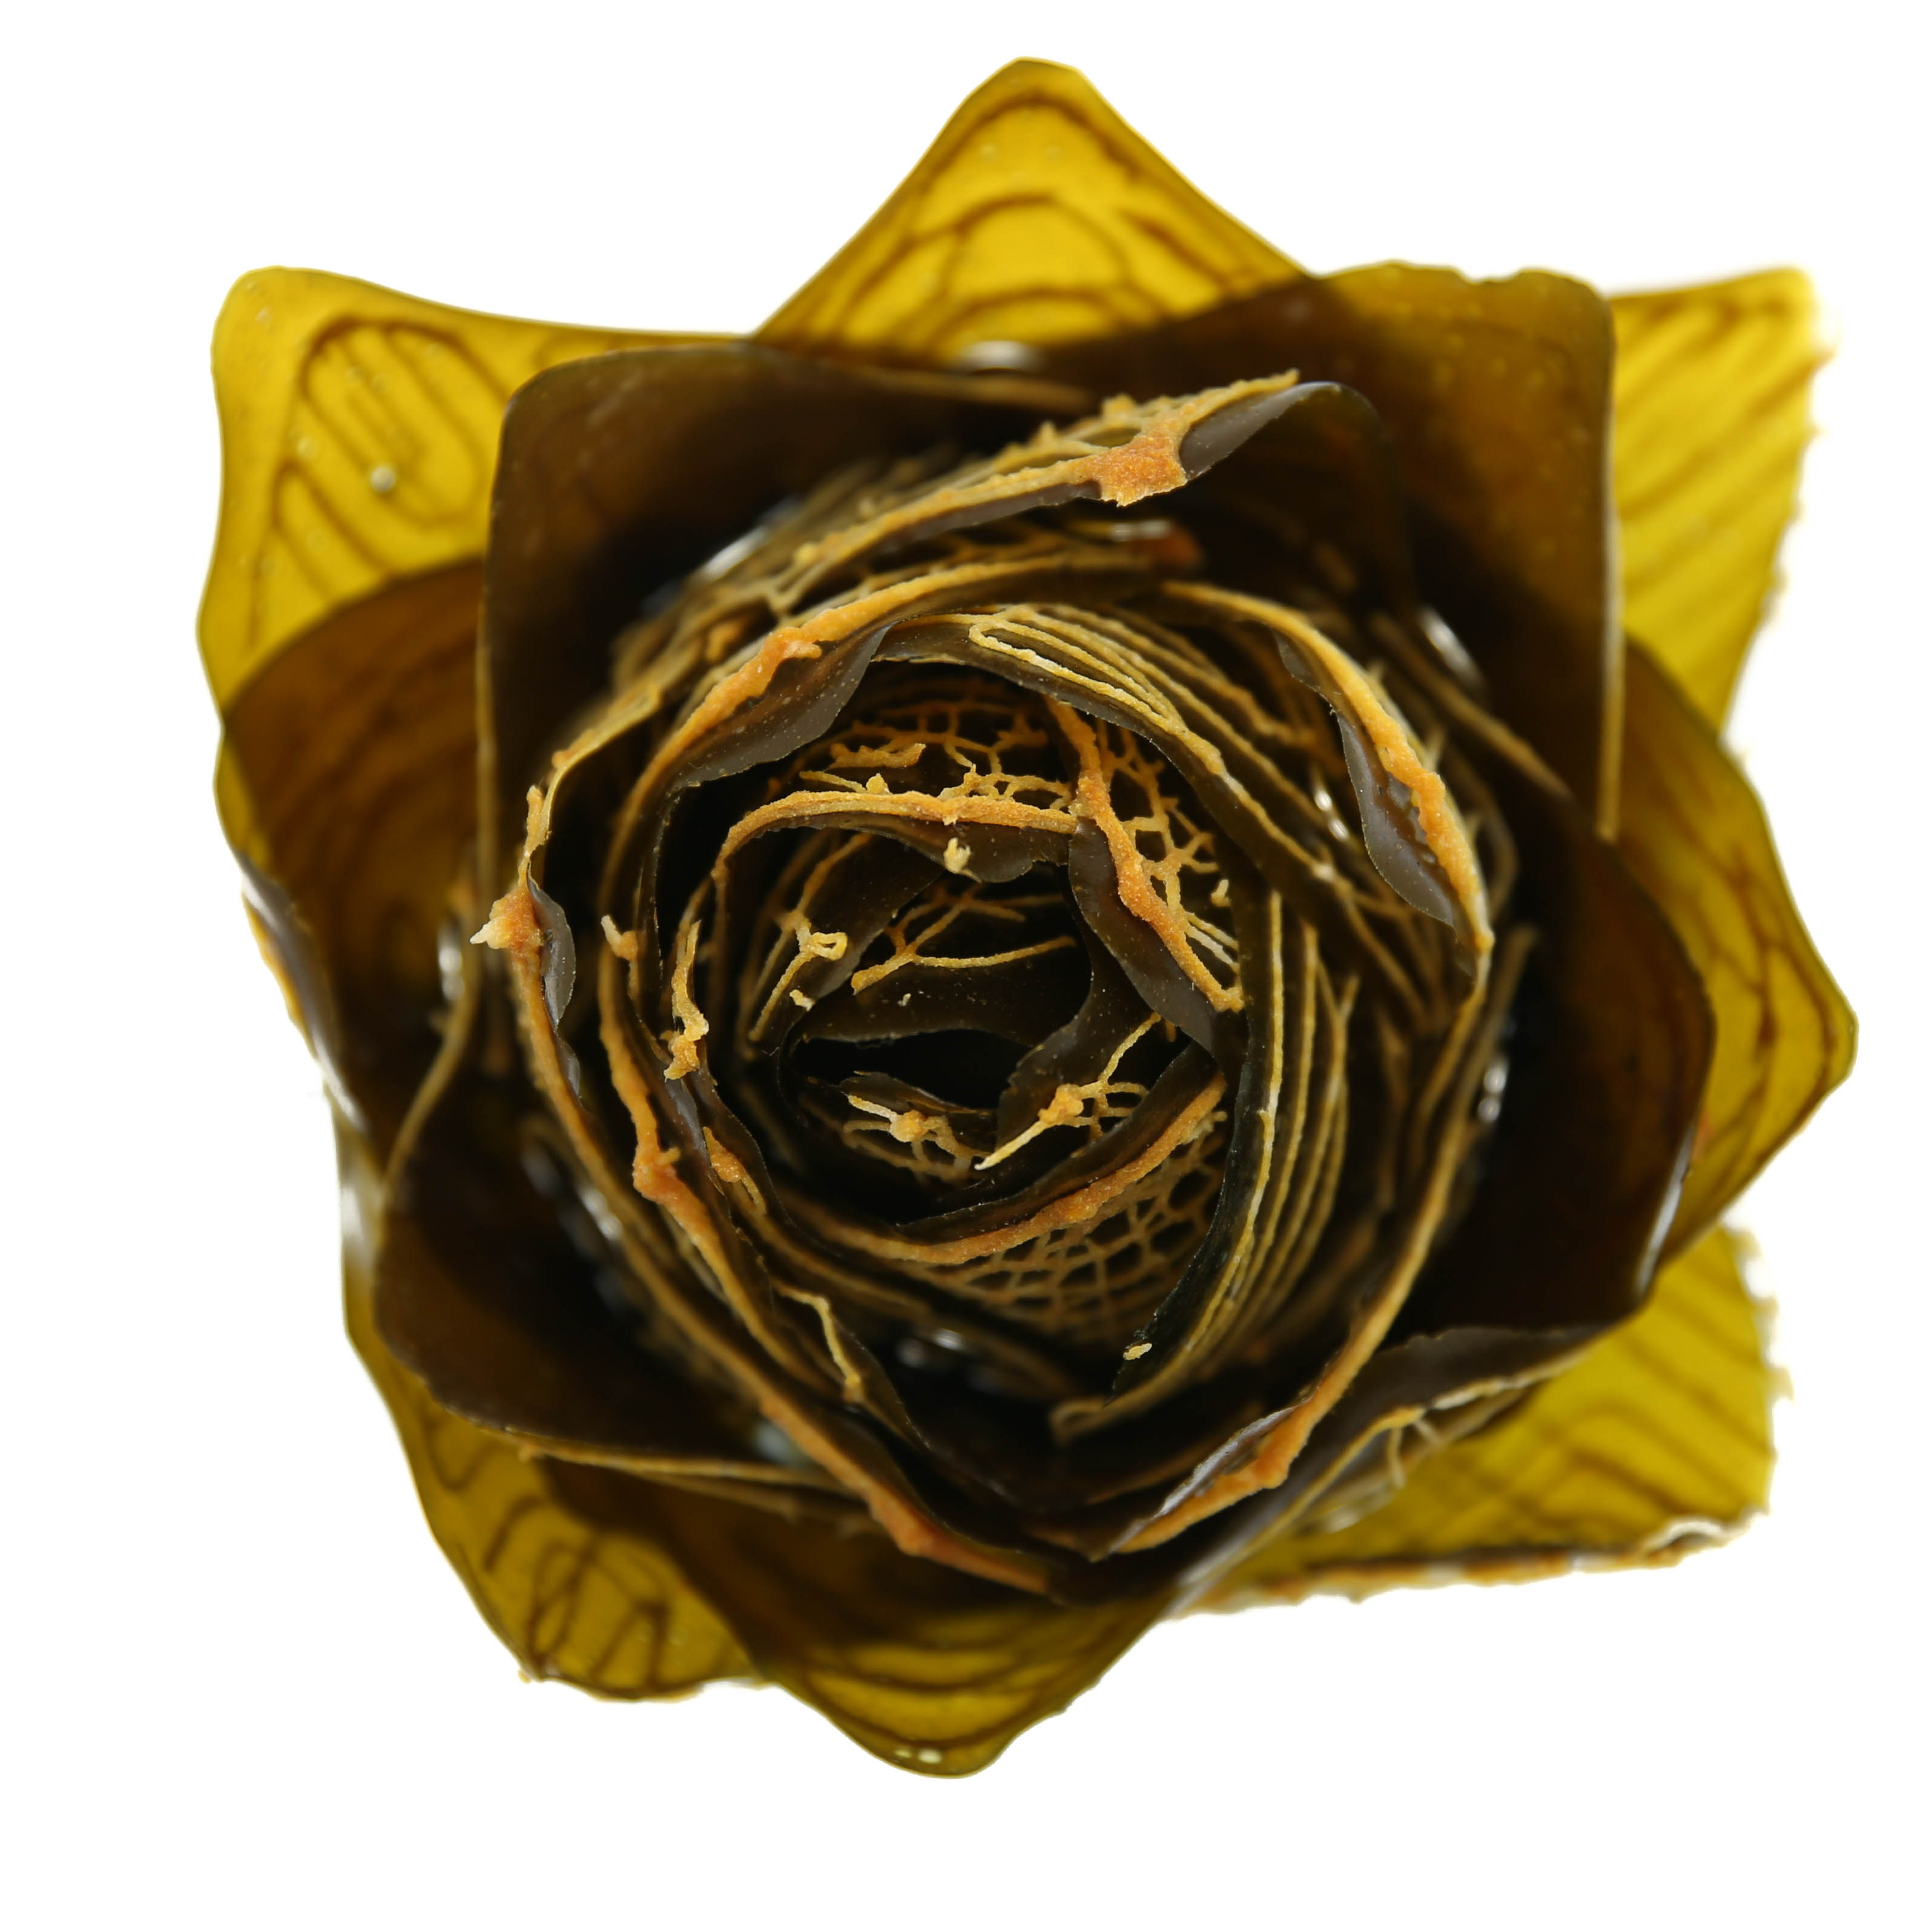
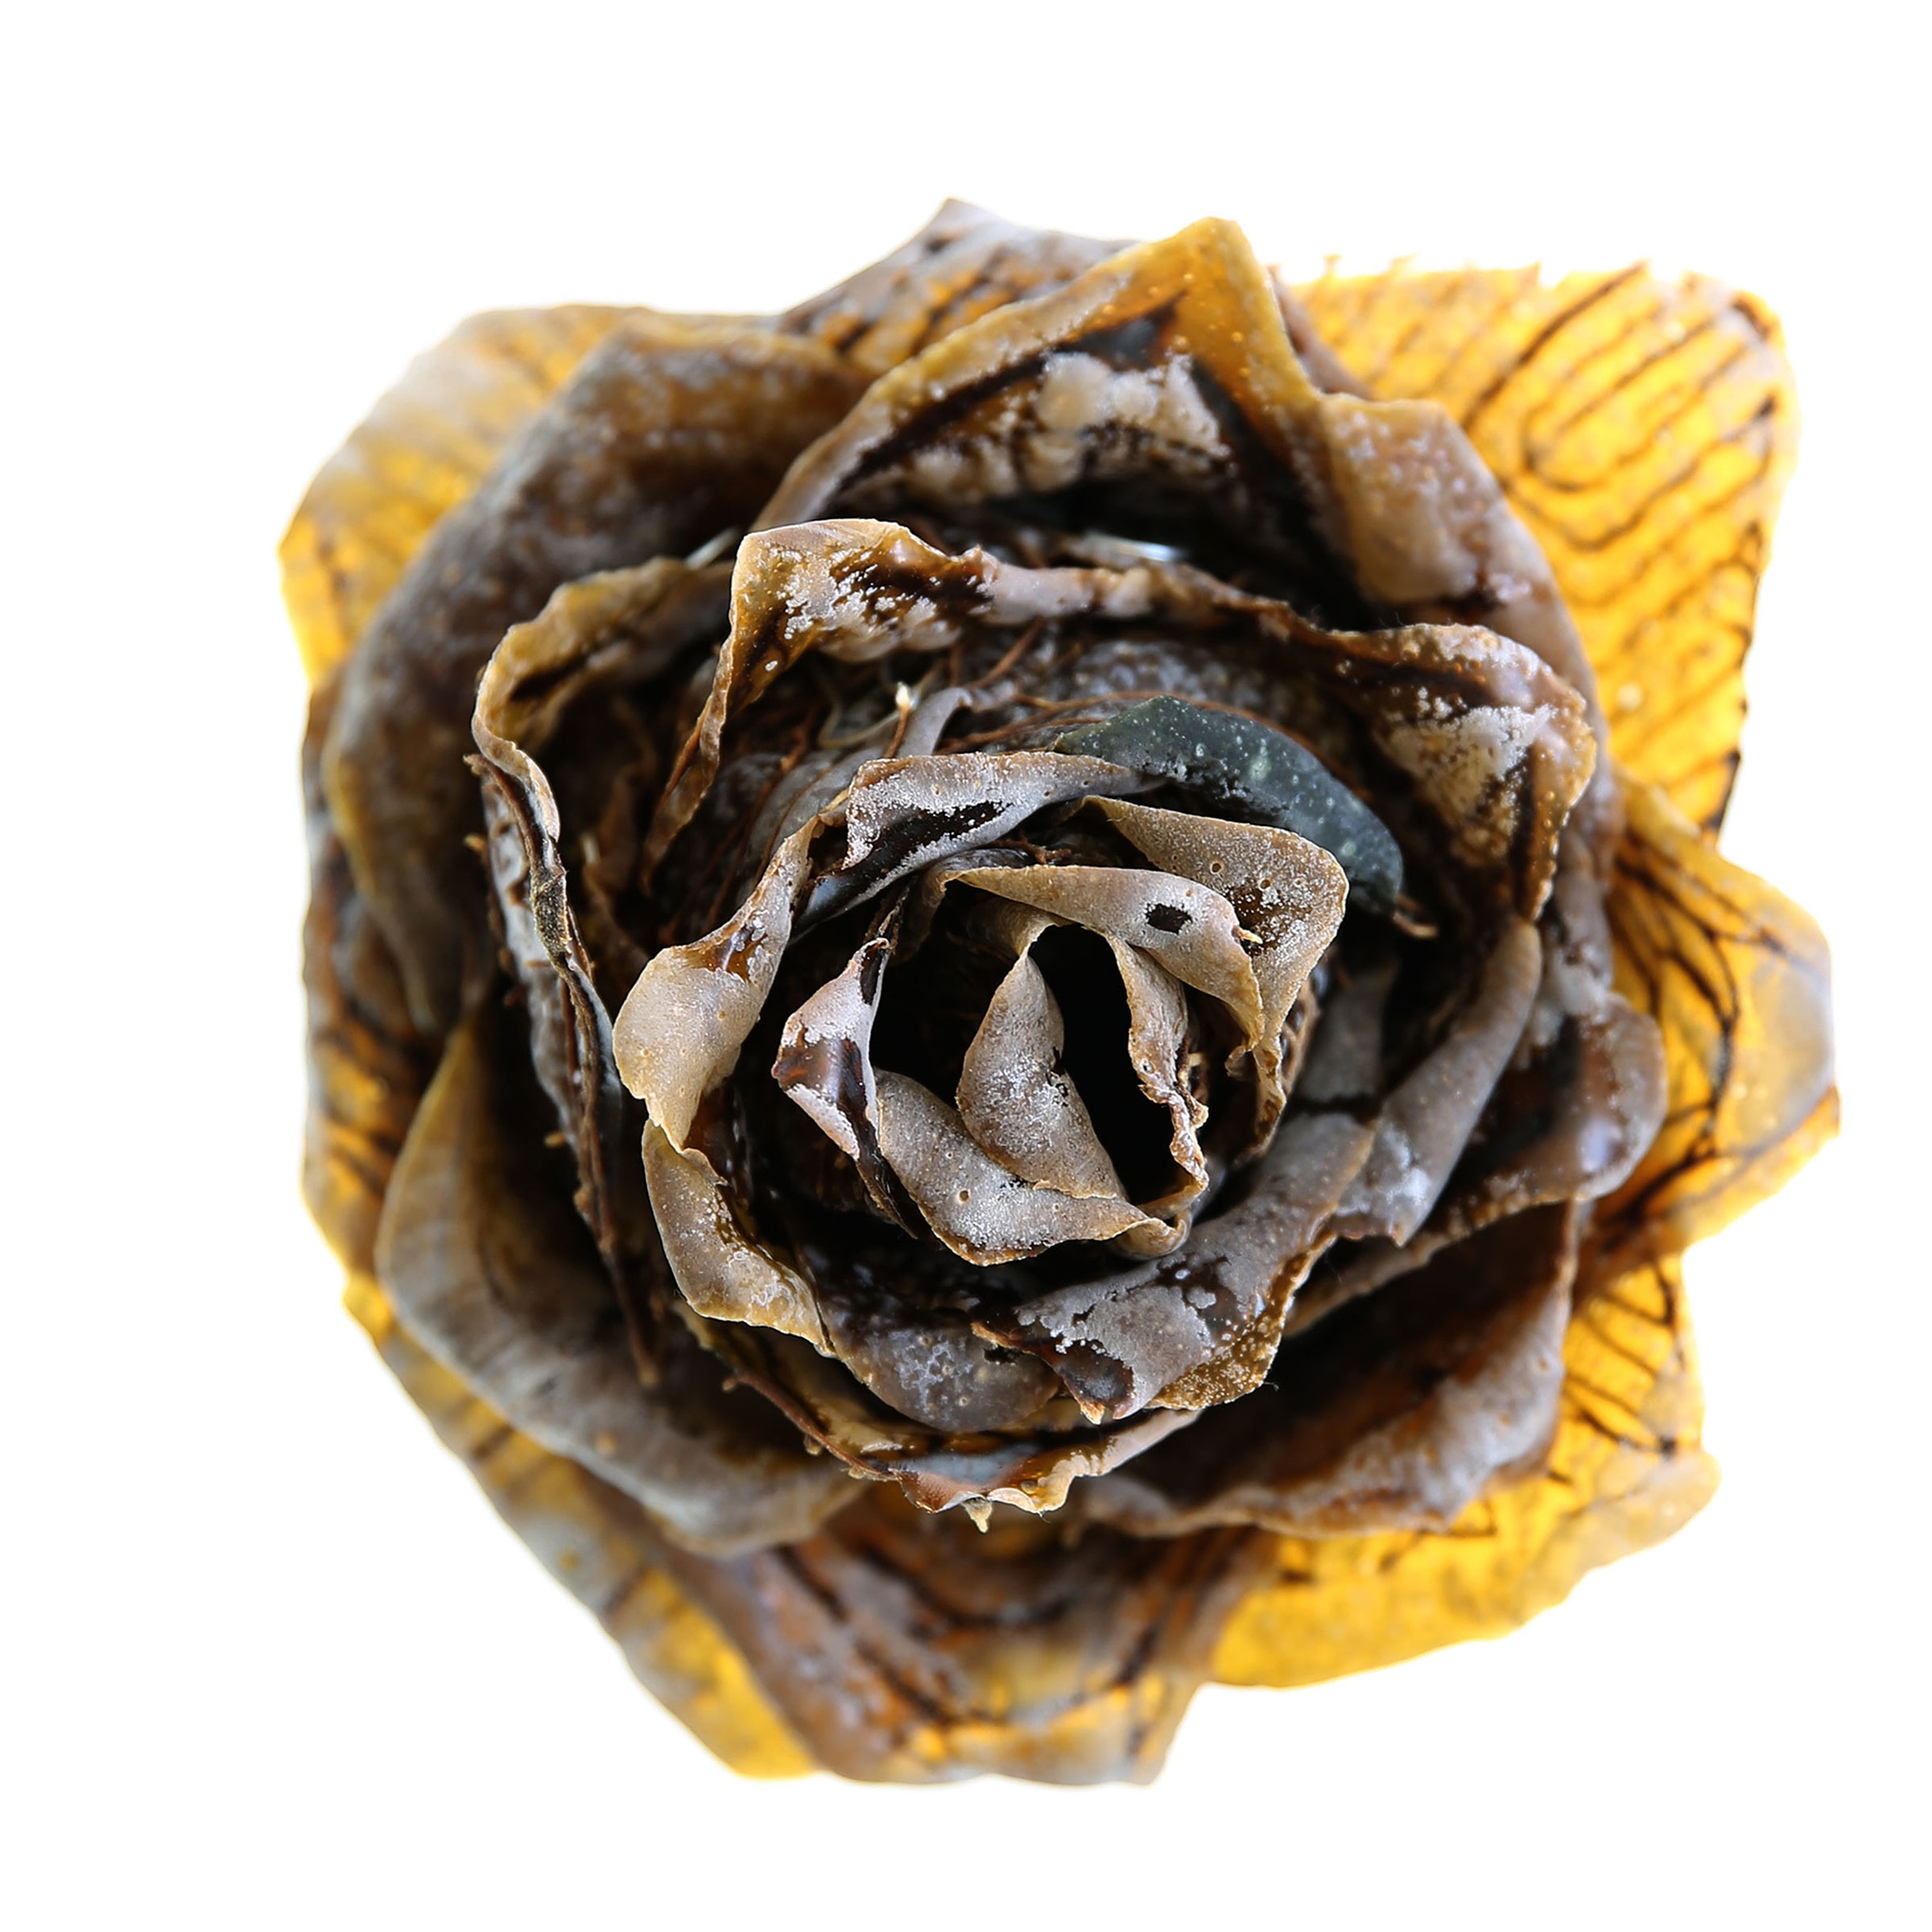
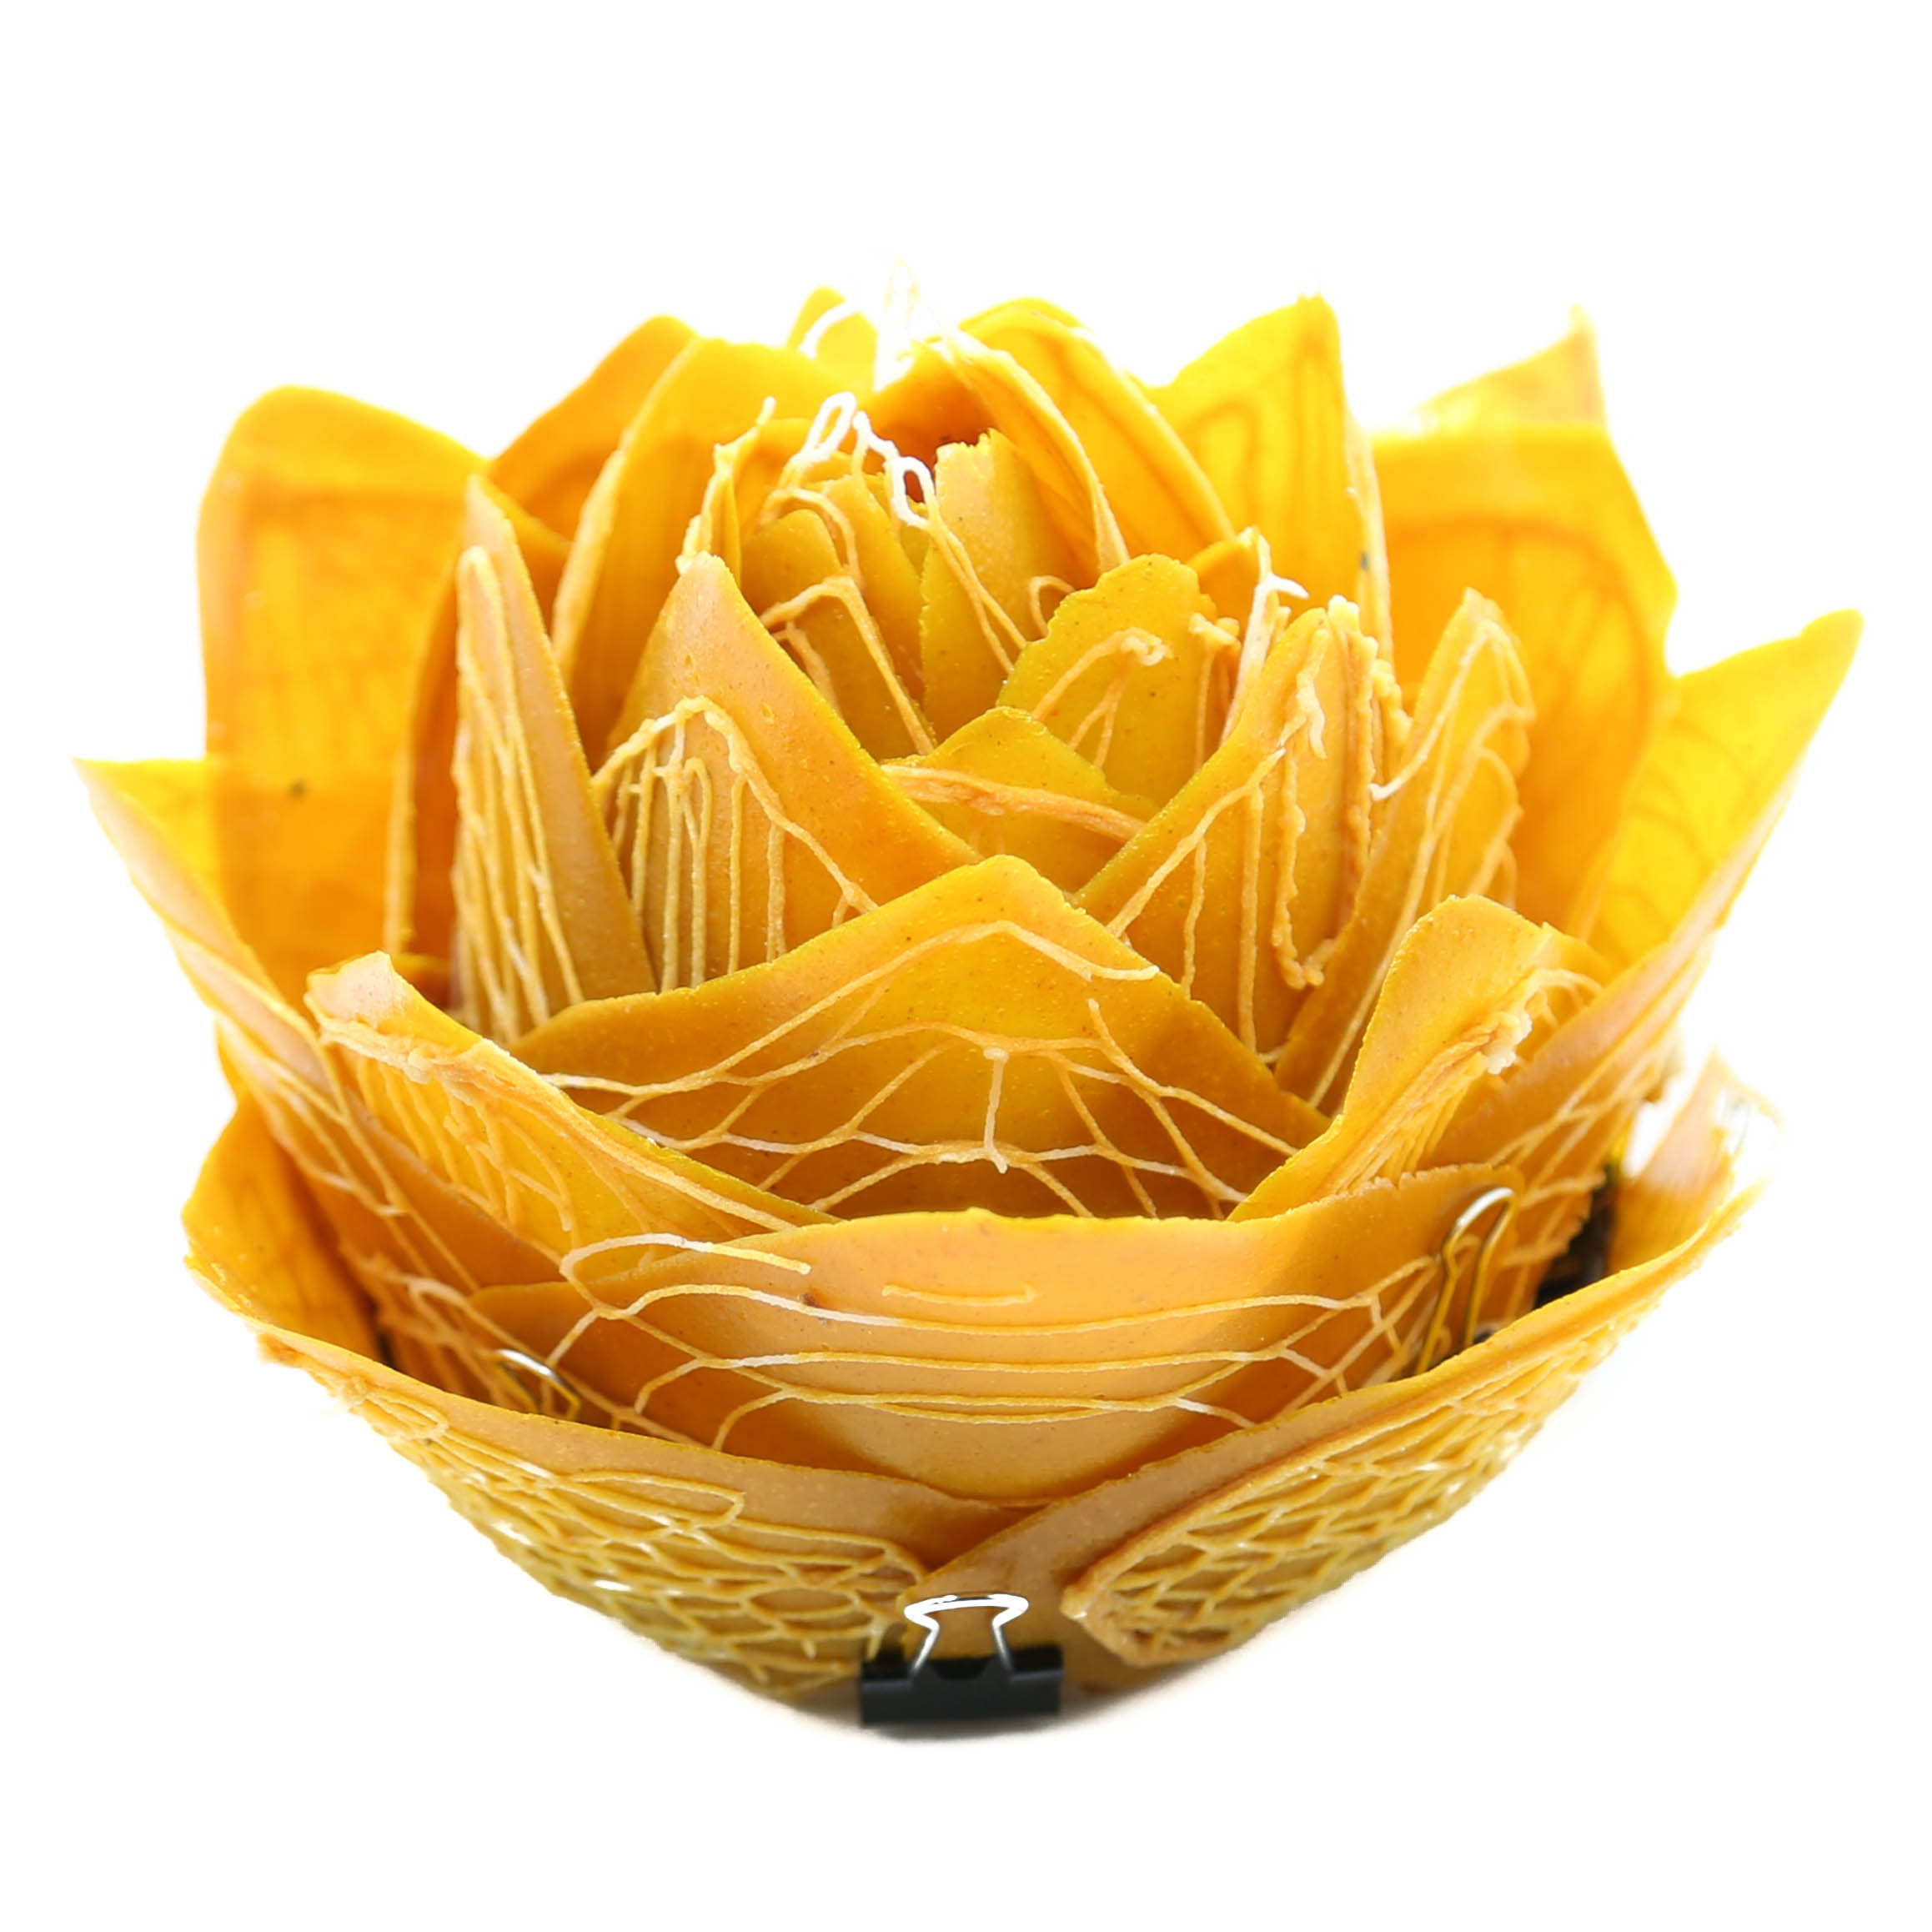
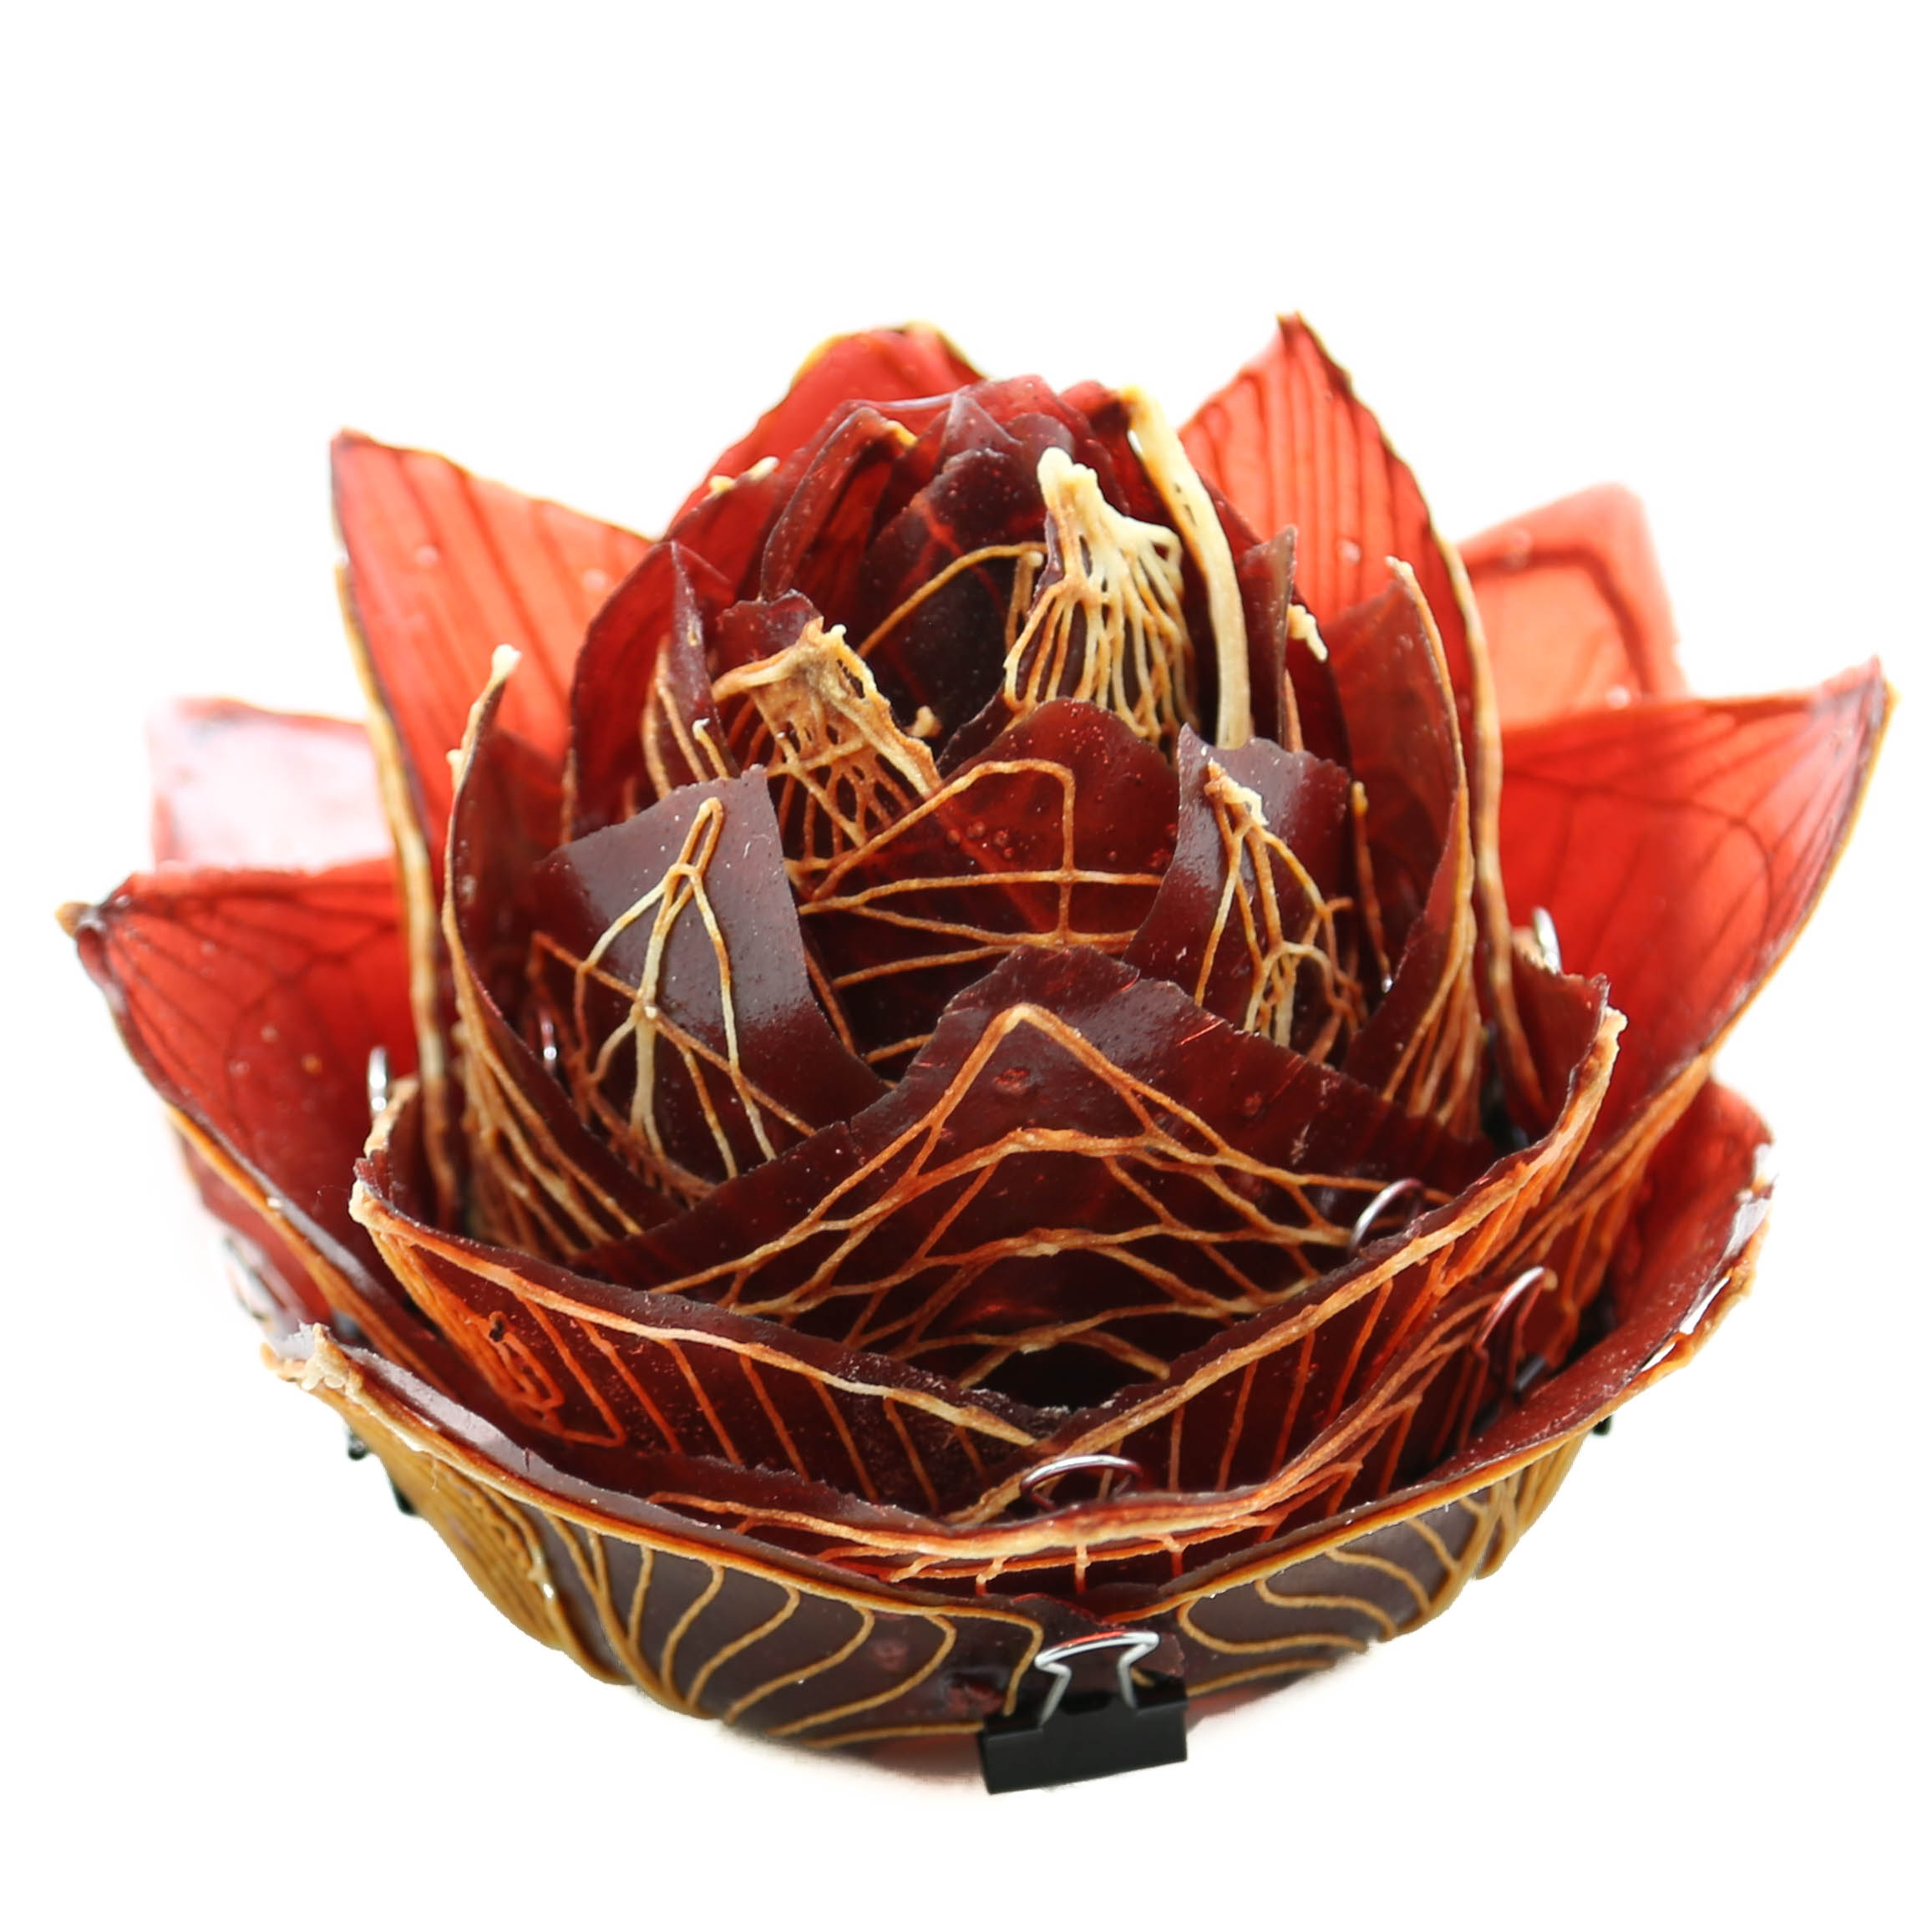
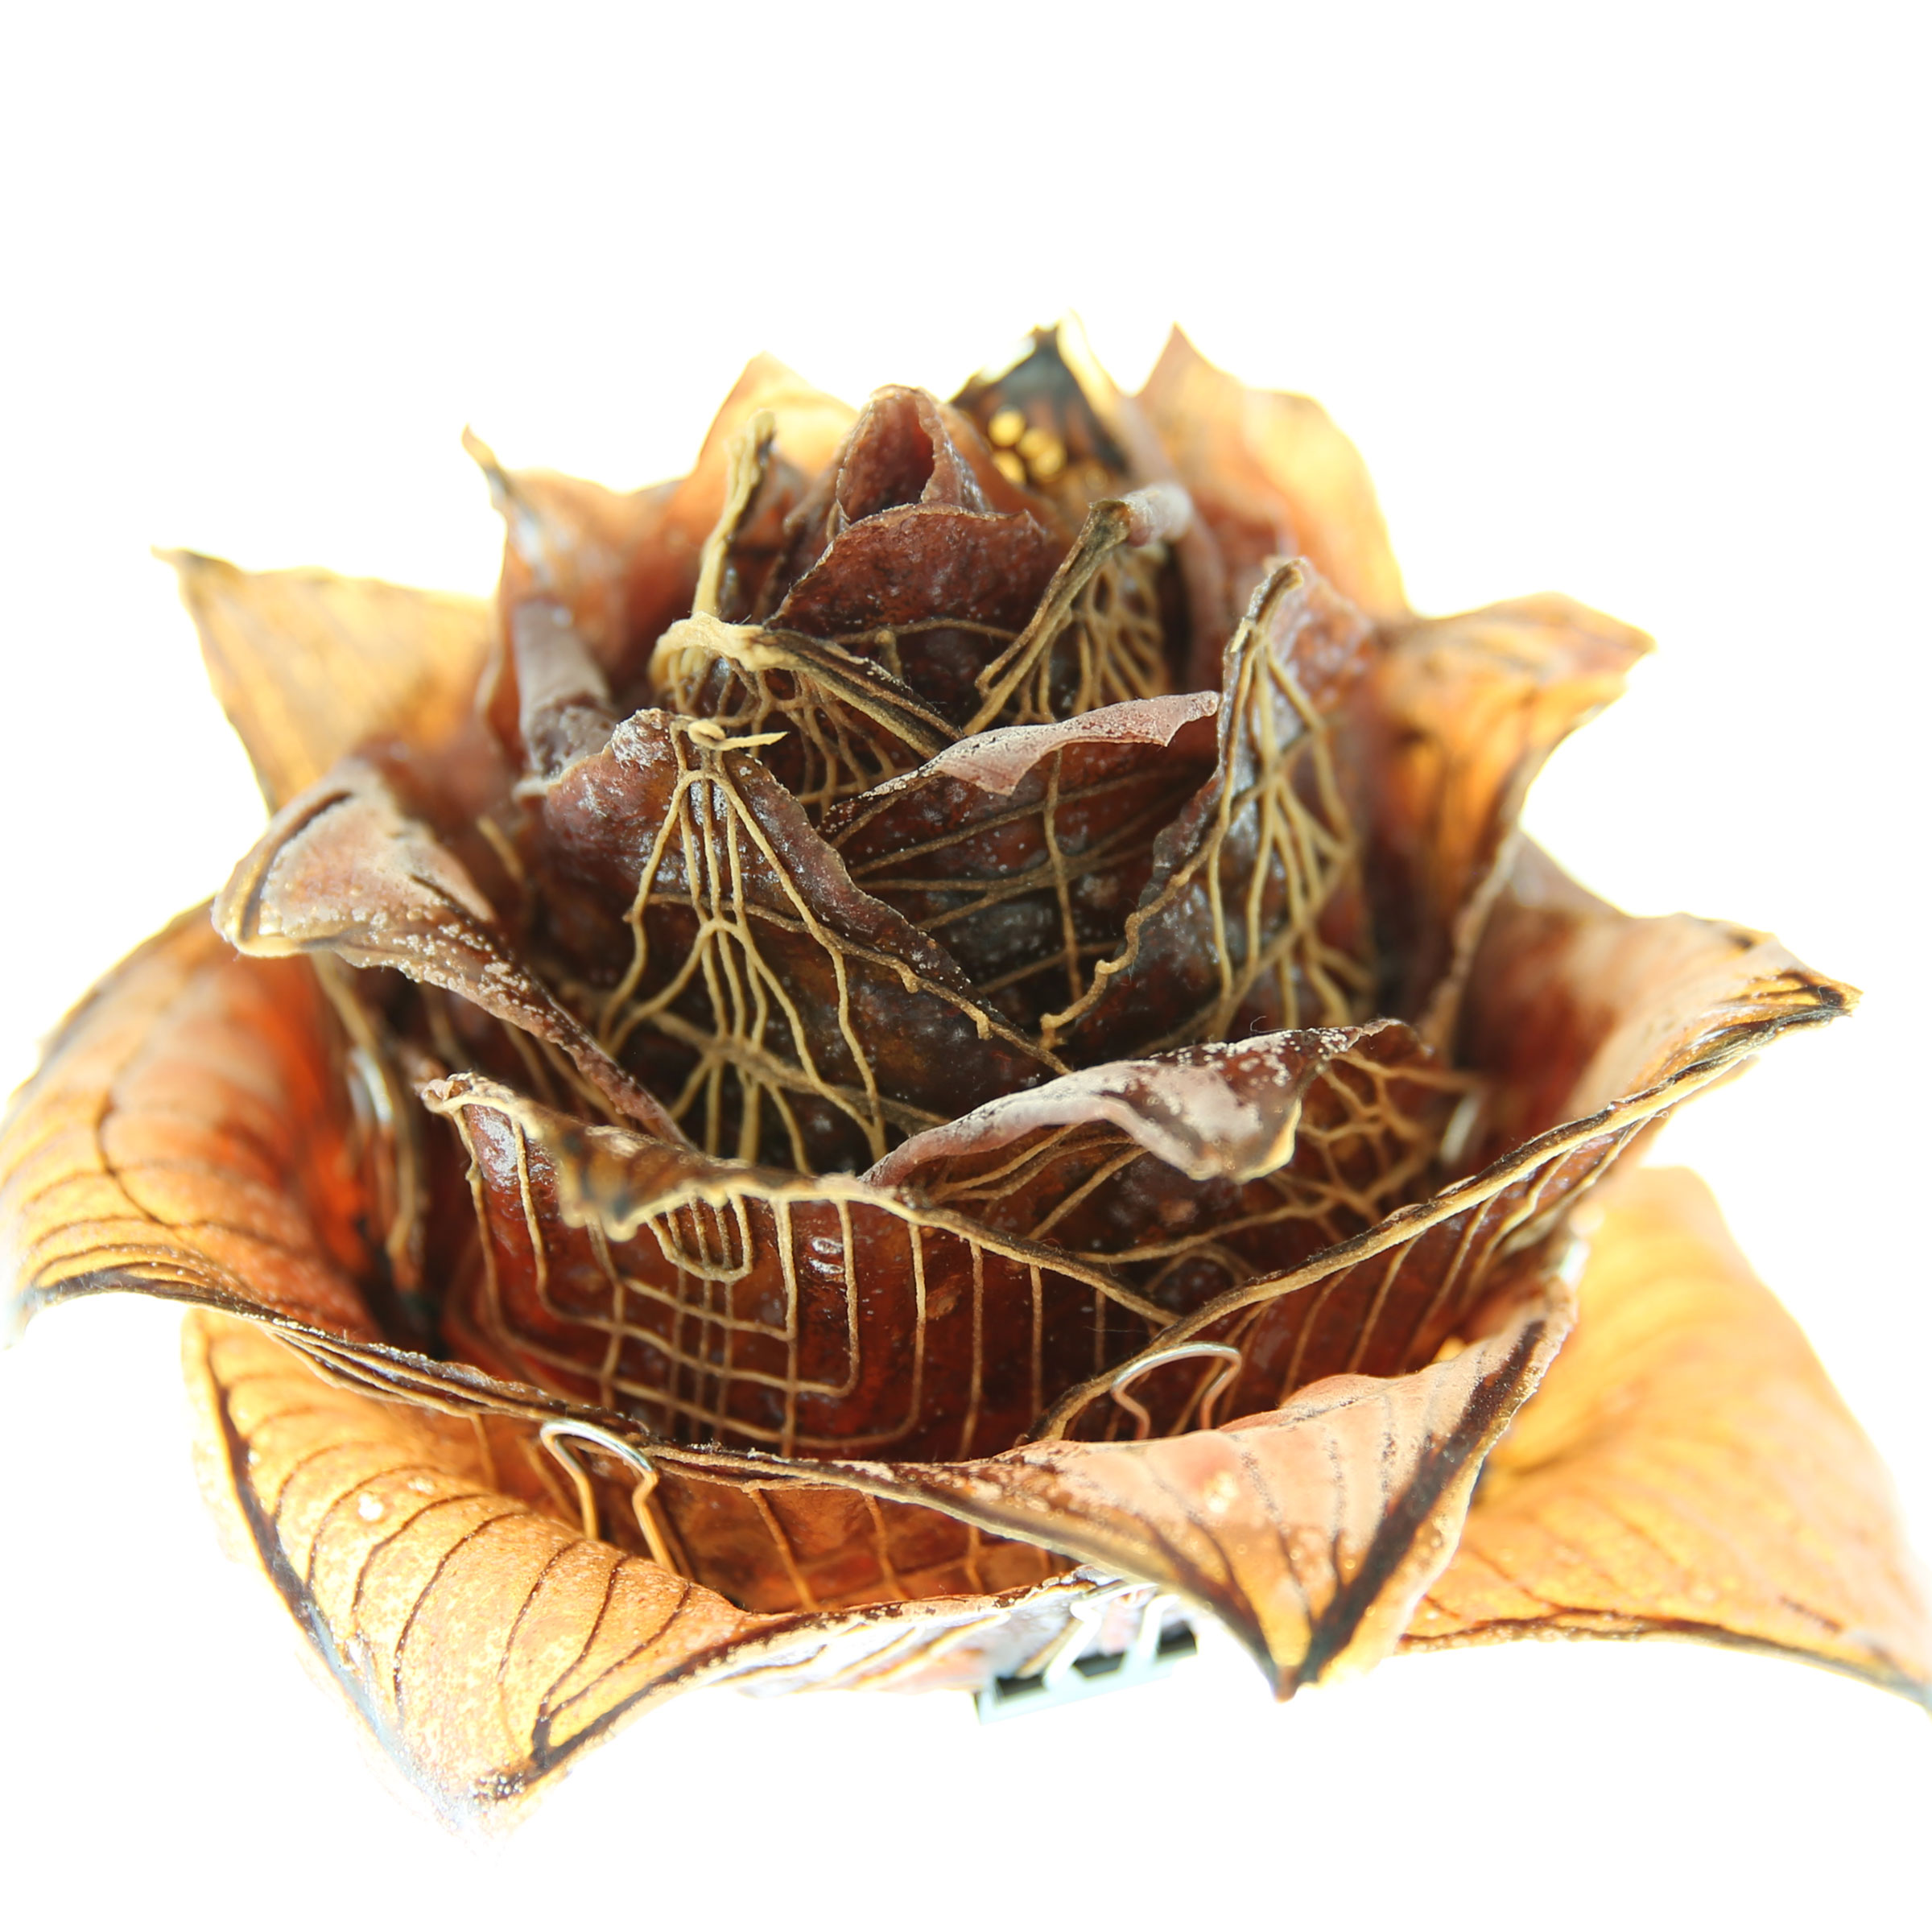
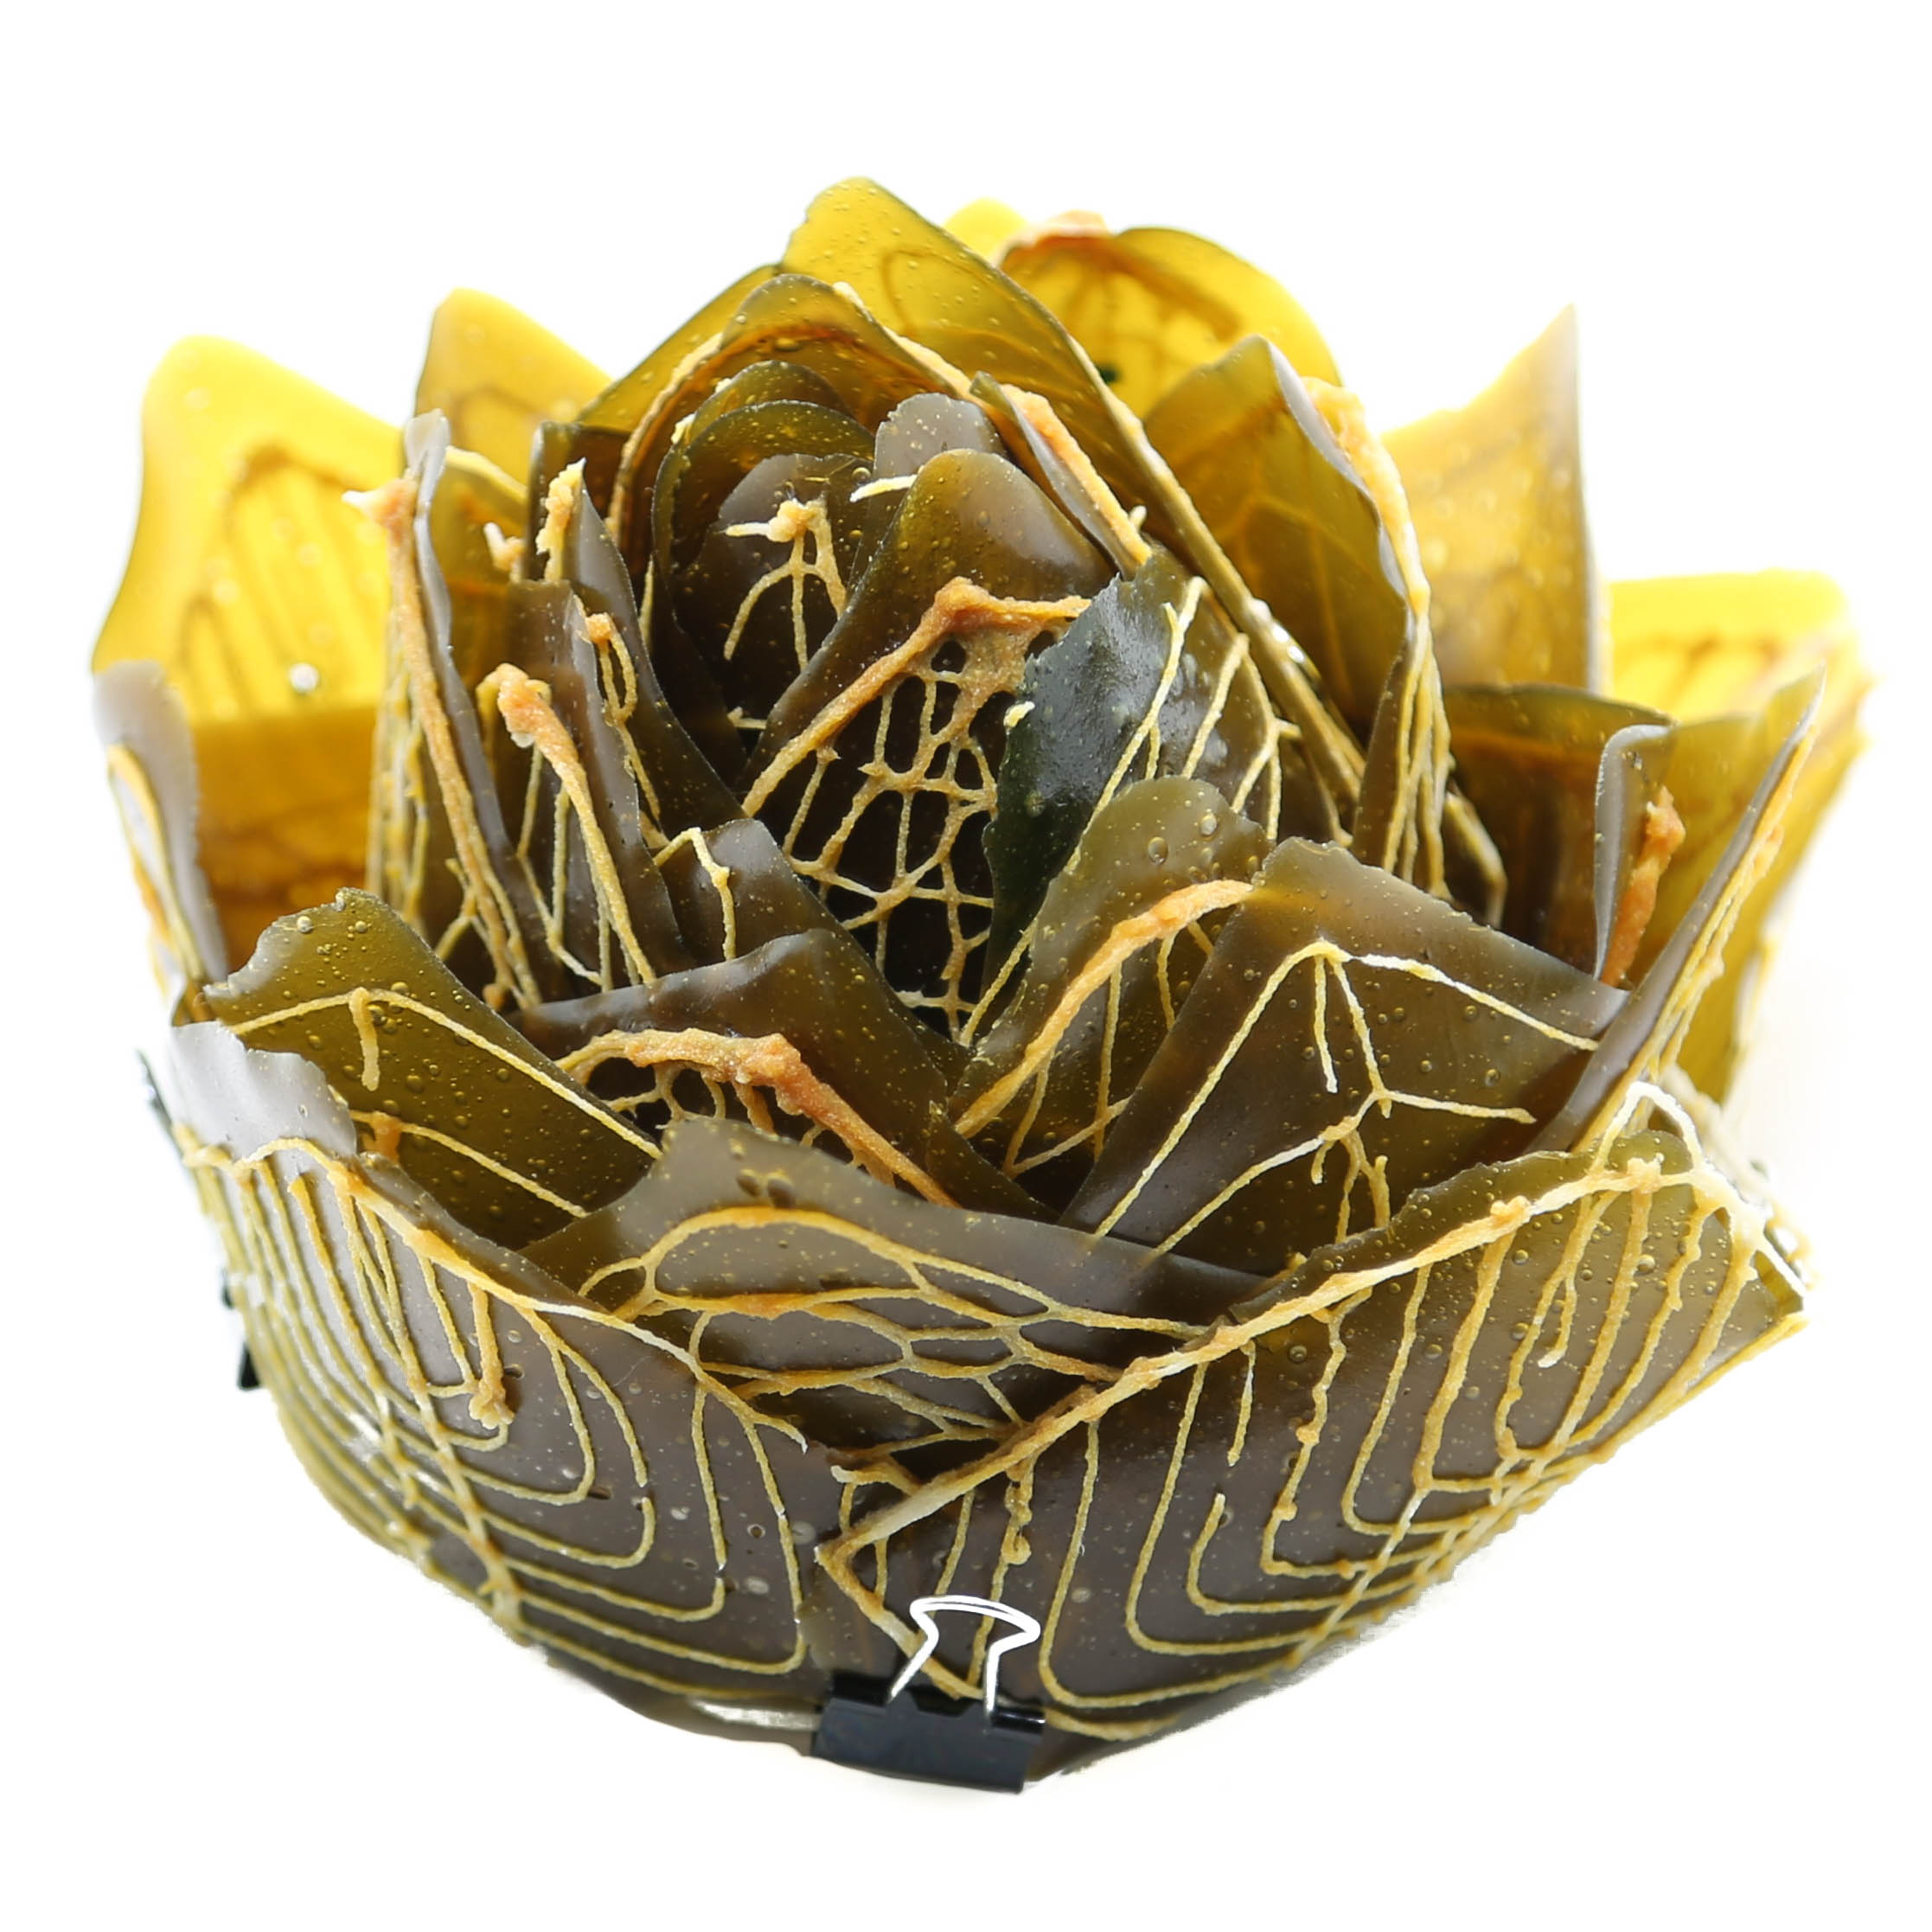
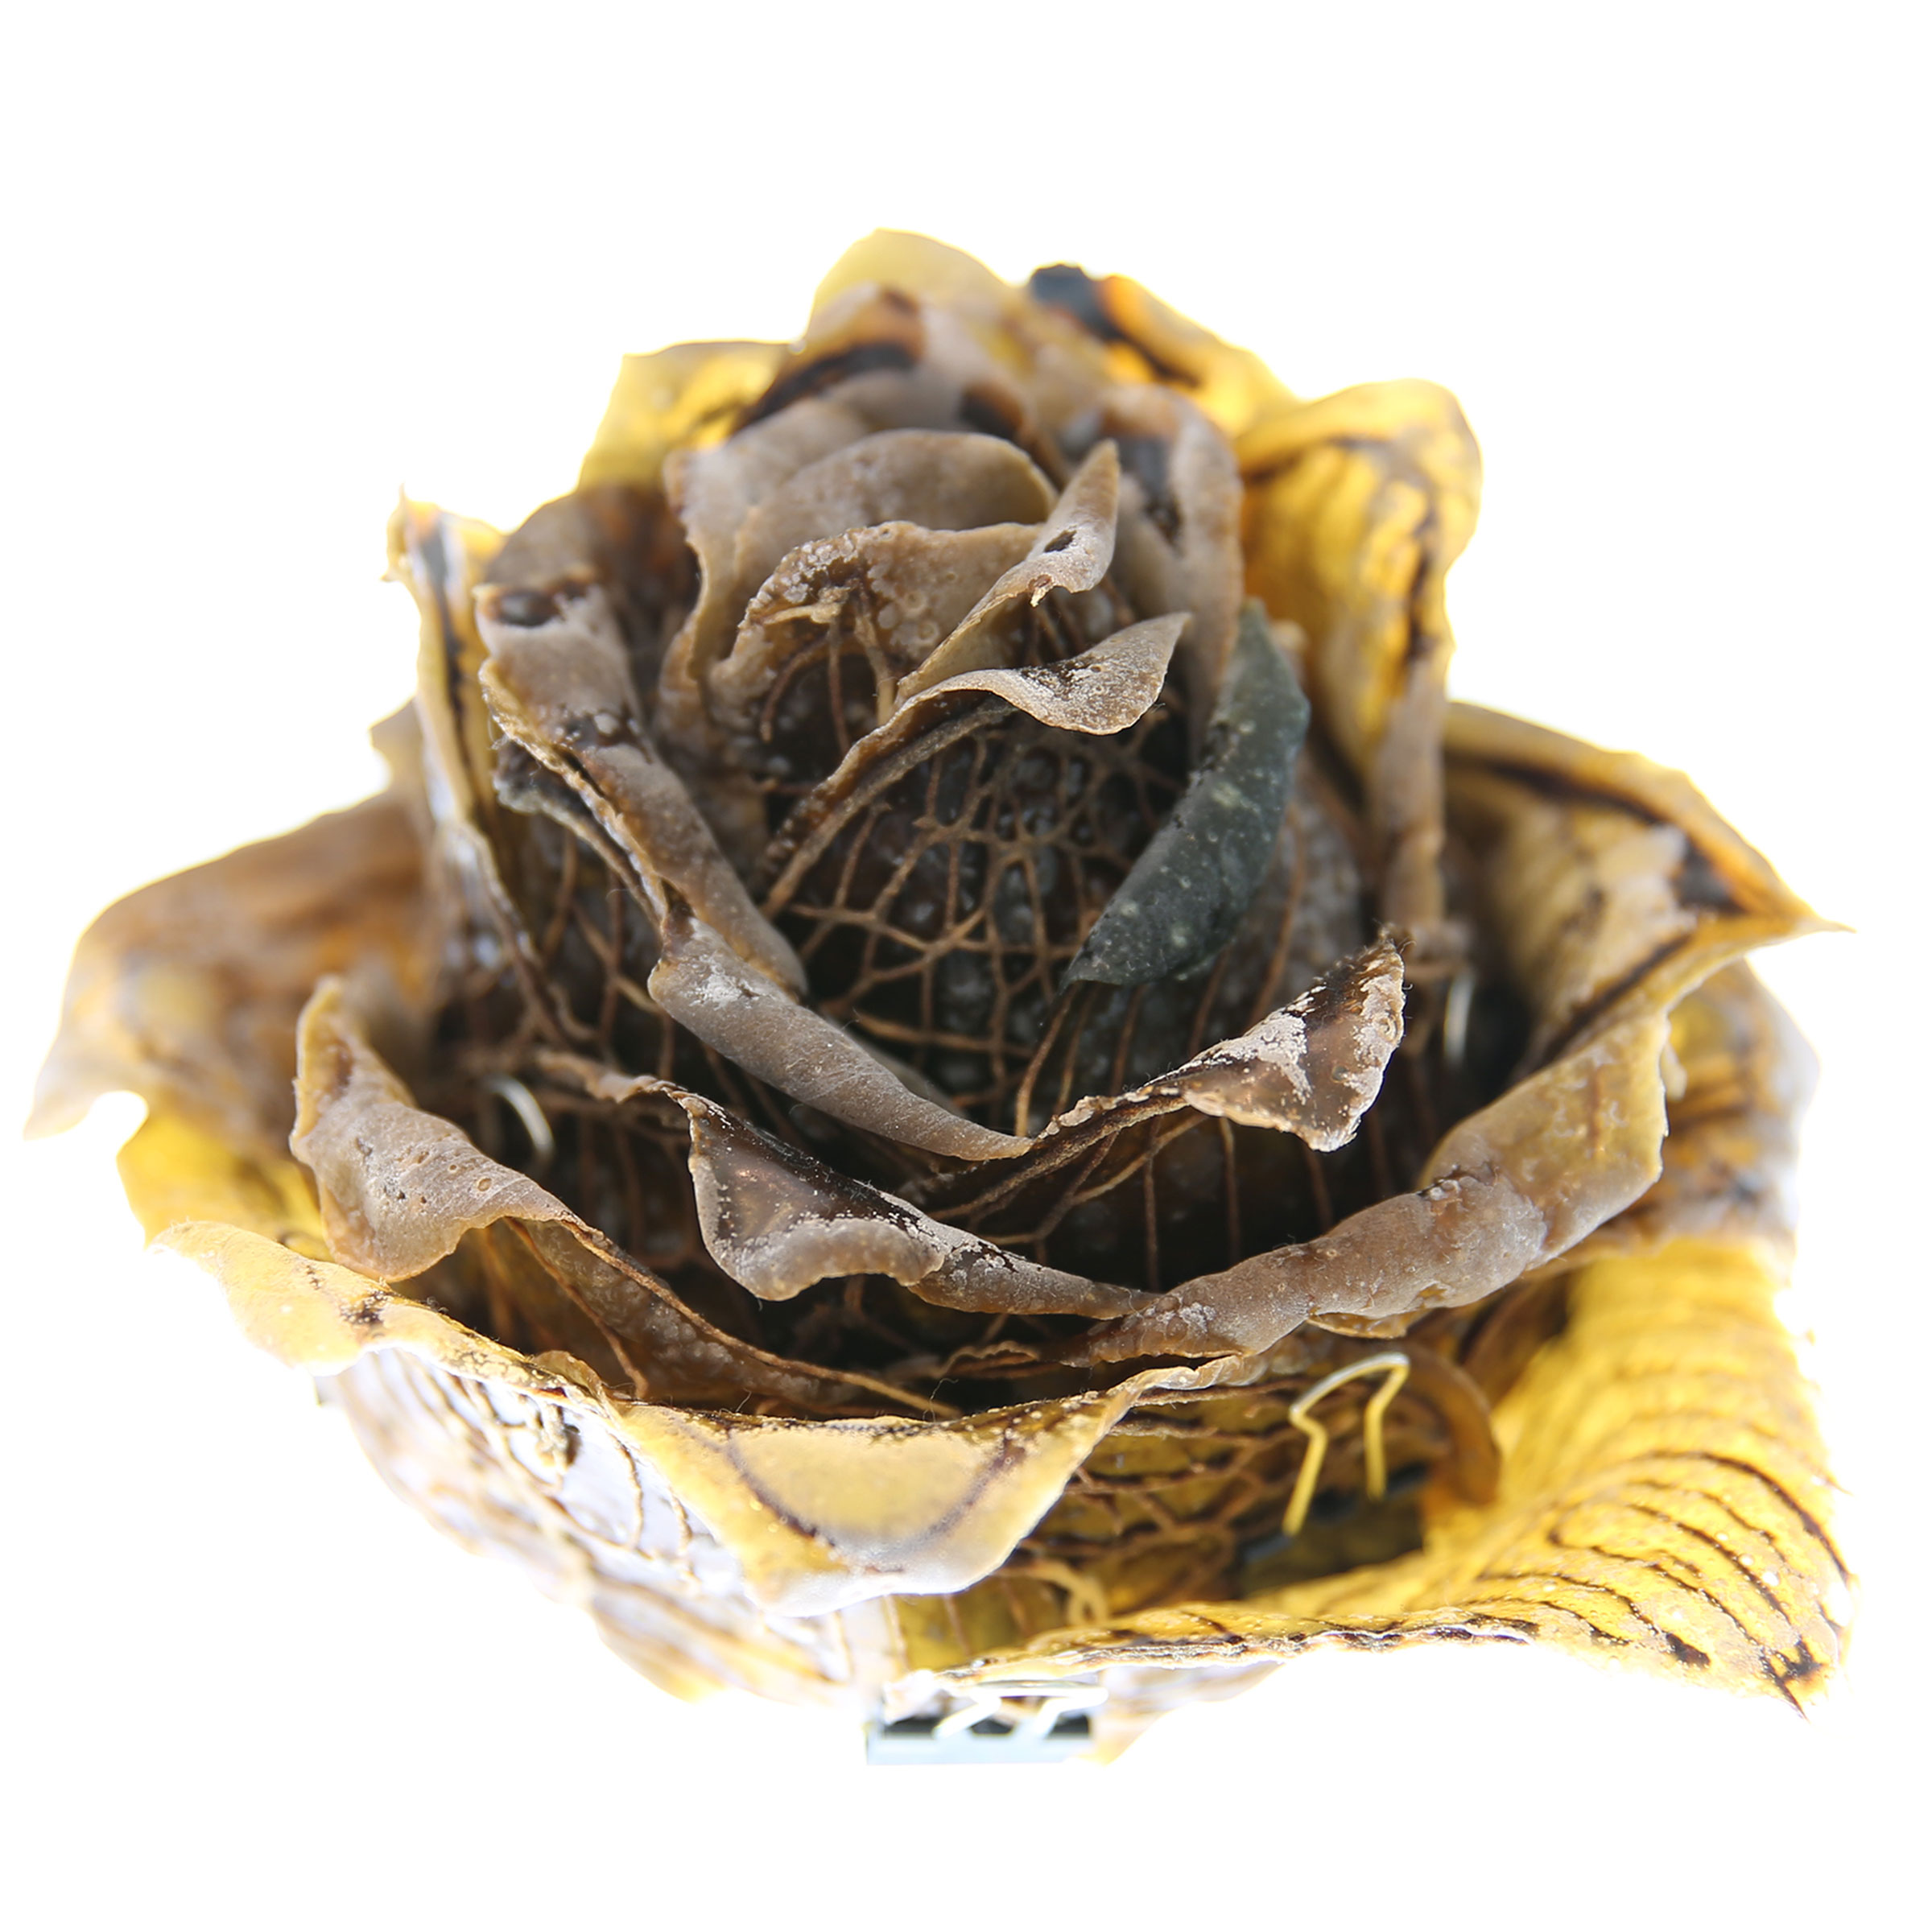
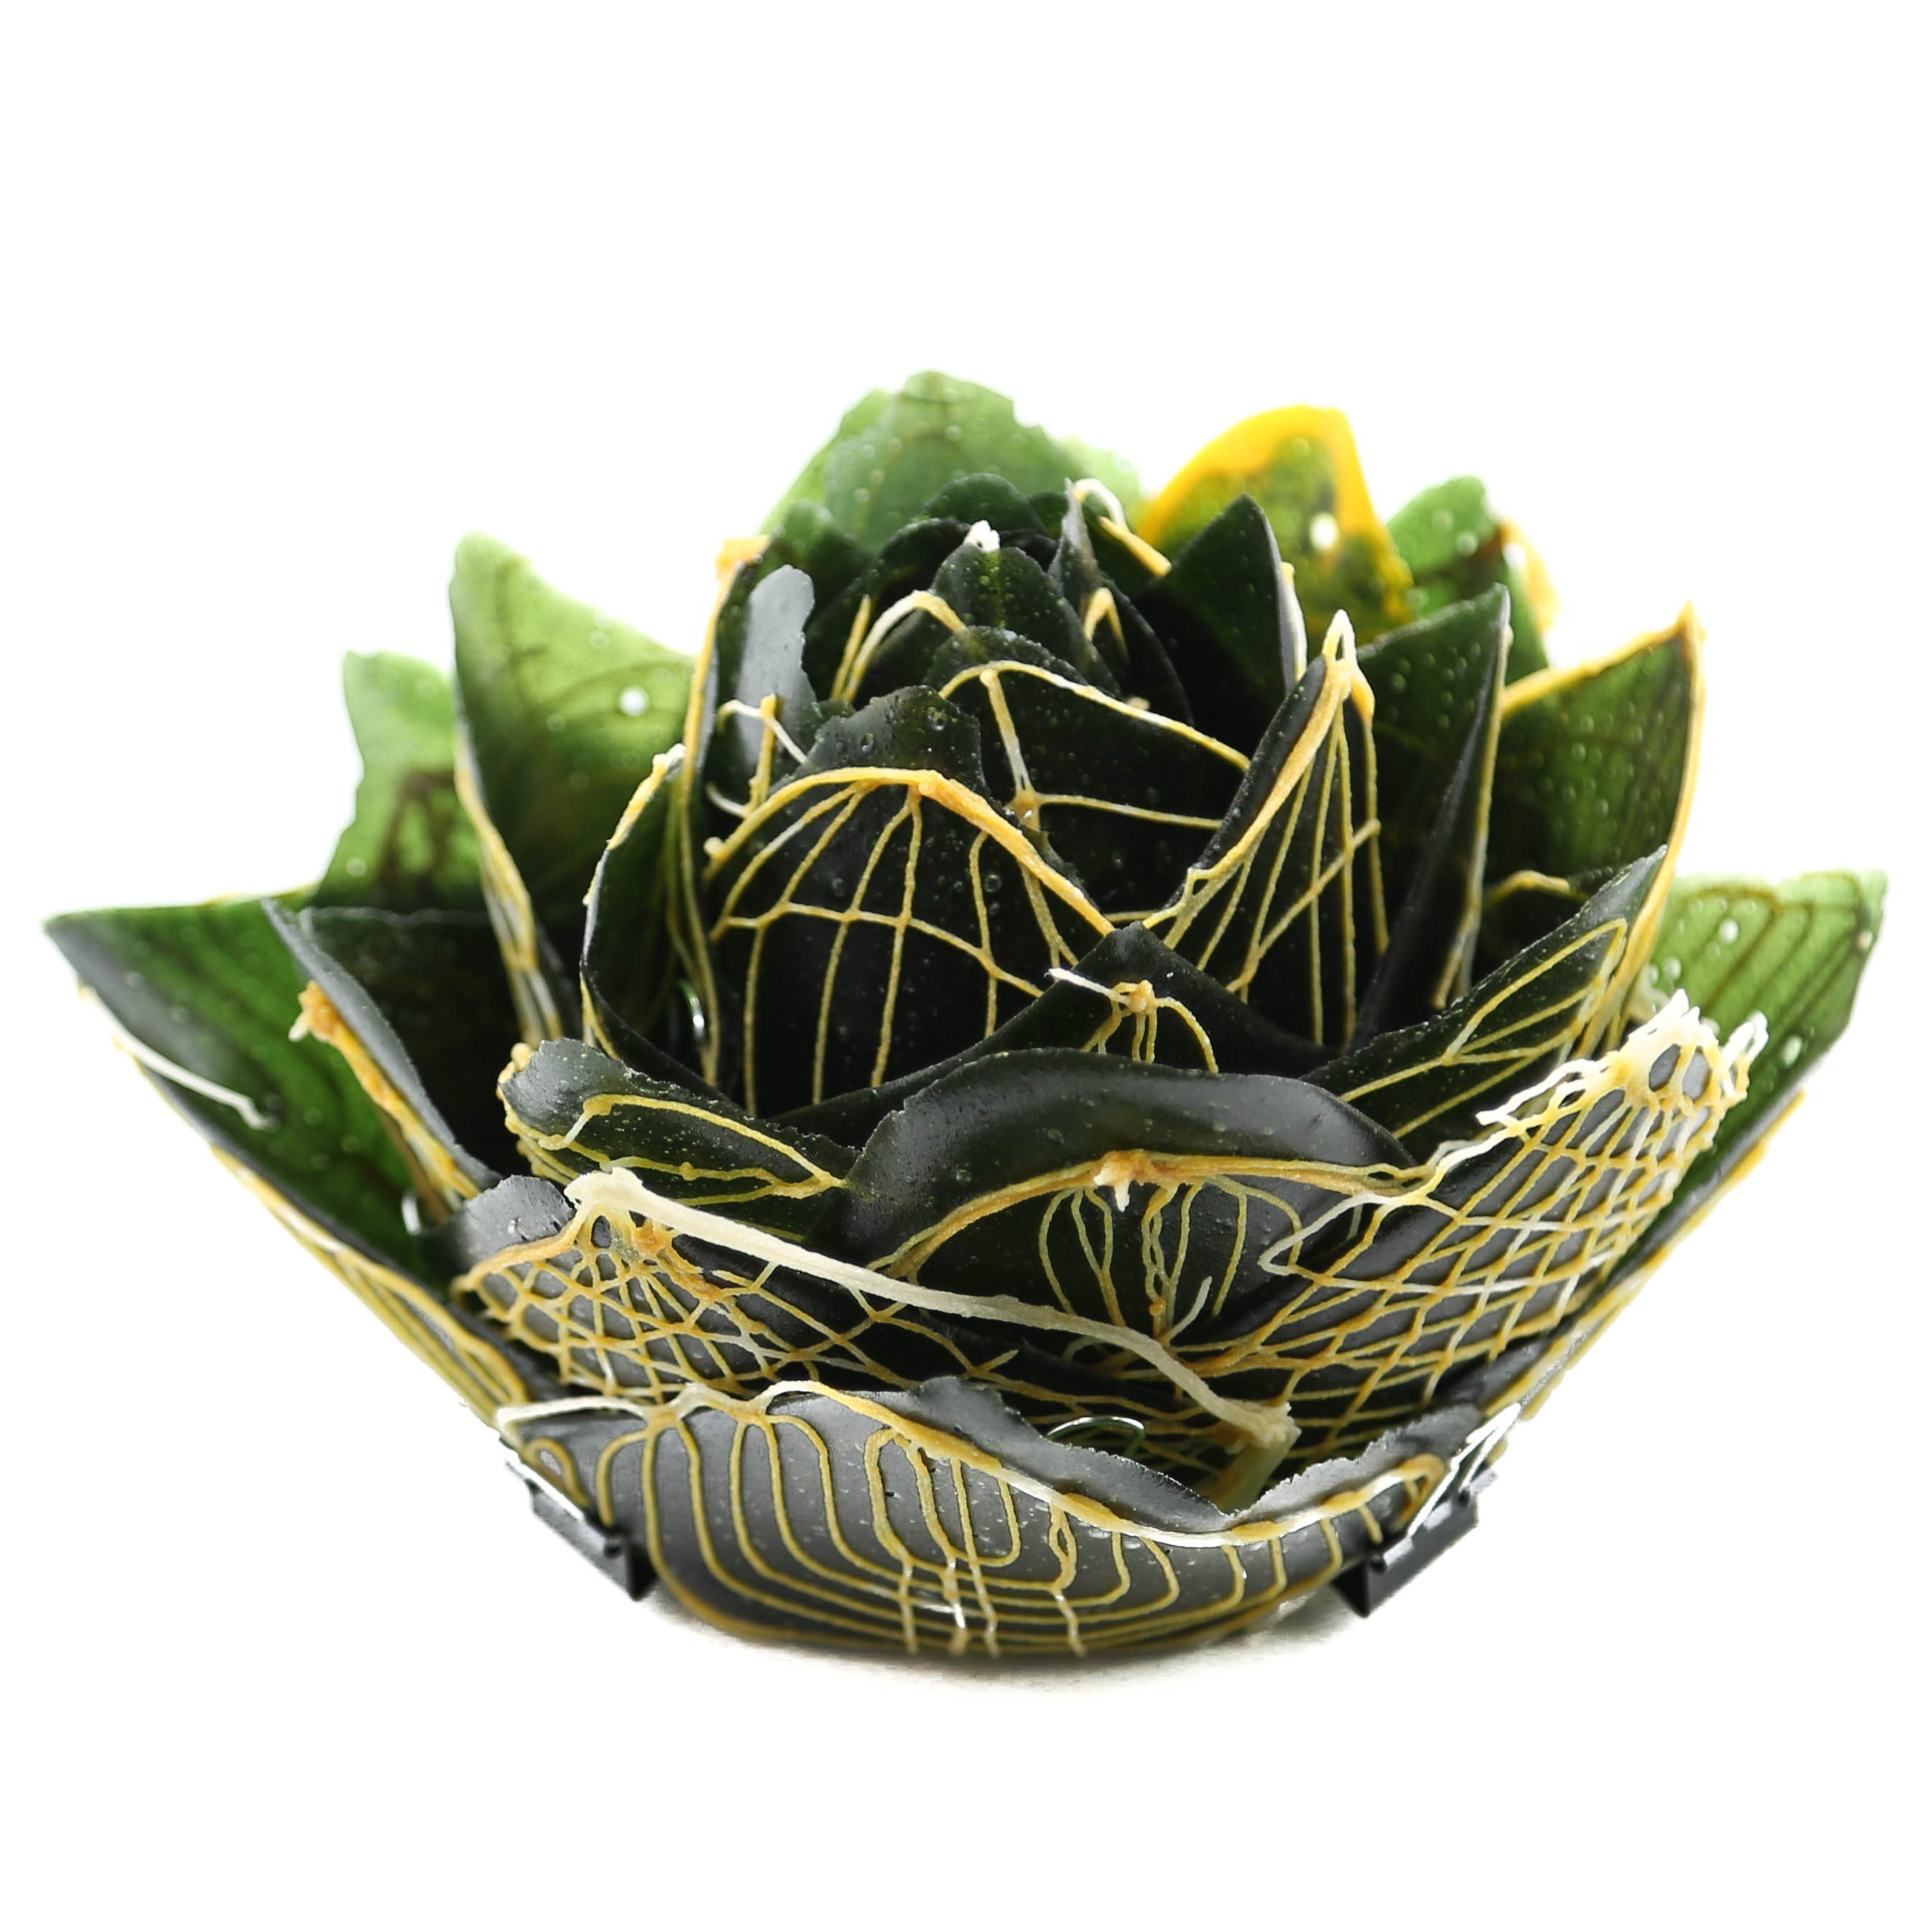
X Flower
These experiments examine how different material formulas can affect the deformation and color change of an aggregate, folded object over time. Each assembly is made of 8 folded X swatches printed with varying cellulose toolpath layers on top of a pectin base layer. Each swatch is folded and pinned at a different degree angle to nest within one another. The swatches are attached to one another from their central point. The collection of aggregated swatches is exposed to air.
The visual changes of the assemblies are tracked for a period of time.
- Exposure to air is recorded during the first month and at 12 months.
- Swatches are imaged with and without backlighting in plan and side view.
- Changes in color and shape are visible.
8 different sets of 8 swatch folded assemblies are tested that control for the same toolpaths but vary the material formula with 8 different types of pectin: Standard, Chitosan, Calcium, Turmeric, Beet, Matcha, Spirulina and Charcoal.
The assemblies do not exhibit extreme degrees of color or shape change largely due to their lack of chitosan content. Because the swatches are shrinking at the same rate and the connections between pieces are fairly flexible, the aggregate forms avoid tearing and high deformation.