Figure I: Diagram comparing volume of material, print duration, and cost for different biopolymer formulas used in each multimaterial print in the series of 70 skins.
Figure II: Diagram comparing volume of material, print duration, and cost for different biopolymer formulas used in each print in the series of 120 swatches.

Figure III: Animation of composite pie chart circle diagram comparing cost of materials for each multimaterial print (70 skins) and single material print (120 swatches).
Figure IV: Animation of composite pie chart circle diagram comparing ingredient volume for each multimaterial print (70 skins) and single material print (120 swatches).

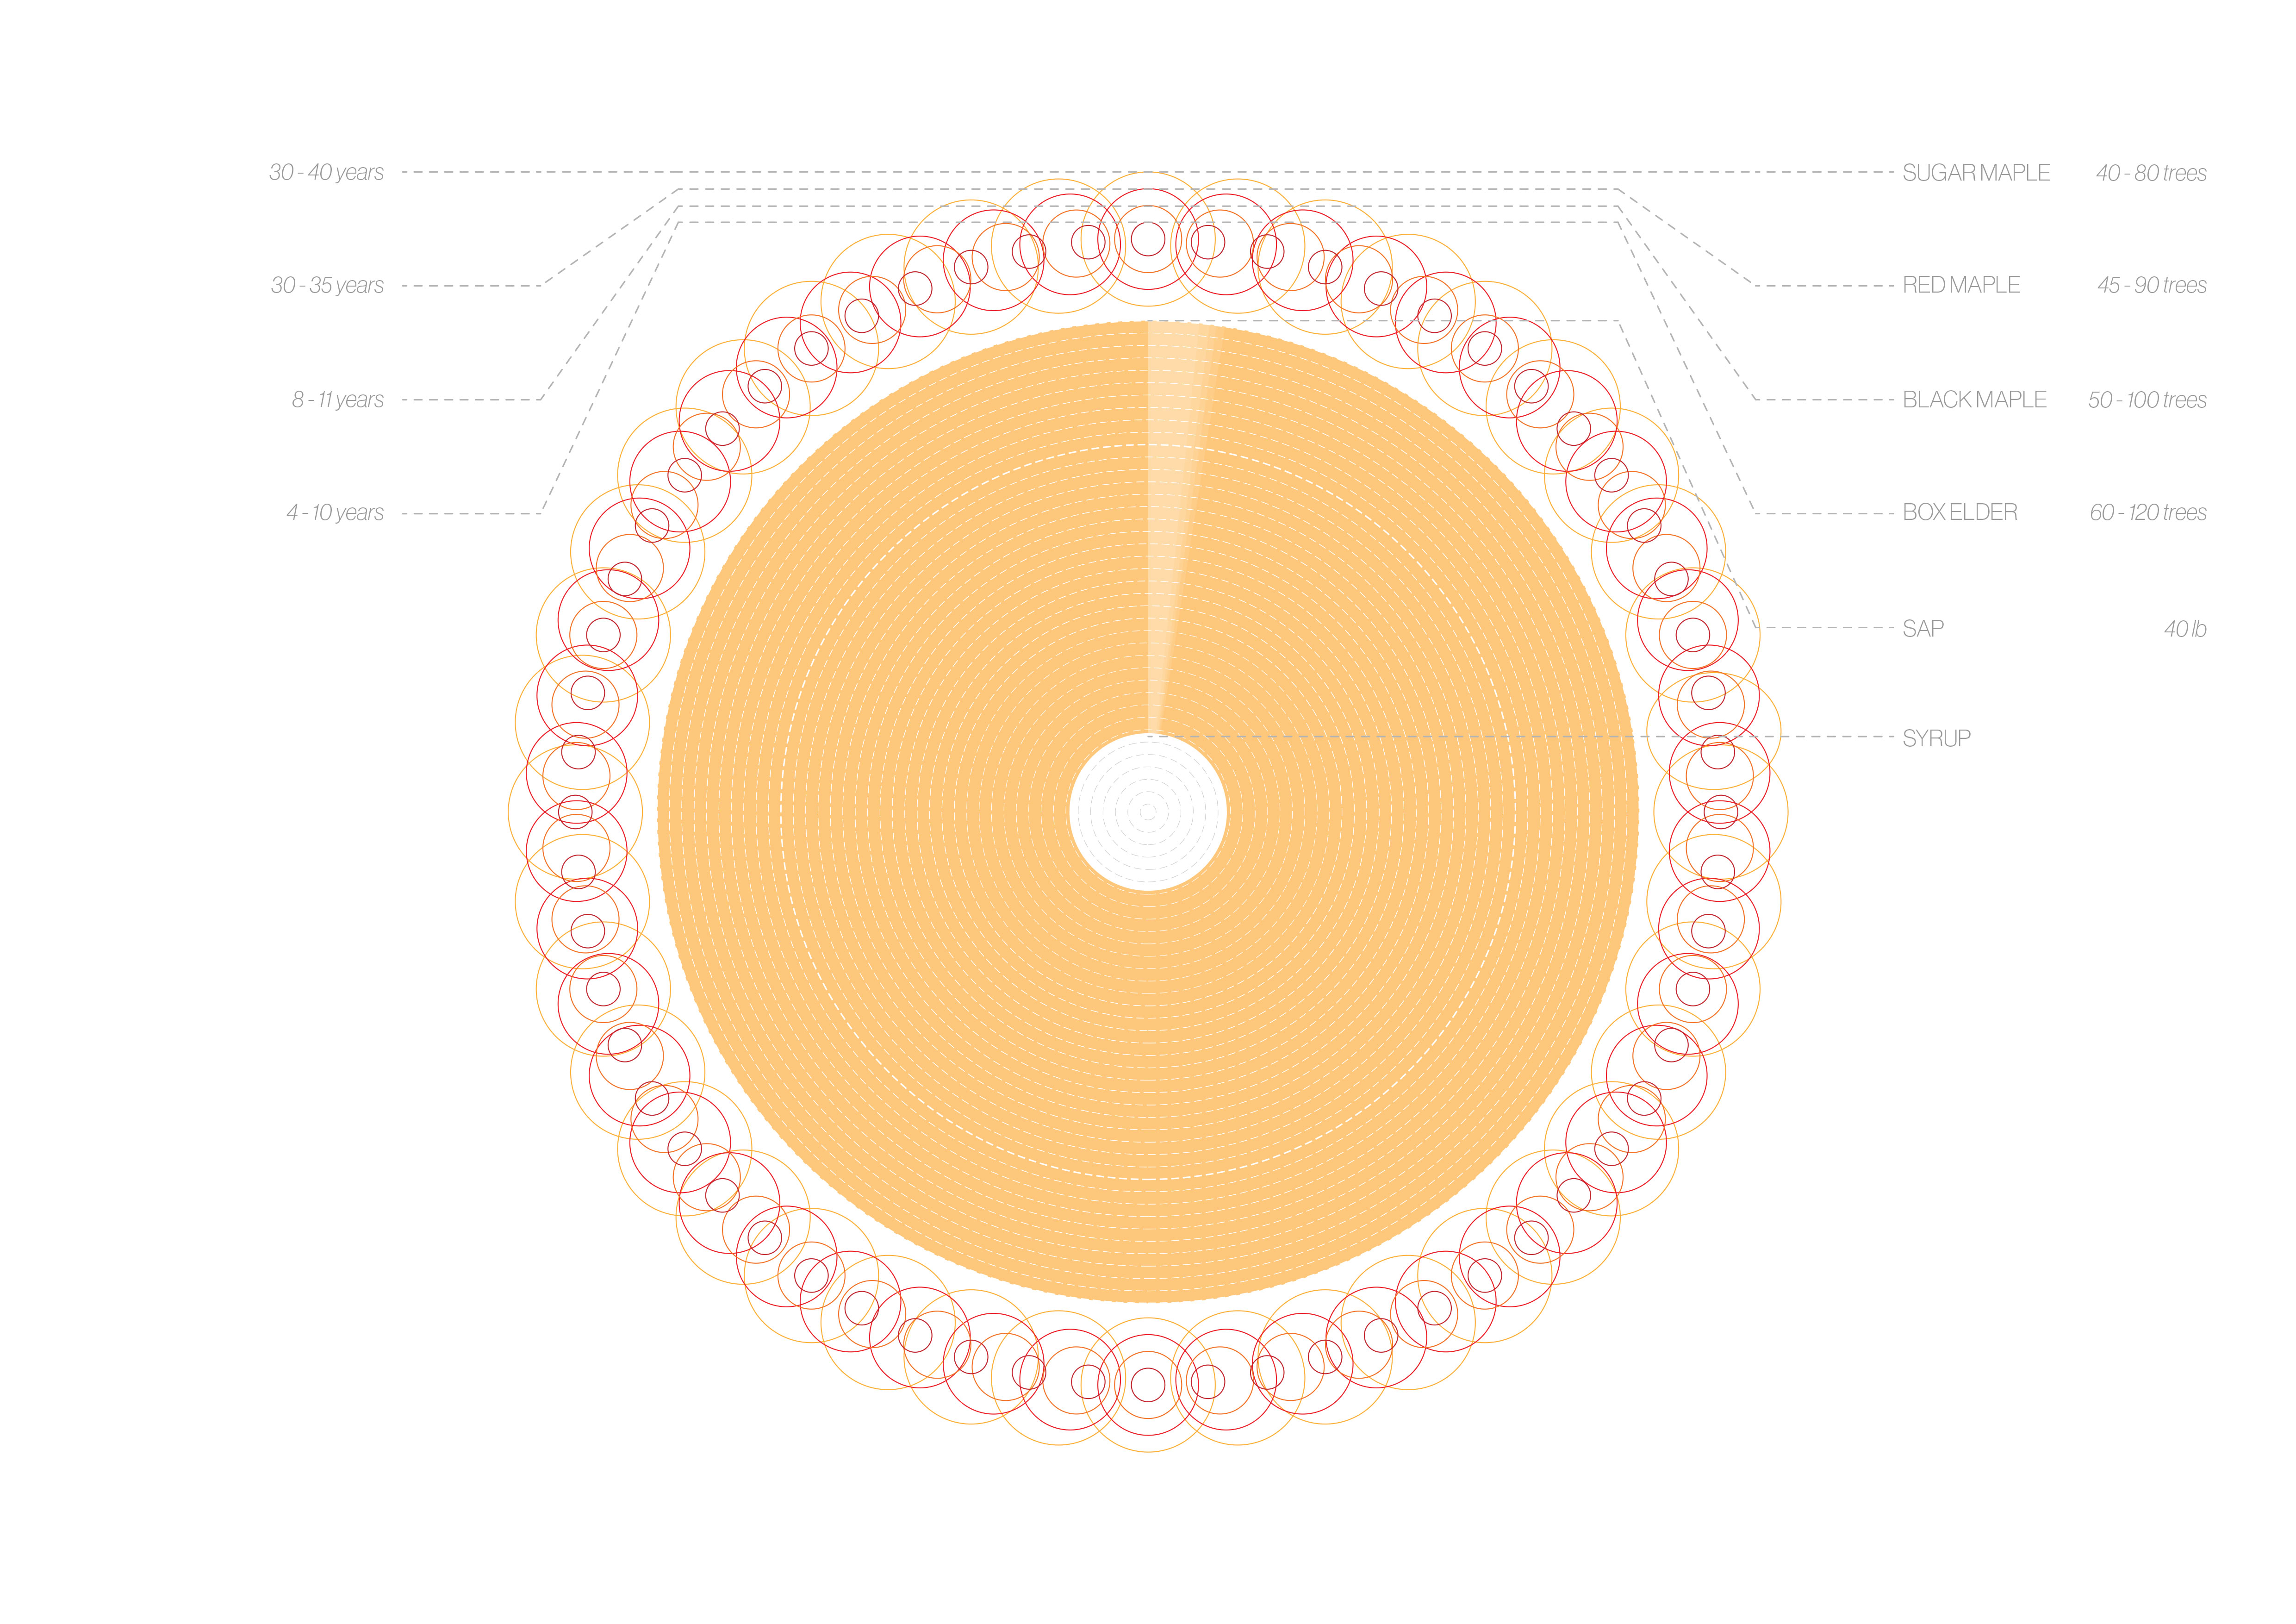
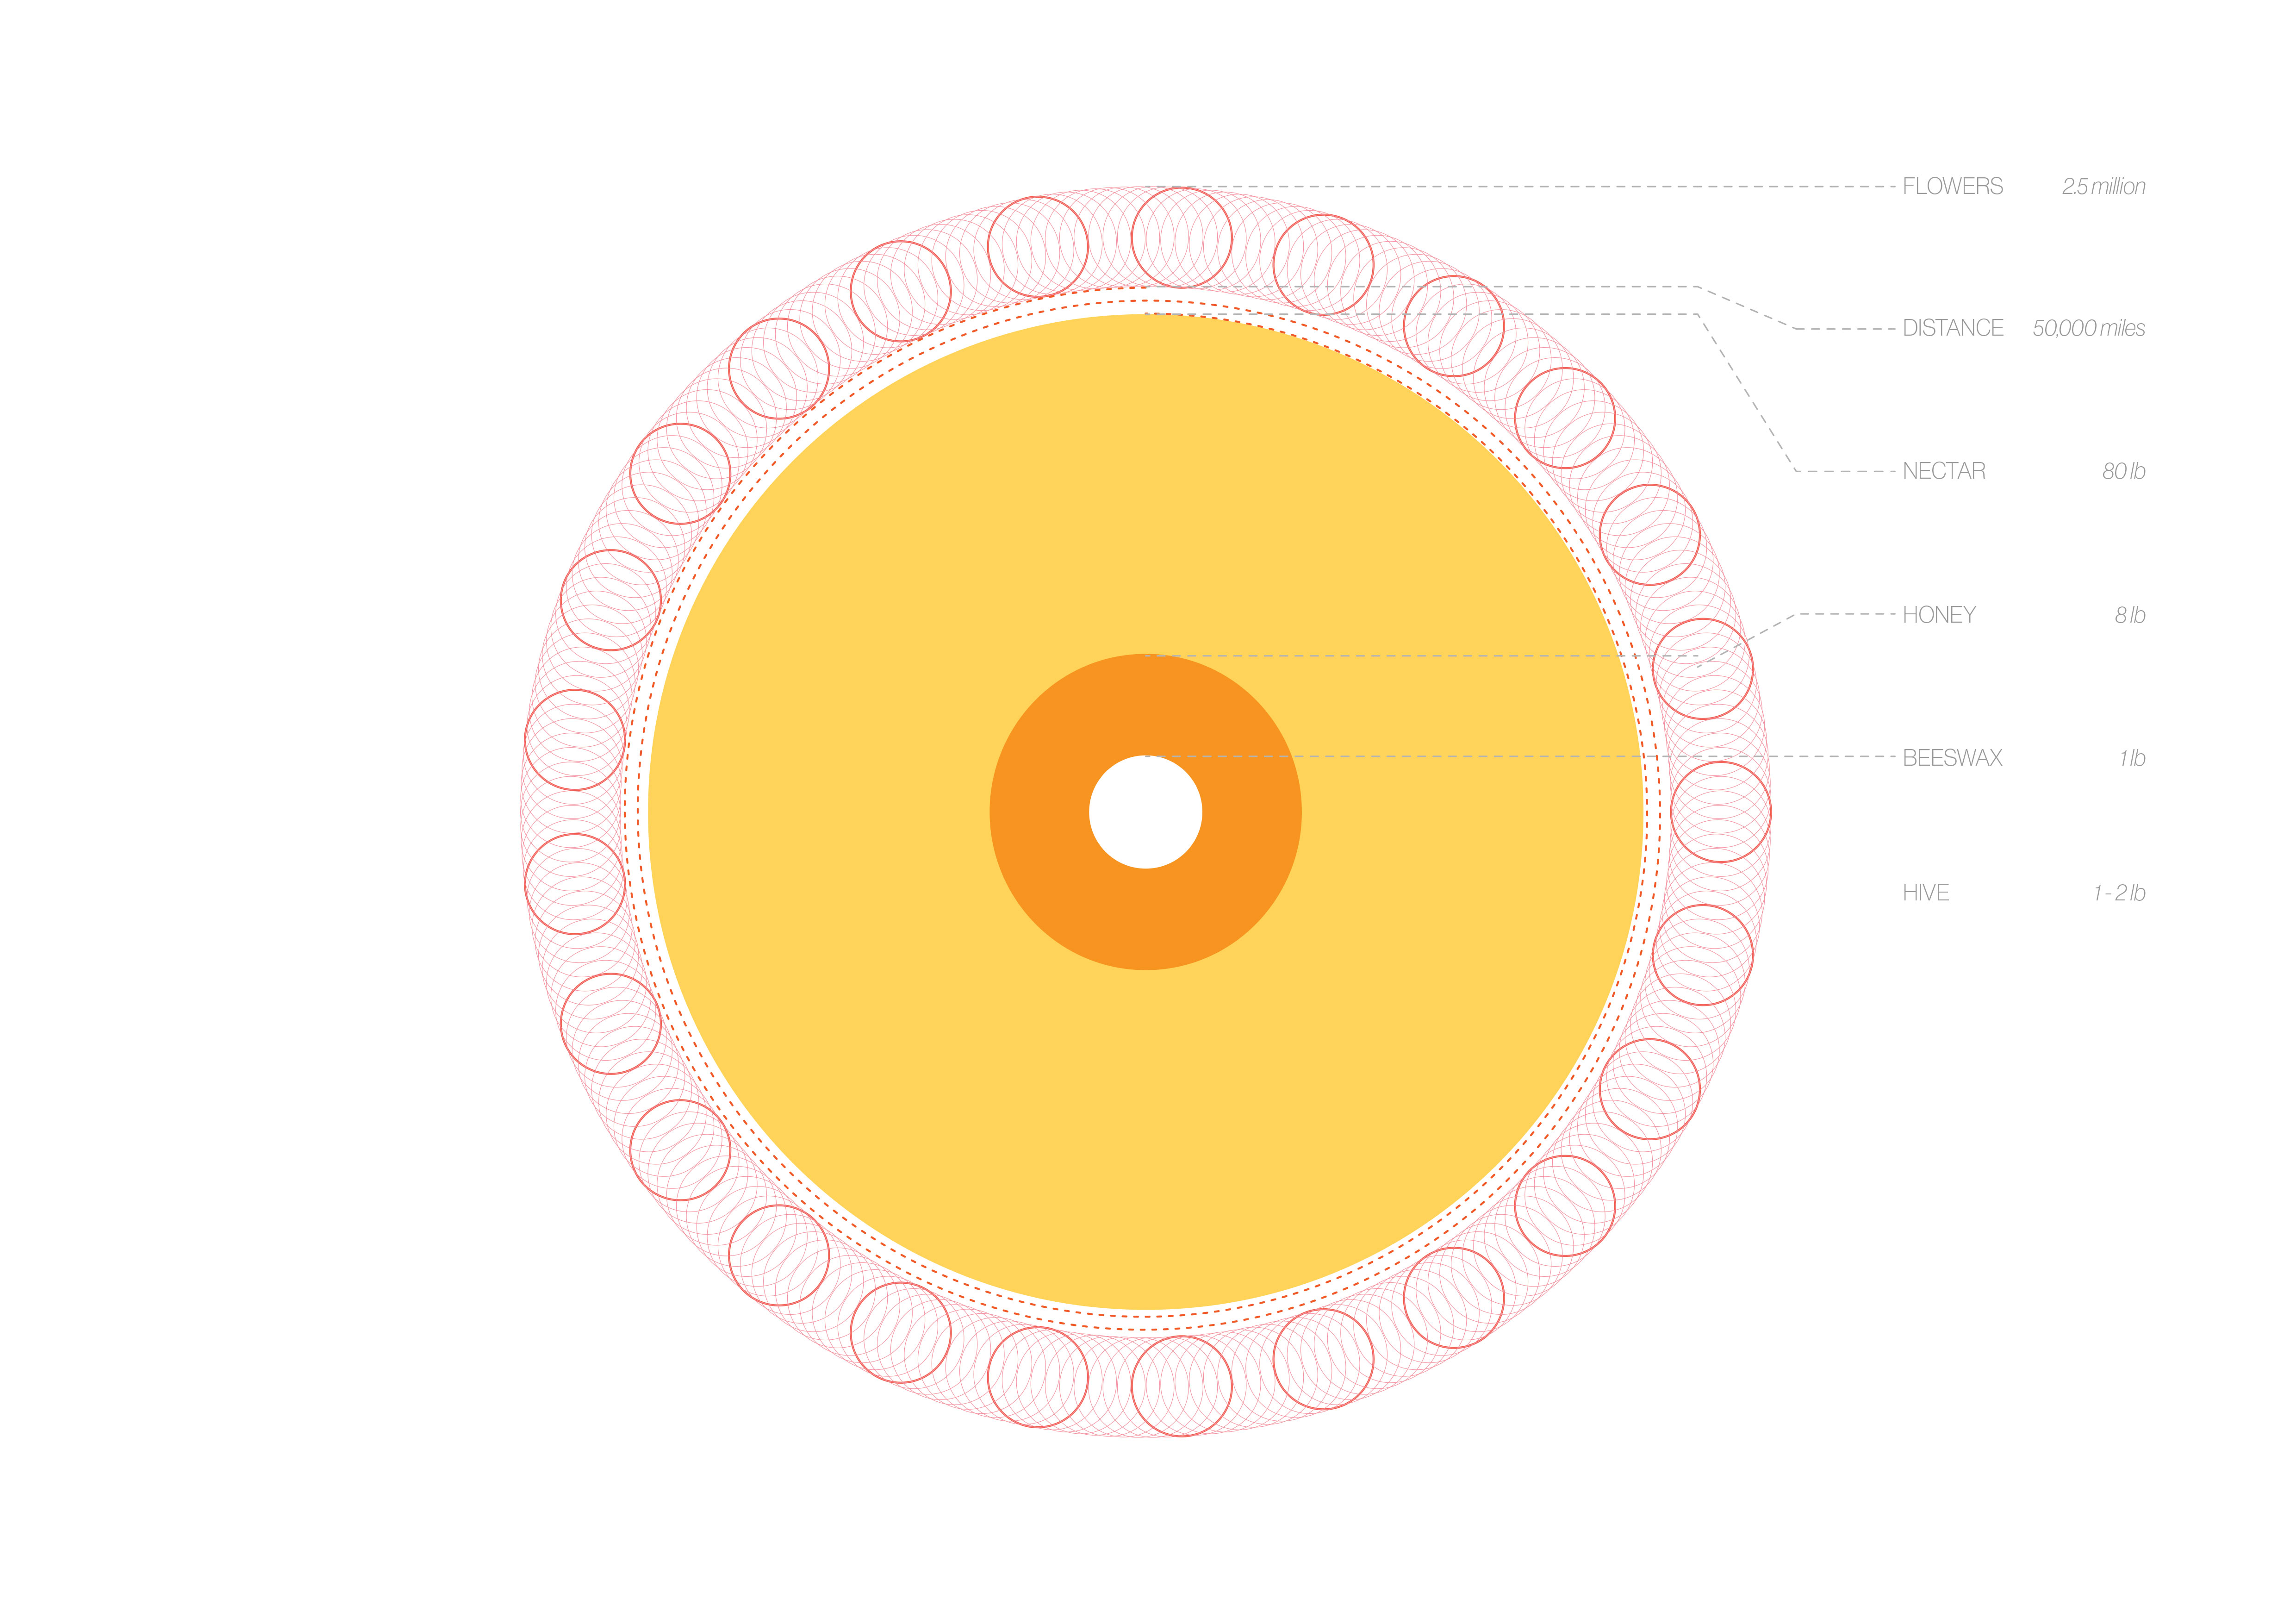


Figure V: Diagrams illustrating the yield of bio materials (pectin, honey, tree sap, chitosan) with the number of organisms and amount of time needed to naturally grow and refine 1 lb. of materials in an ecosystem.

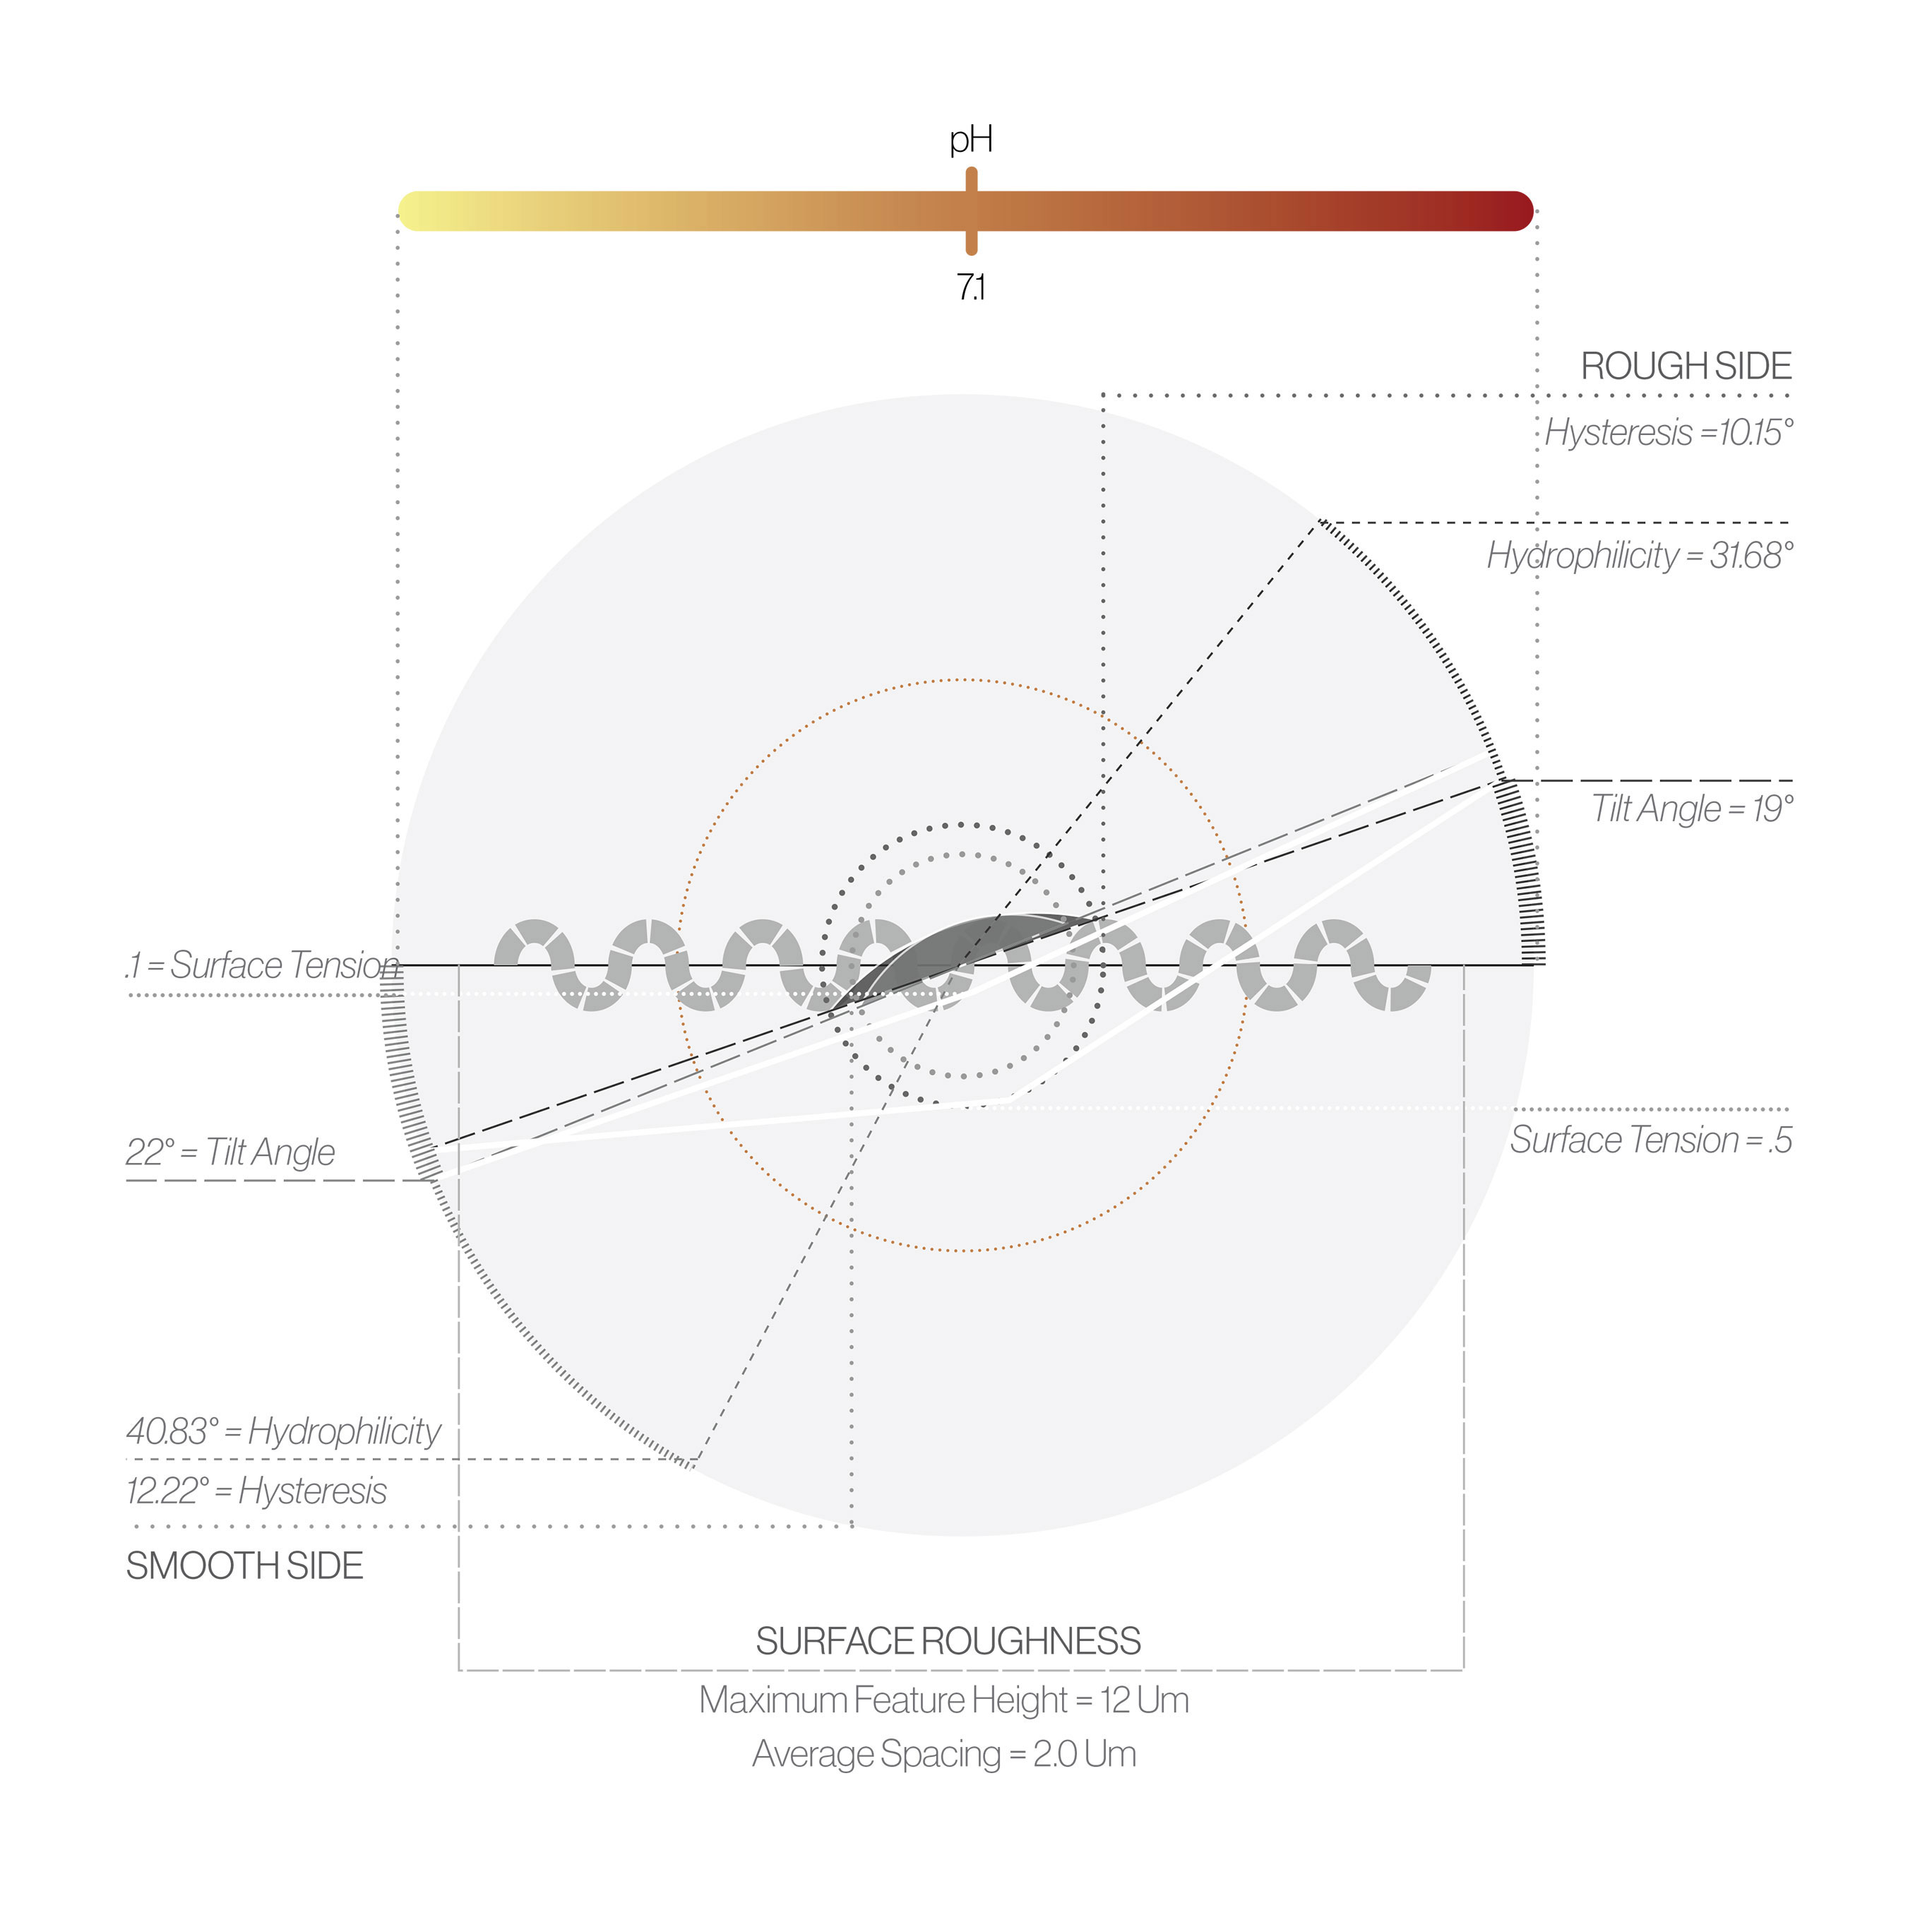

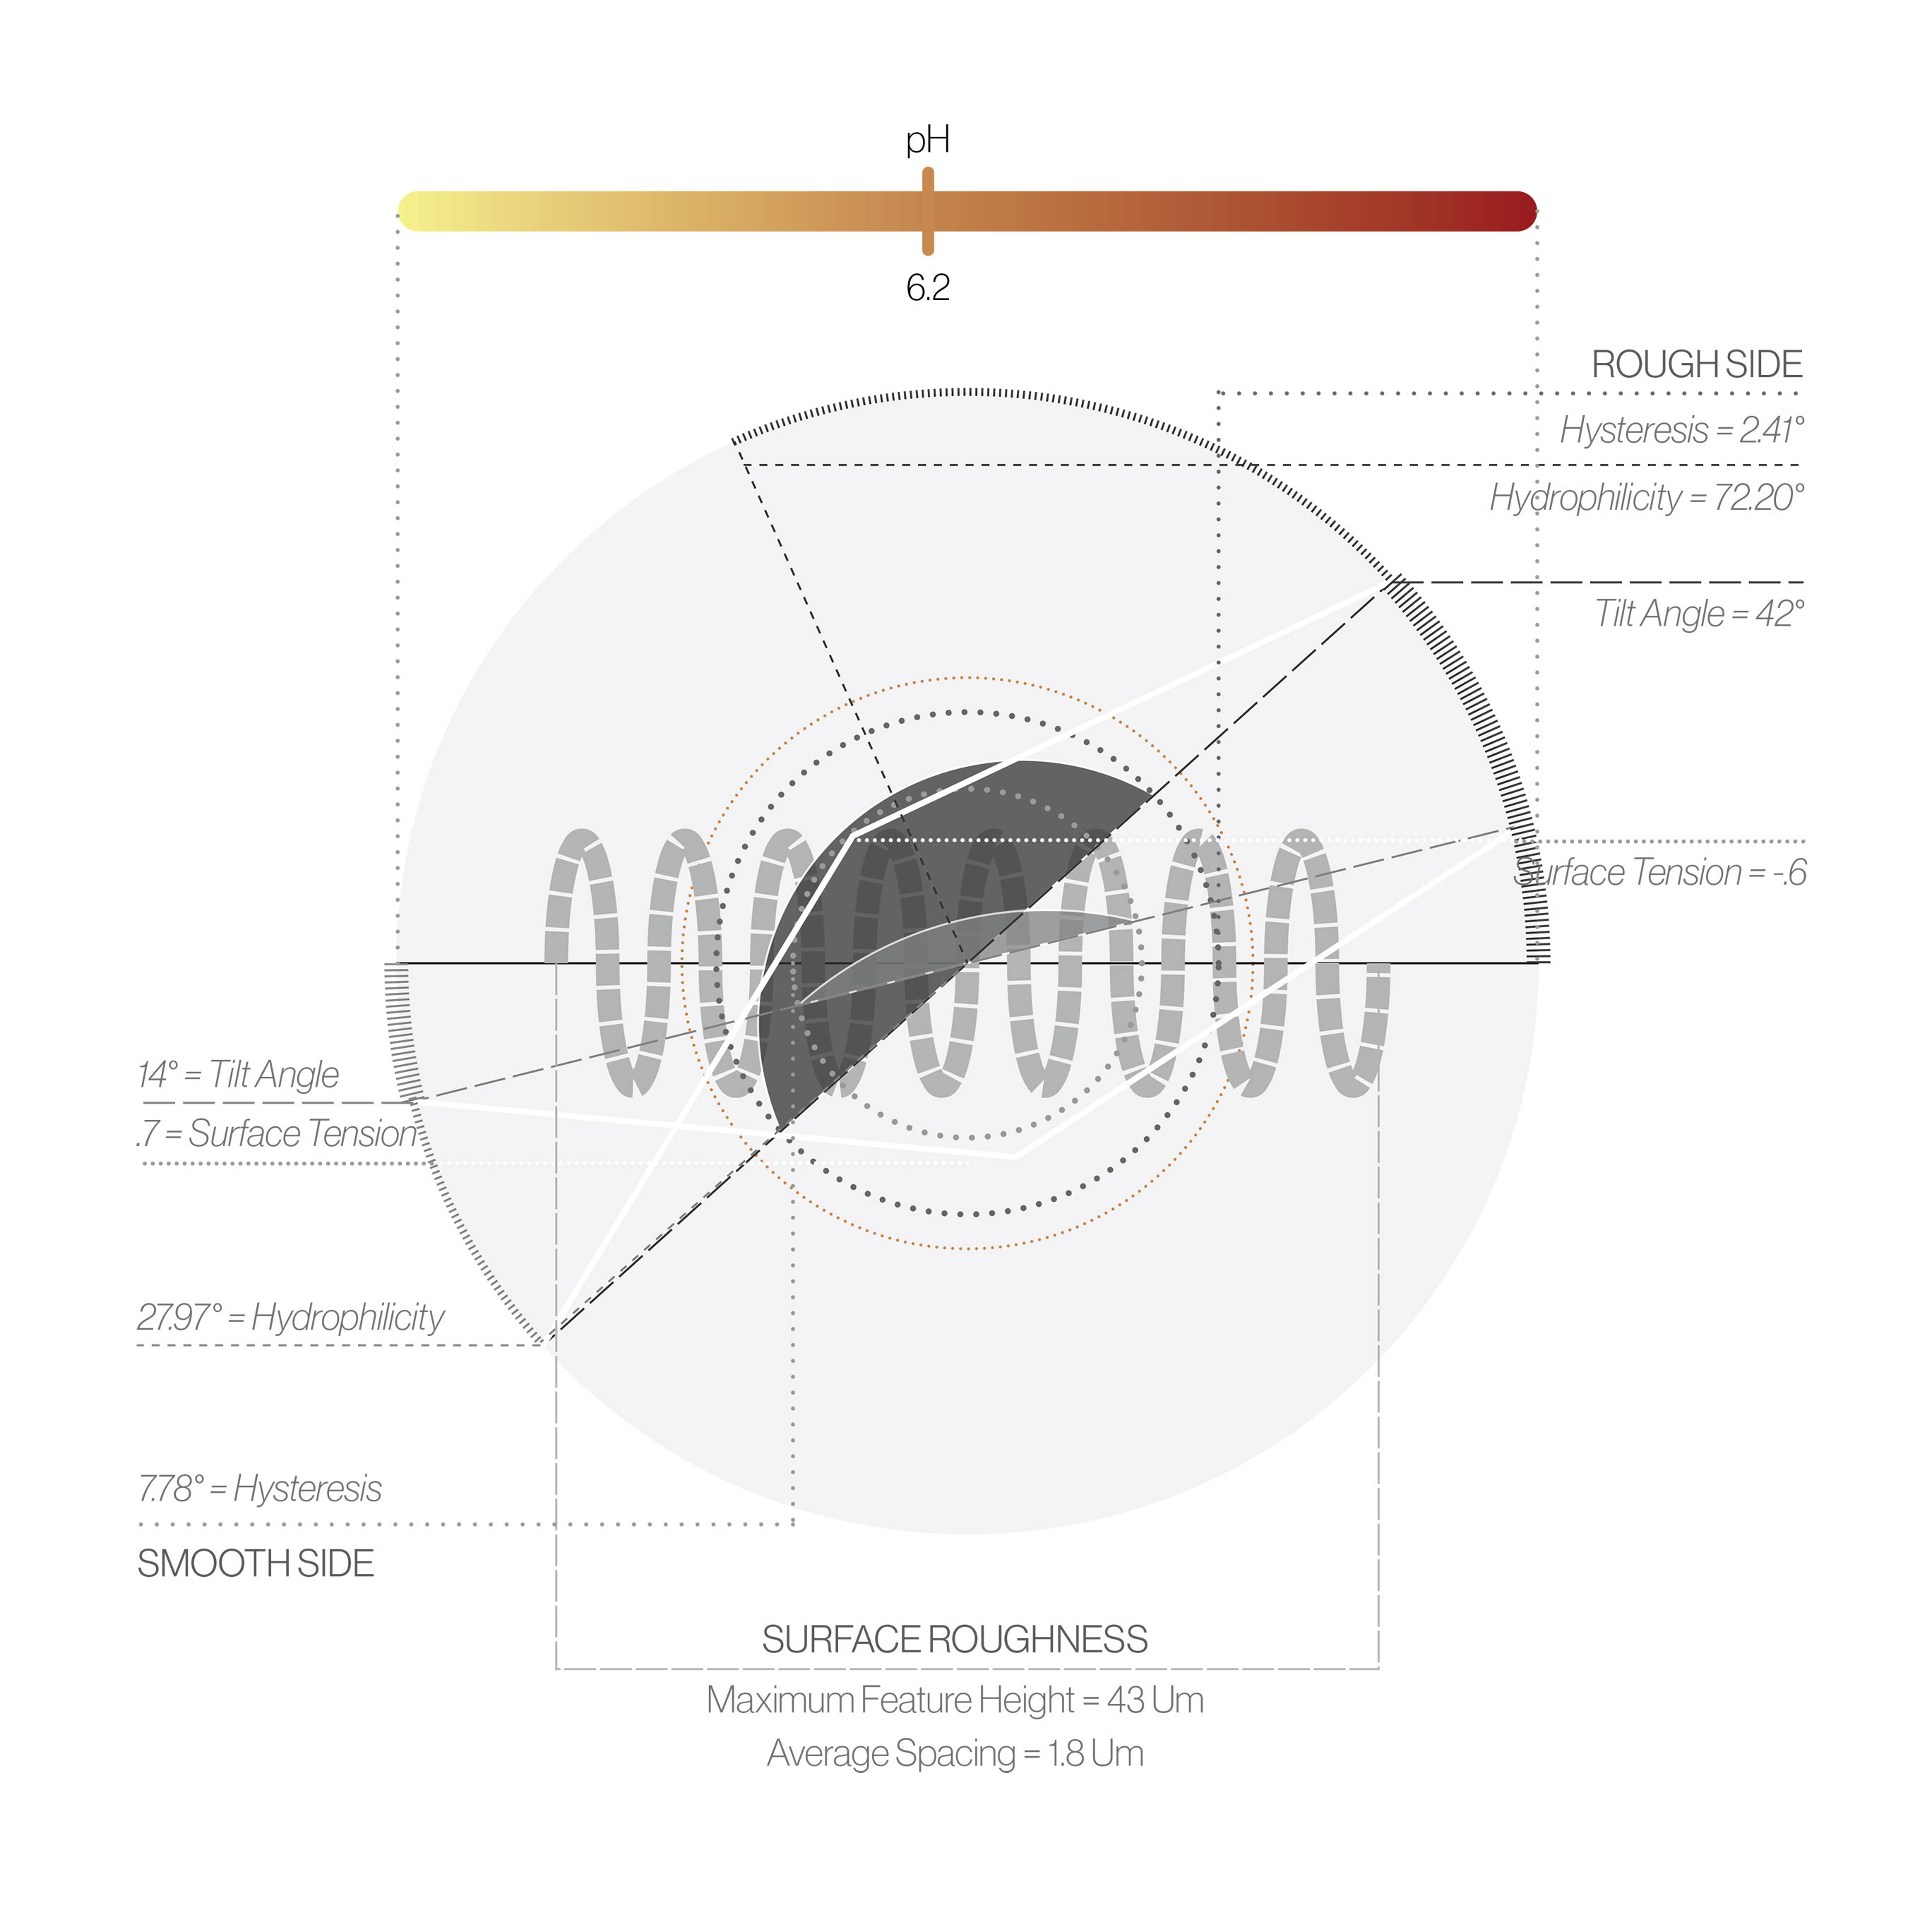
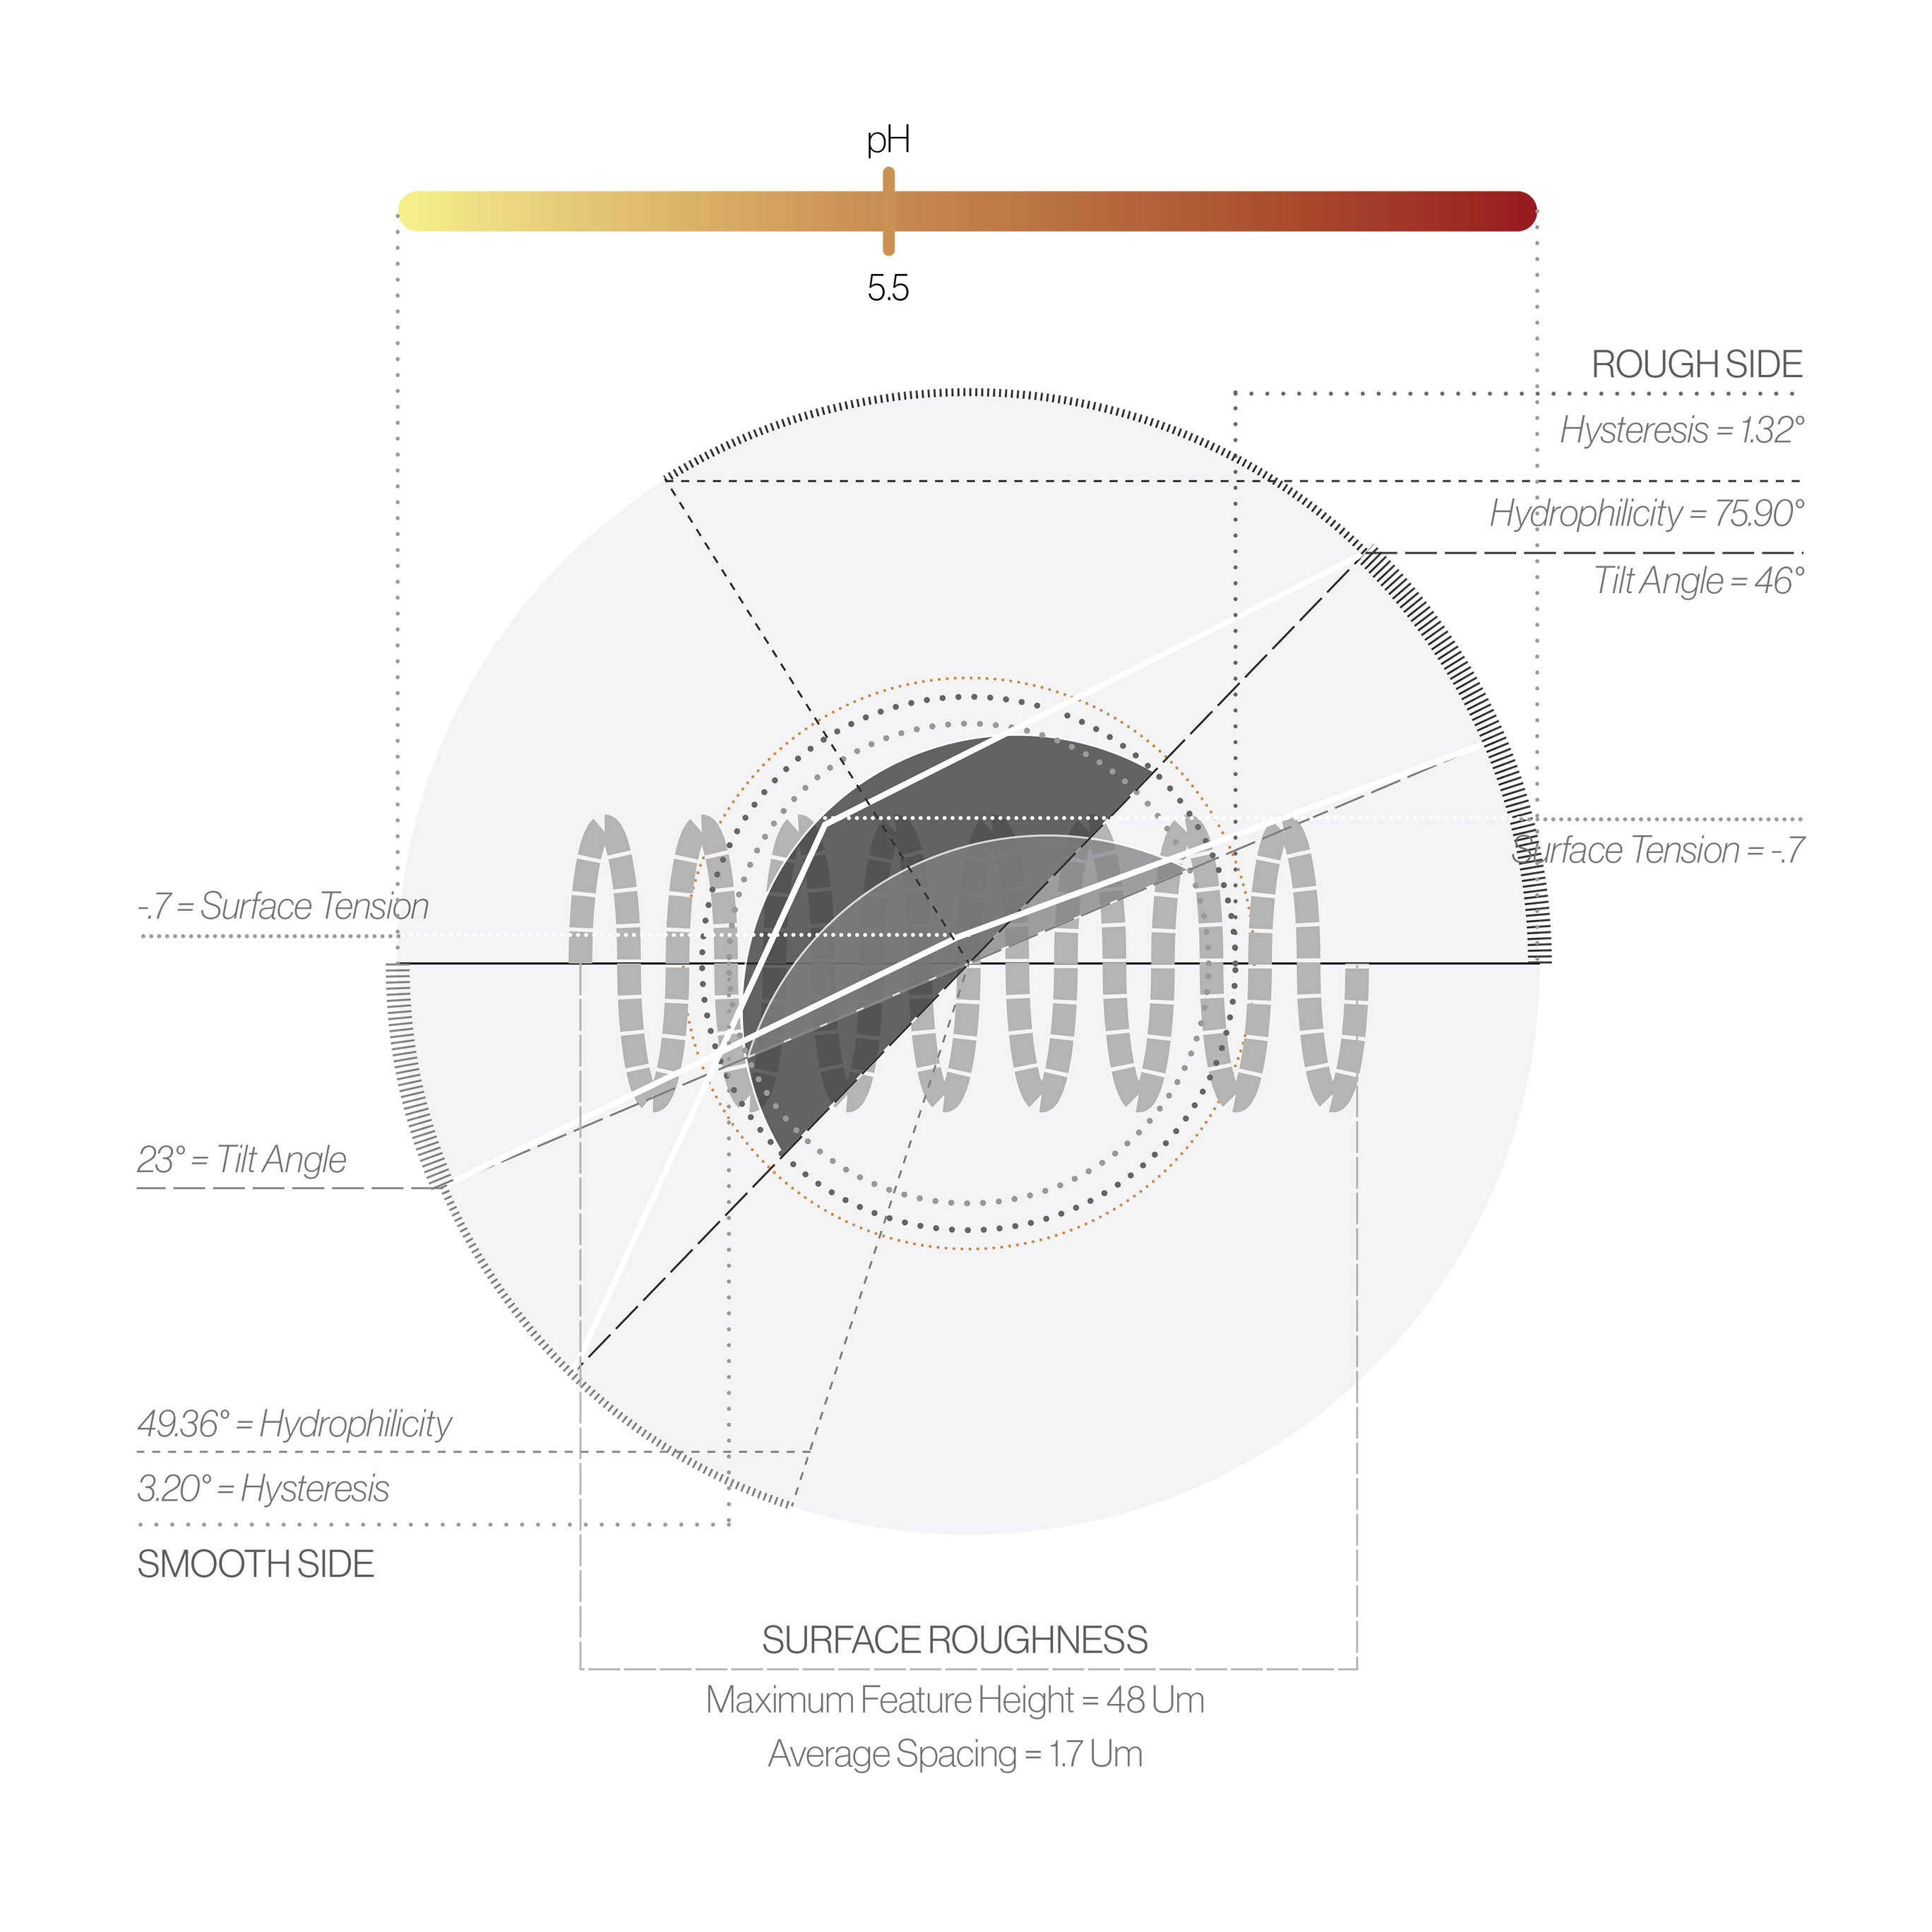
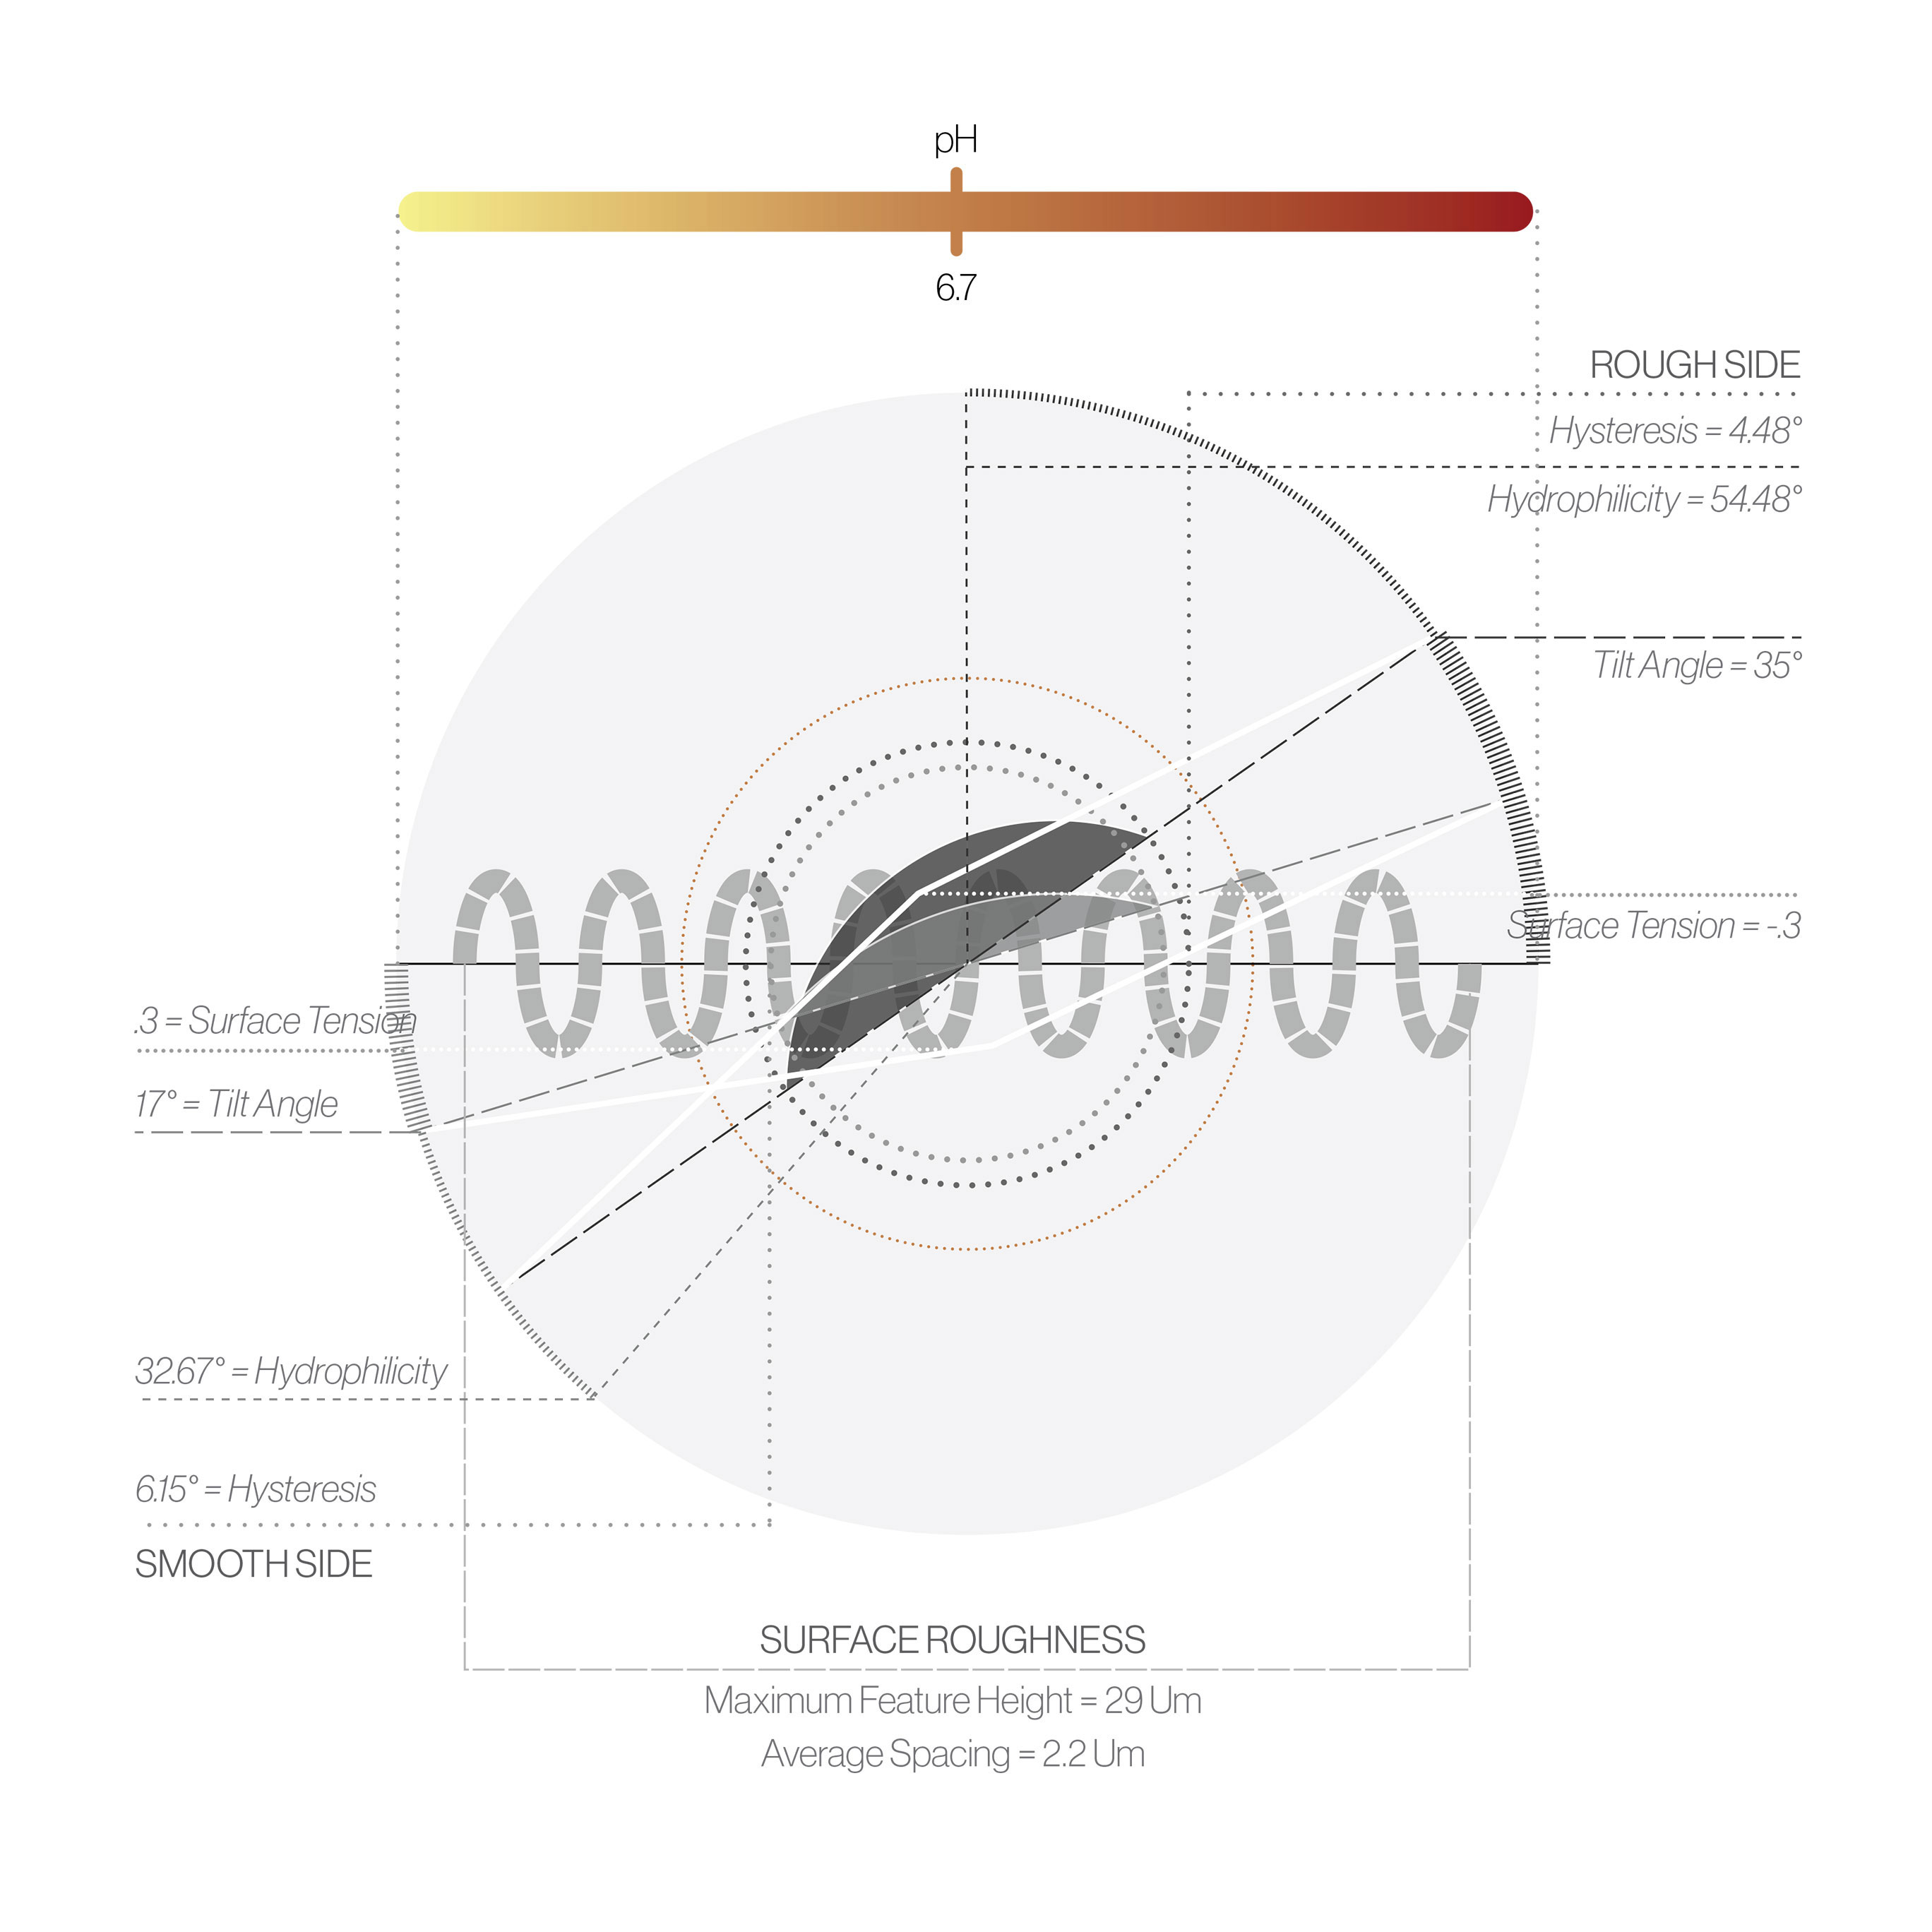
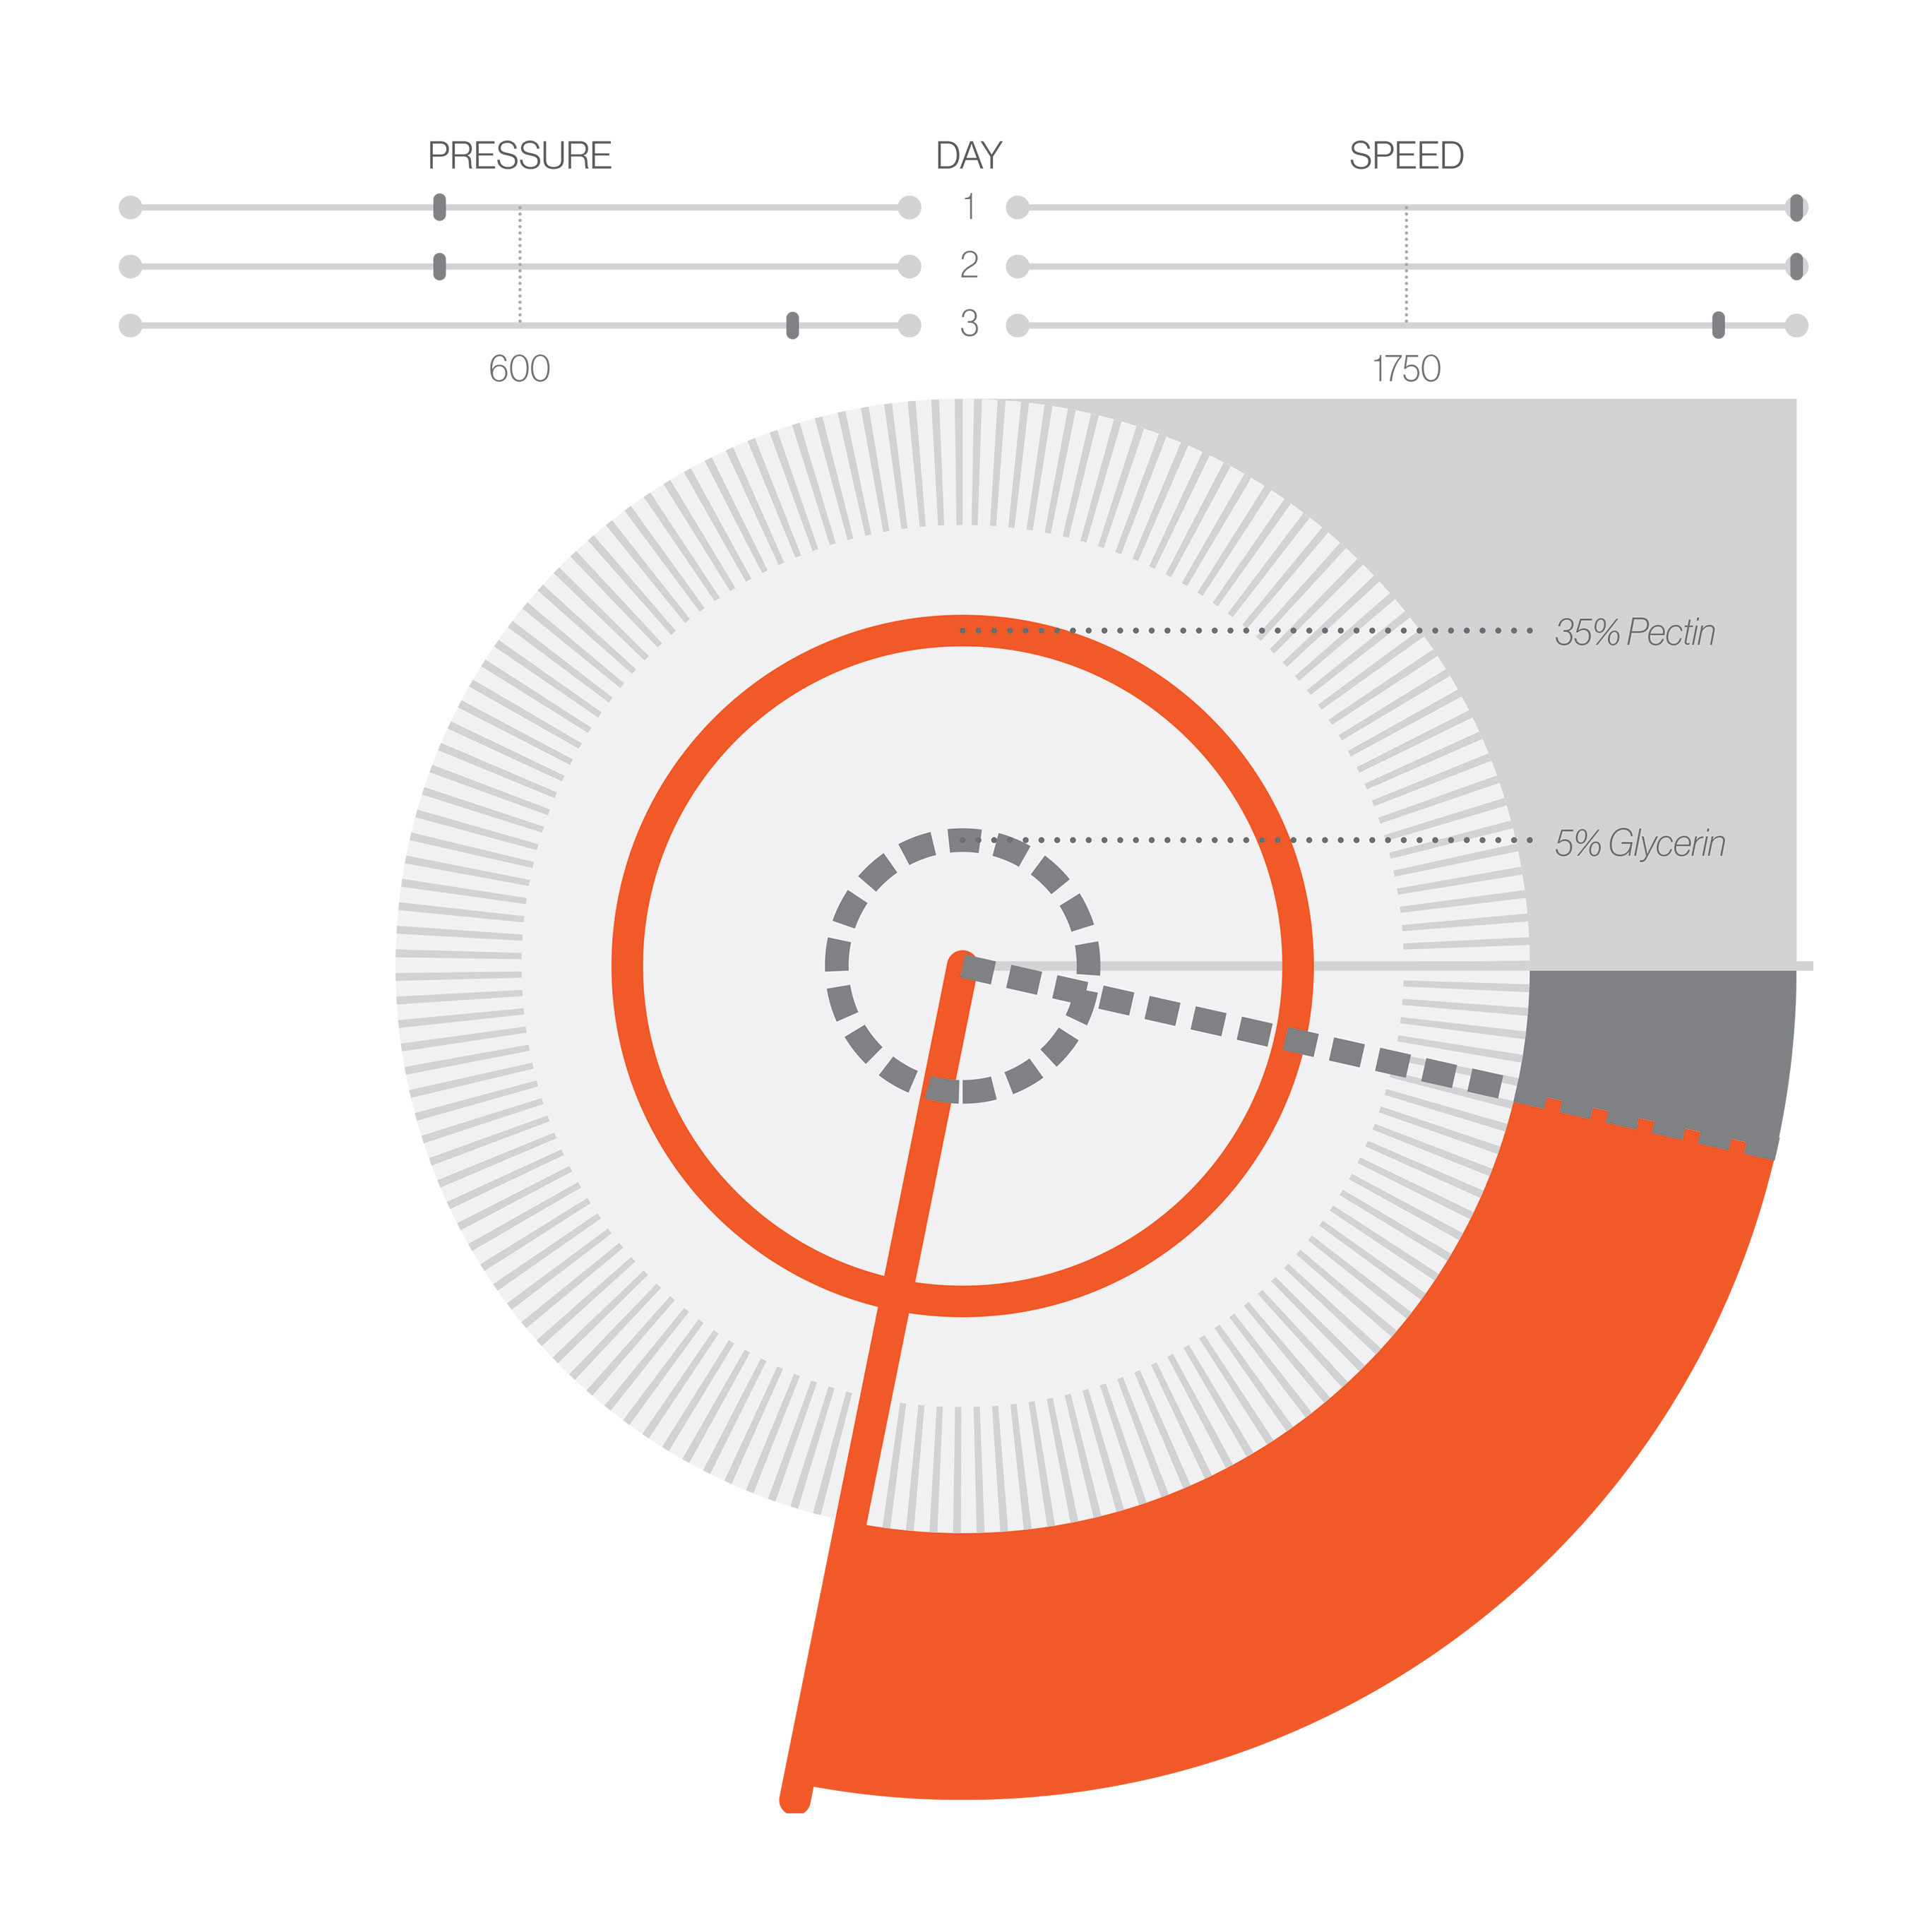


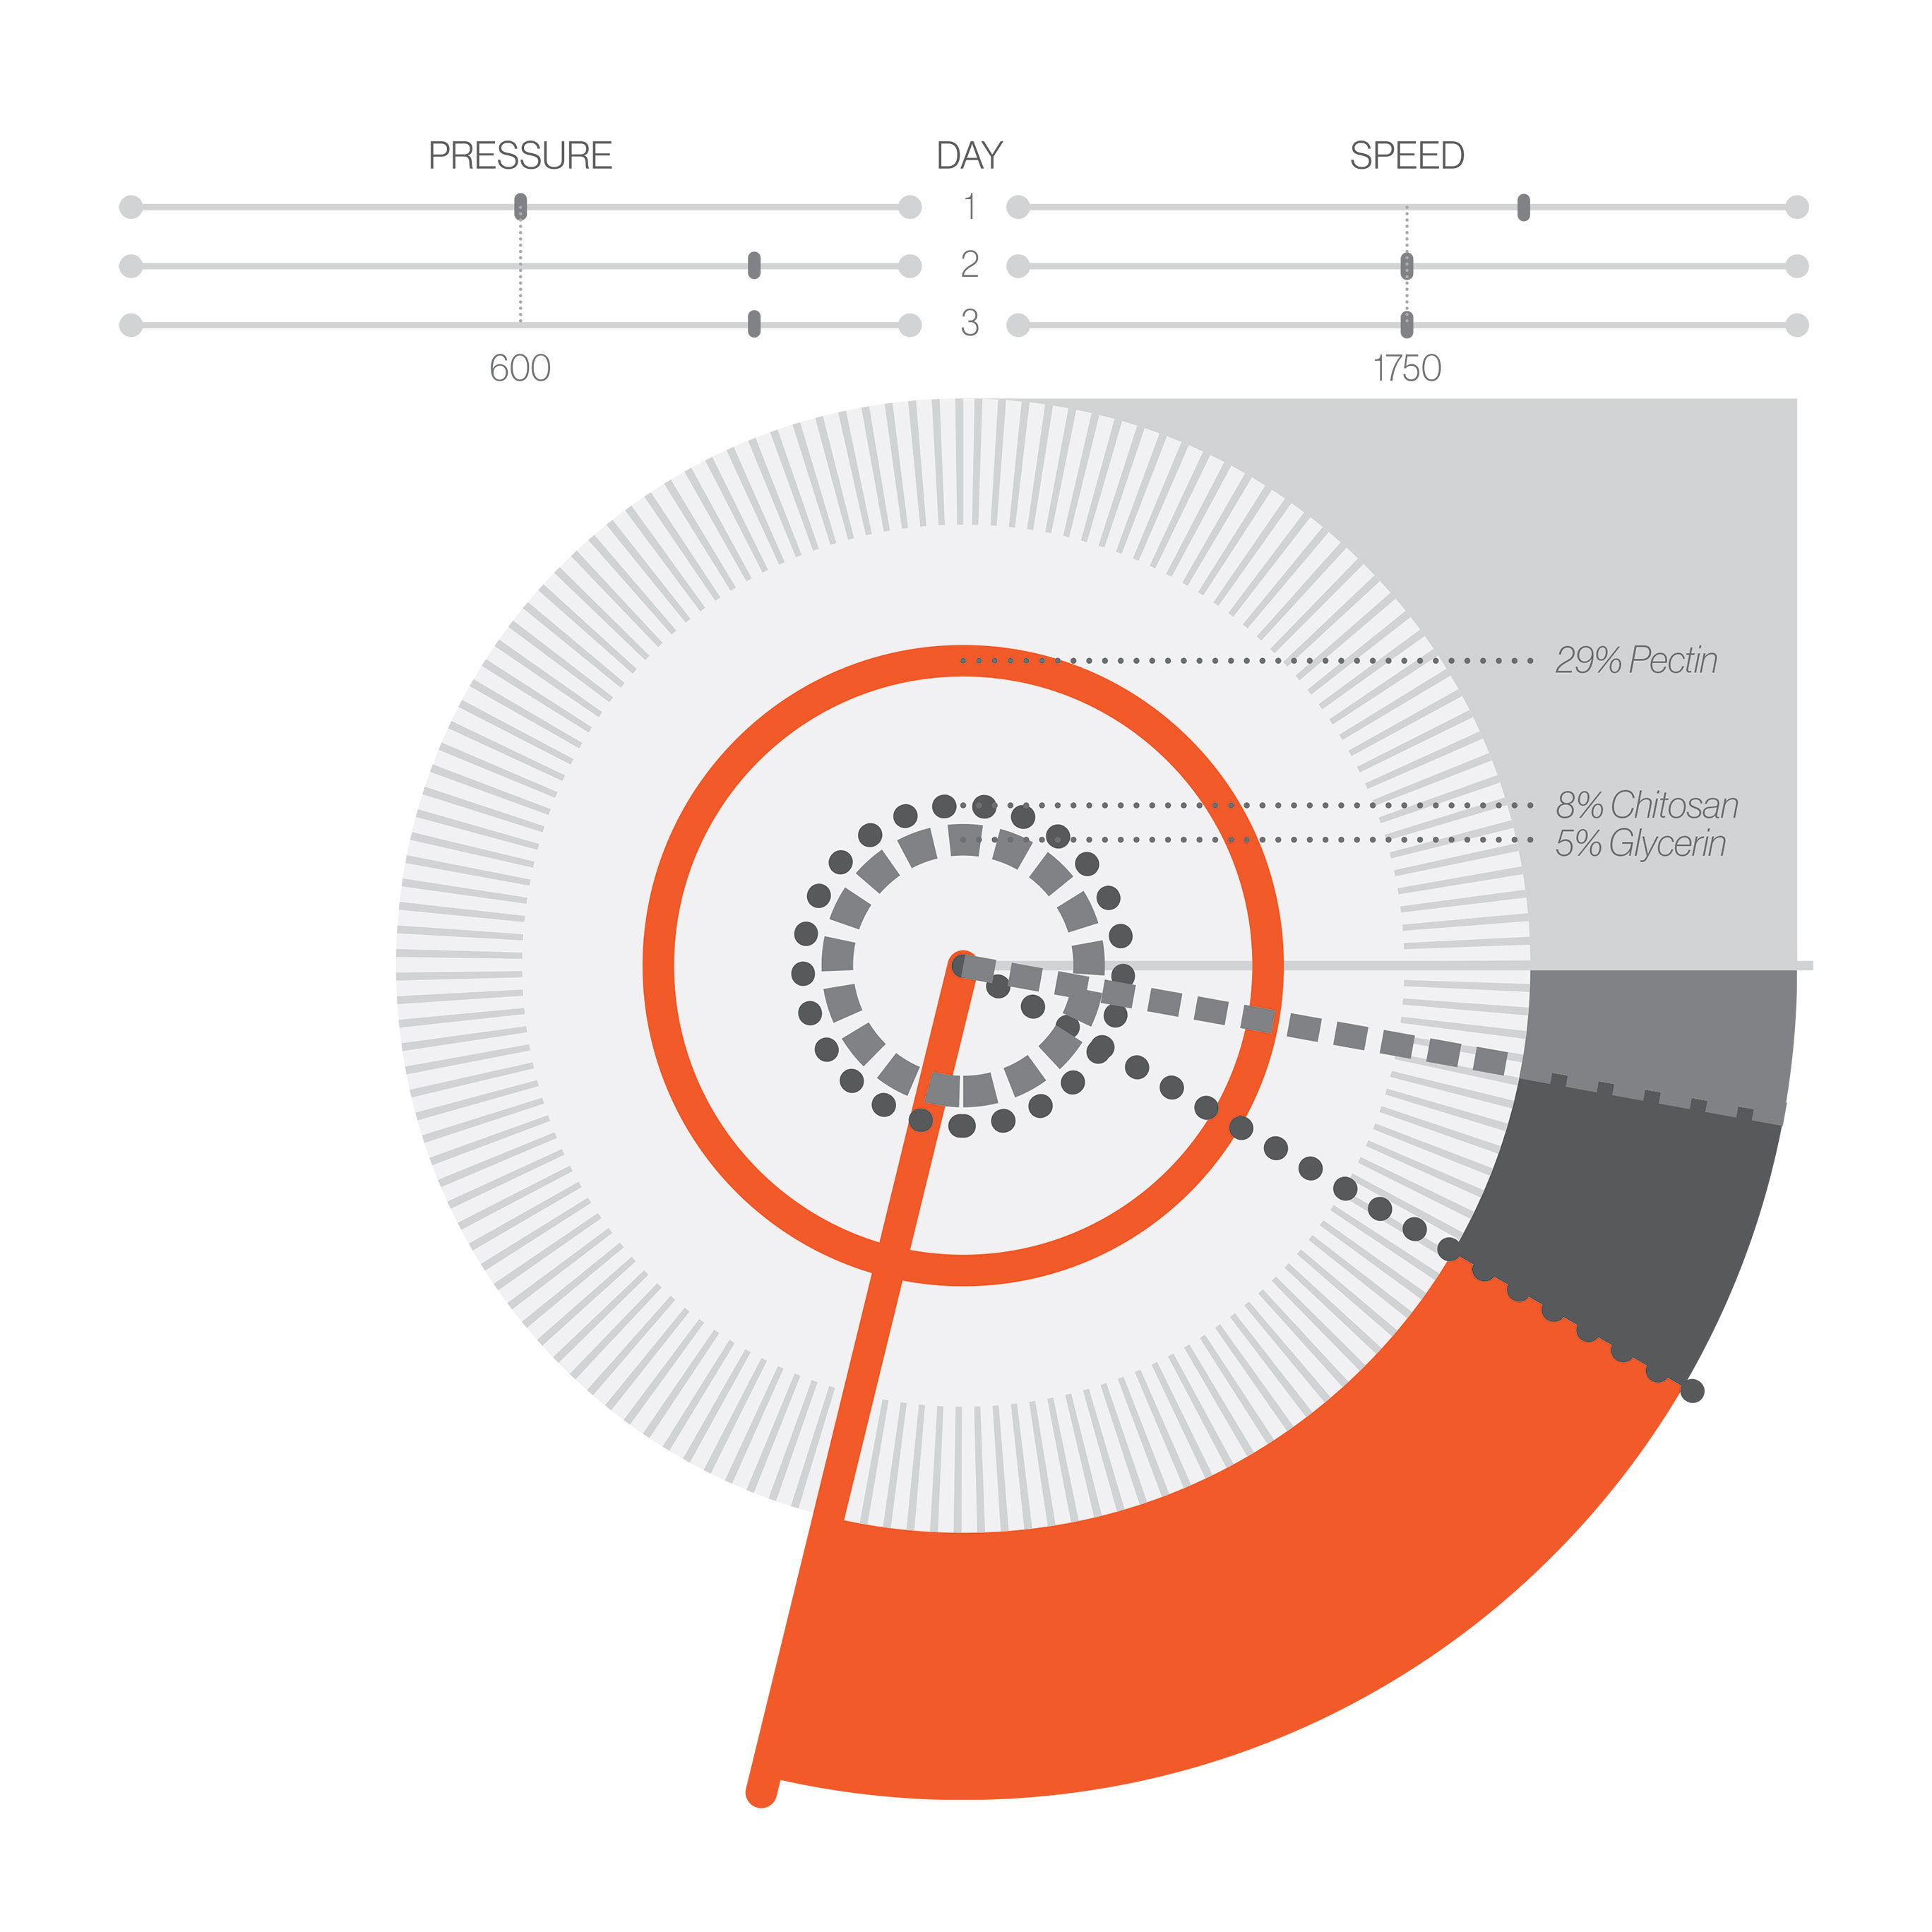


Figure VI: Diagram showing physical material properties of 5 primary base pectin formulation that include hydrophilicity, hysteresis, surface tension, roughness, optimal speed and pressure print parameters.
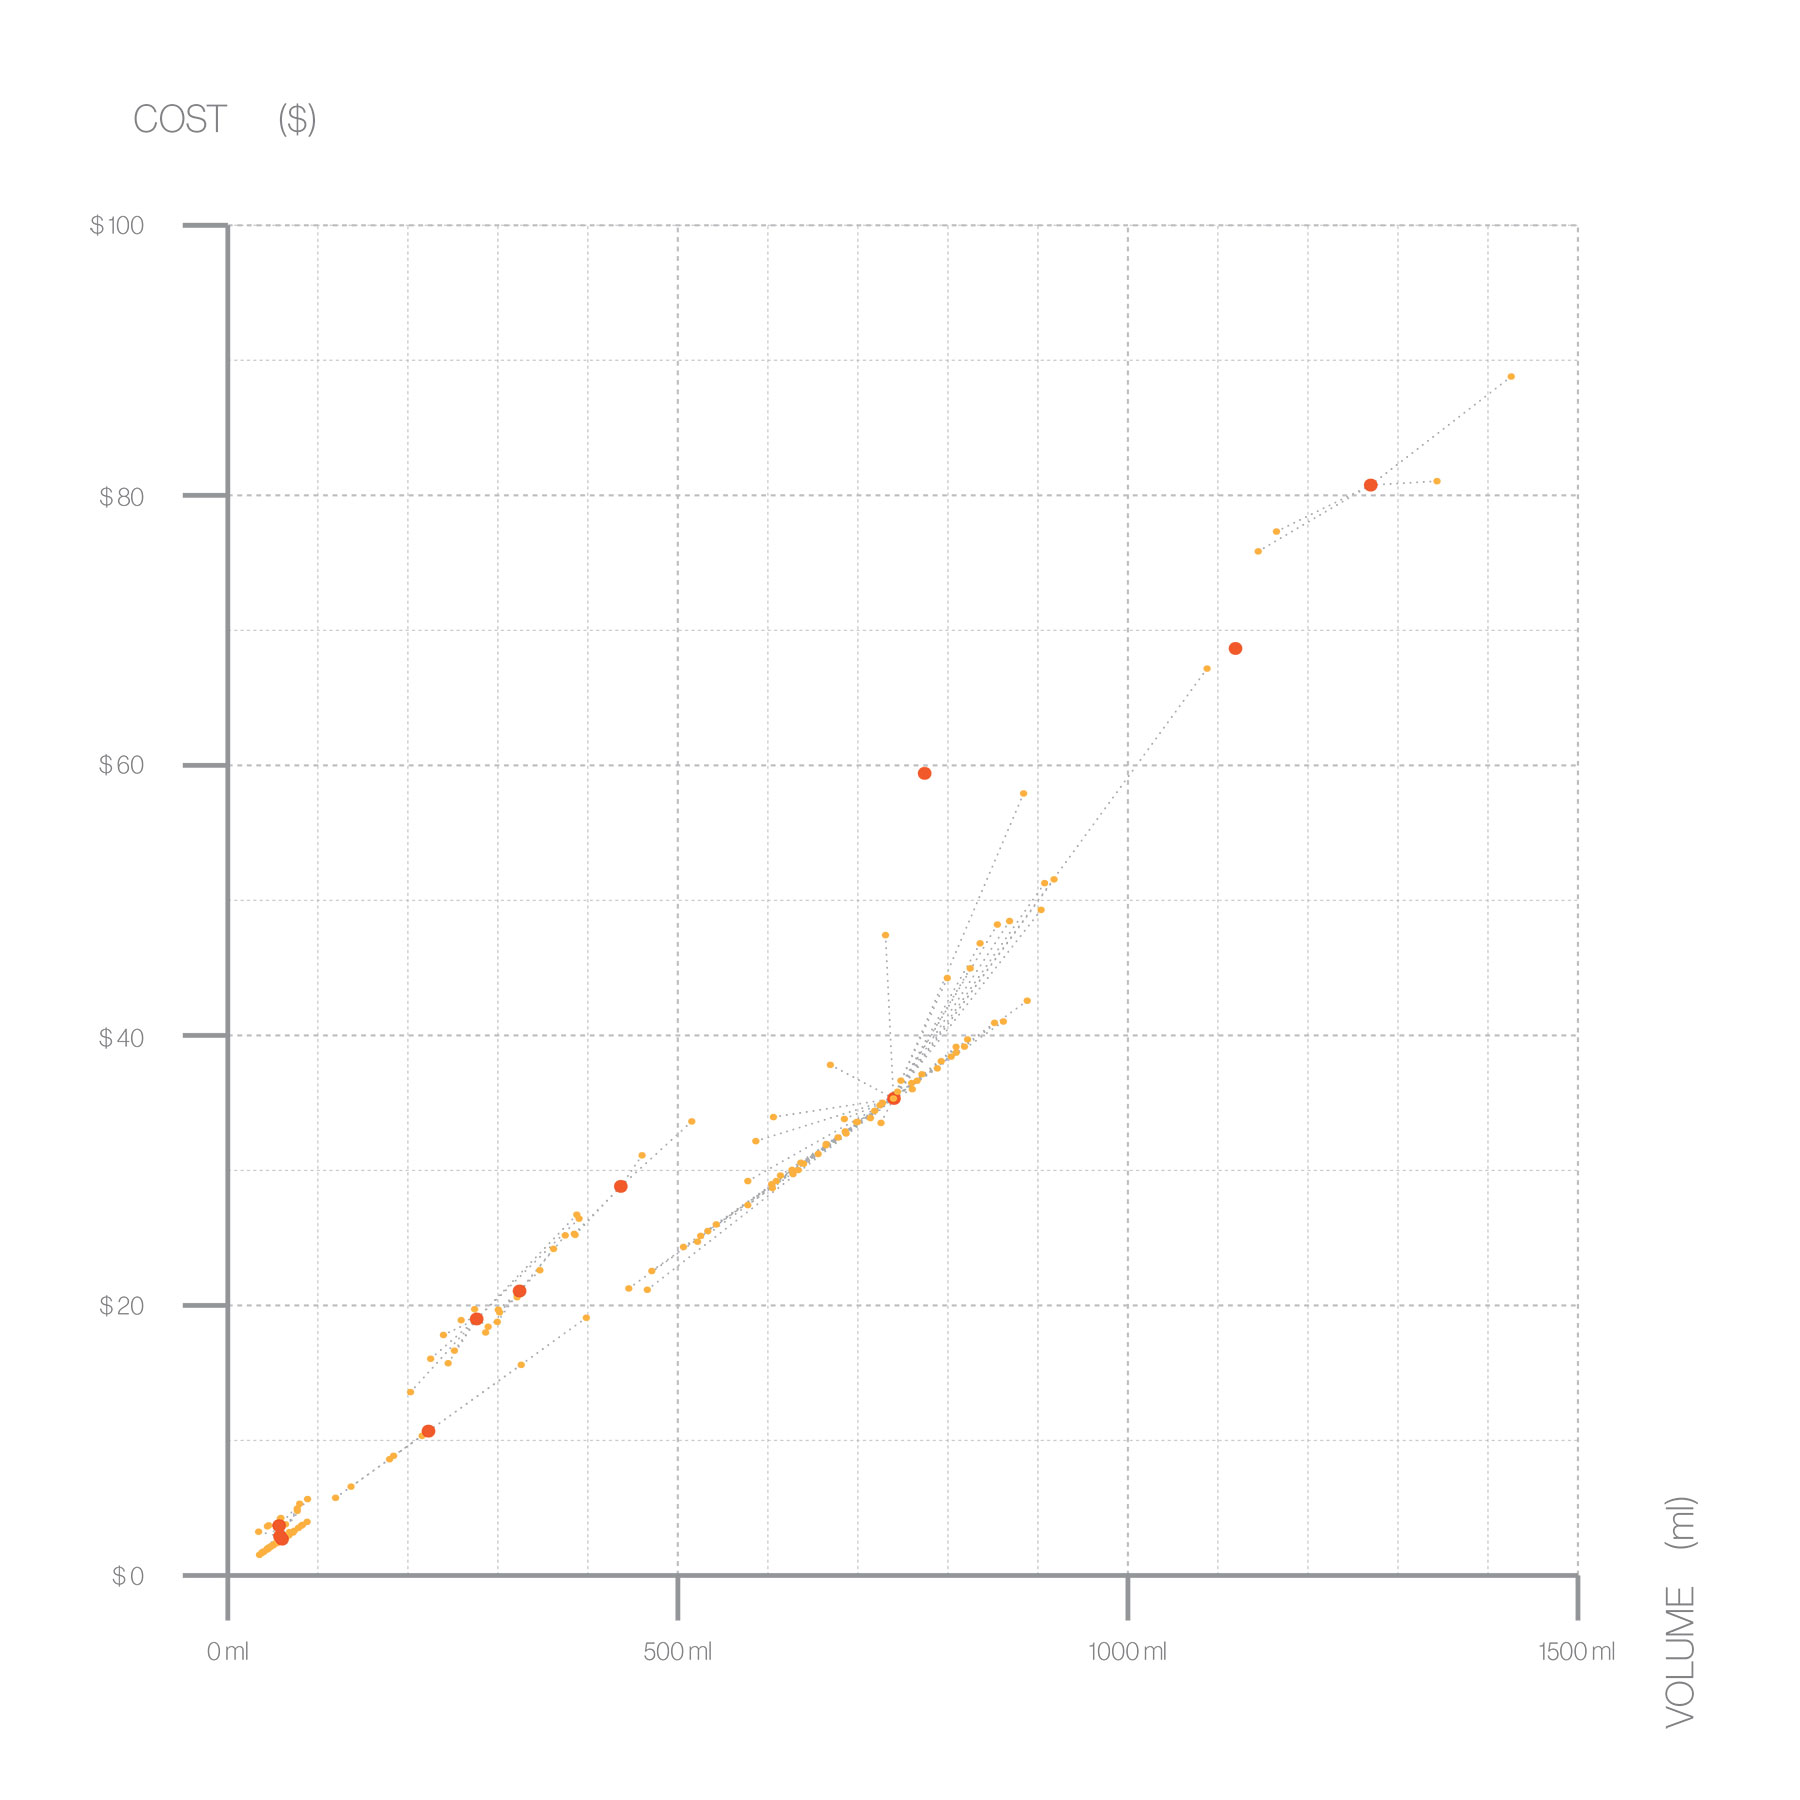

Figure VII: Charts depicting relative distribution of material amount, cost and printing time for 9 case studies.
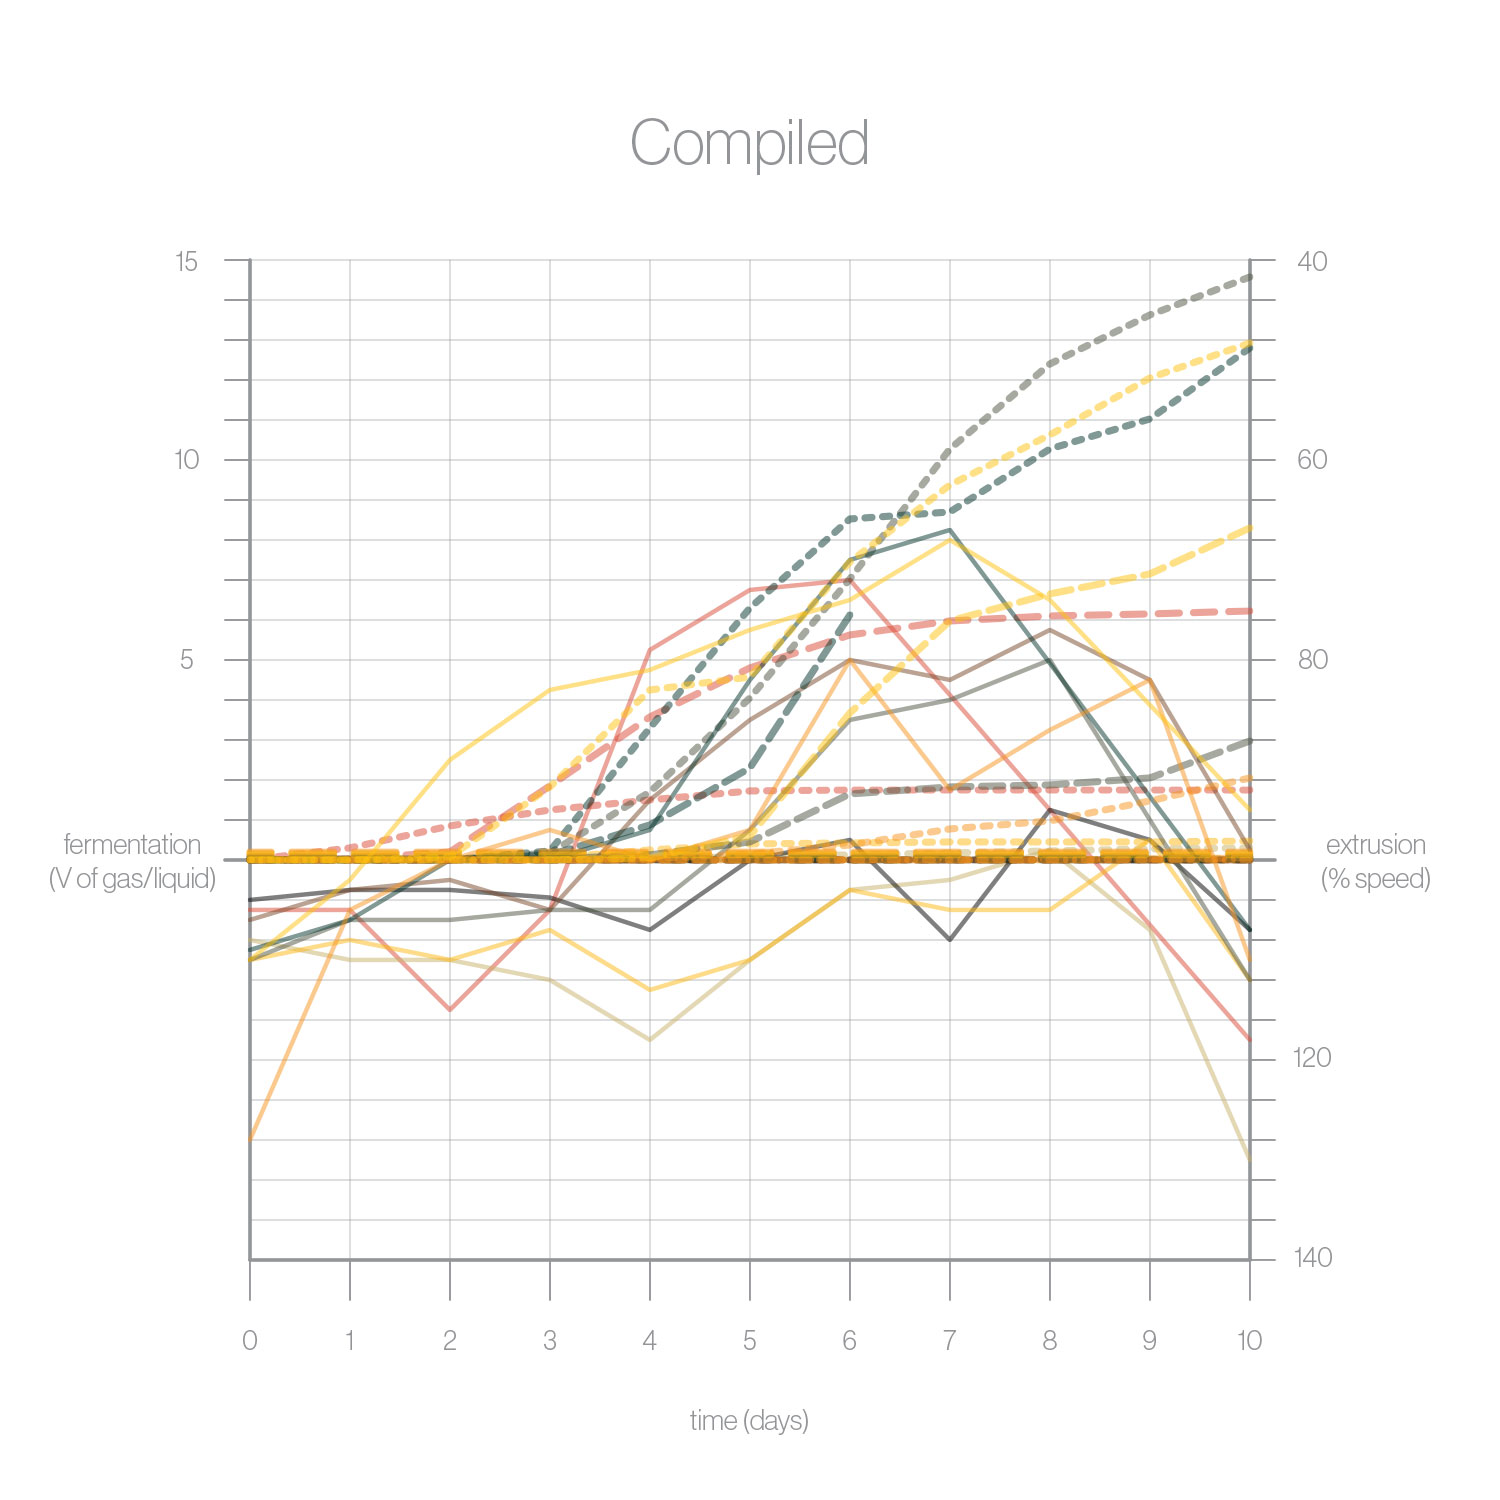

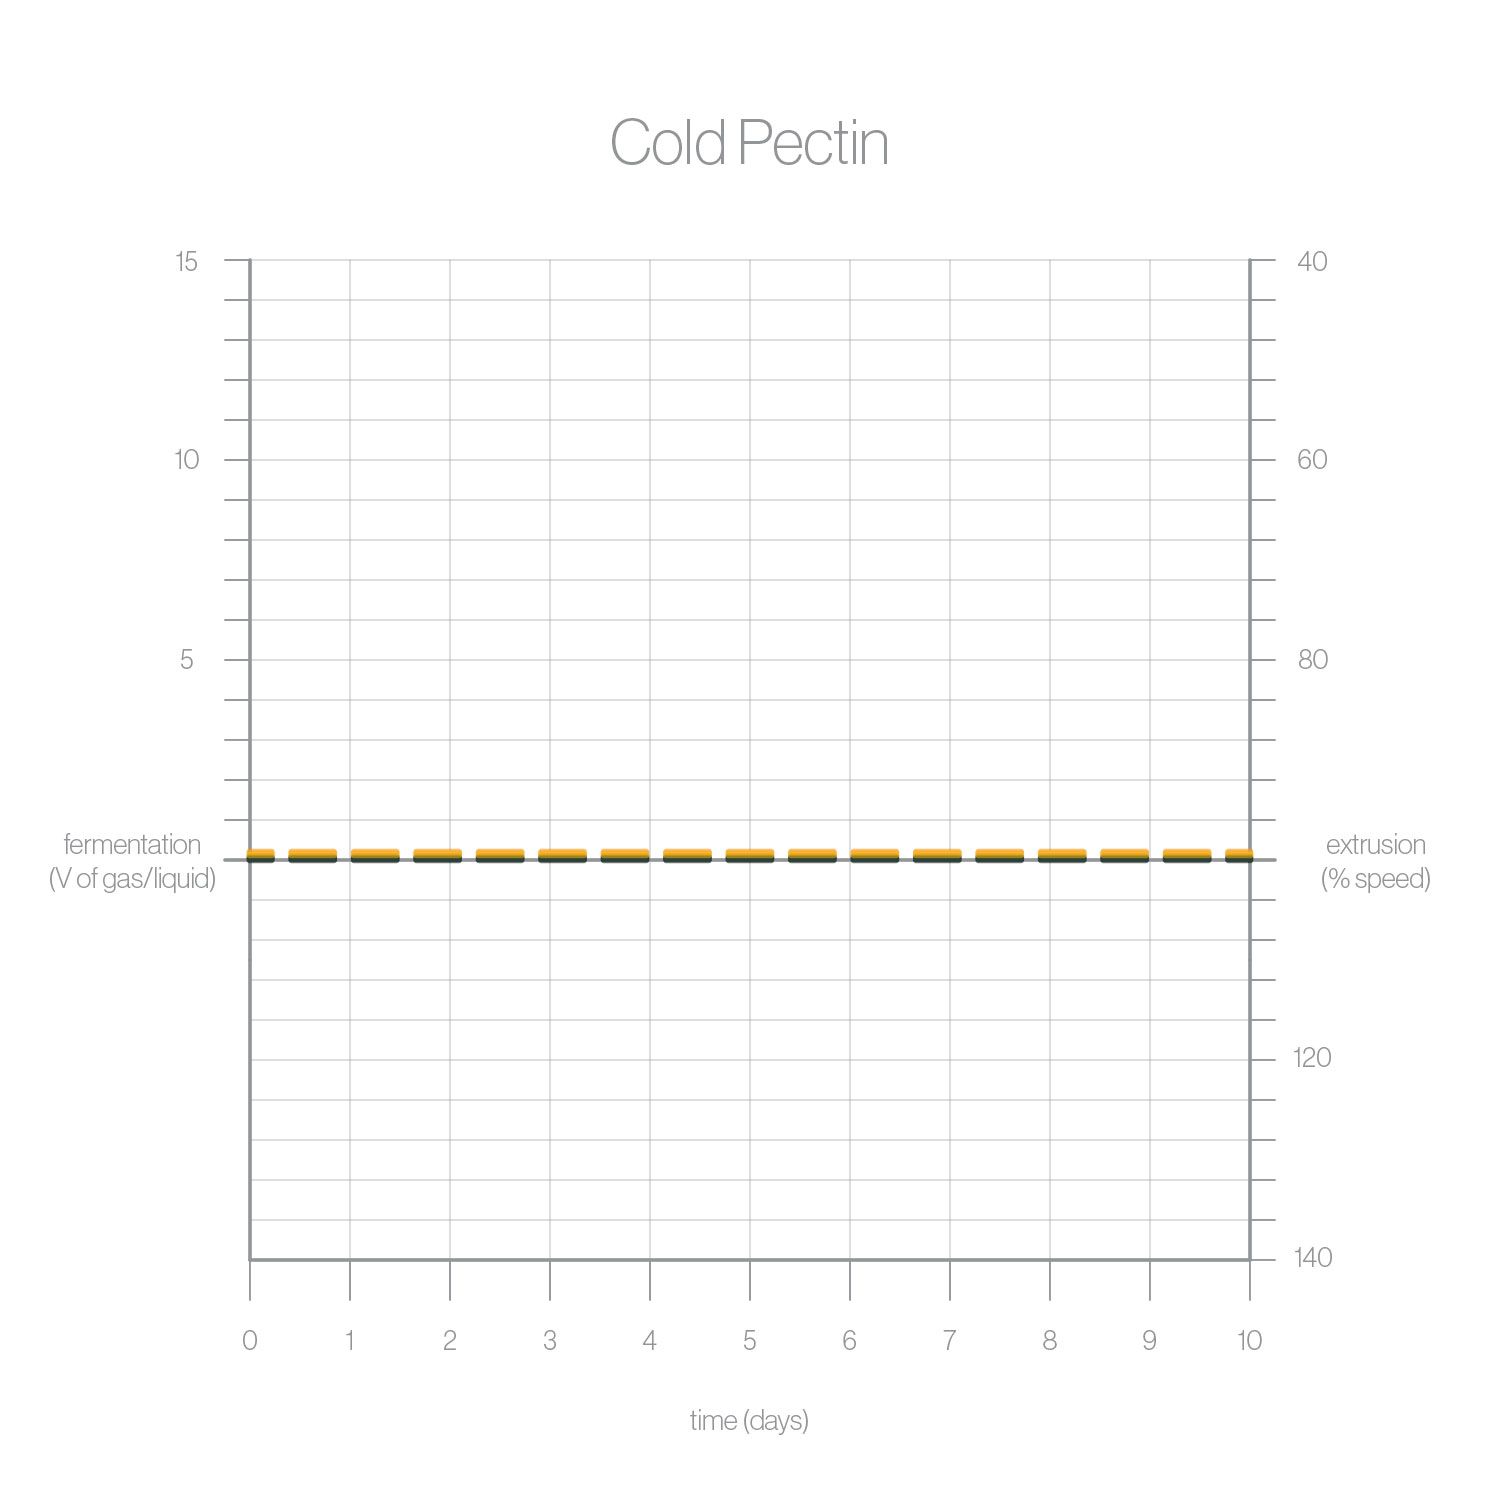
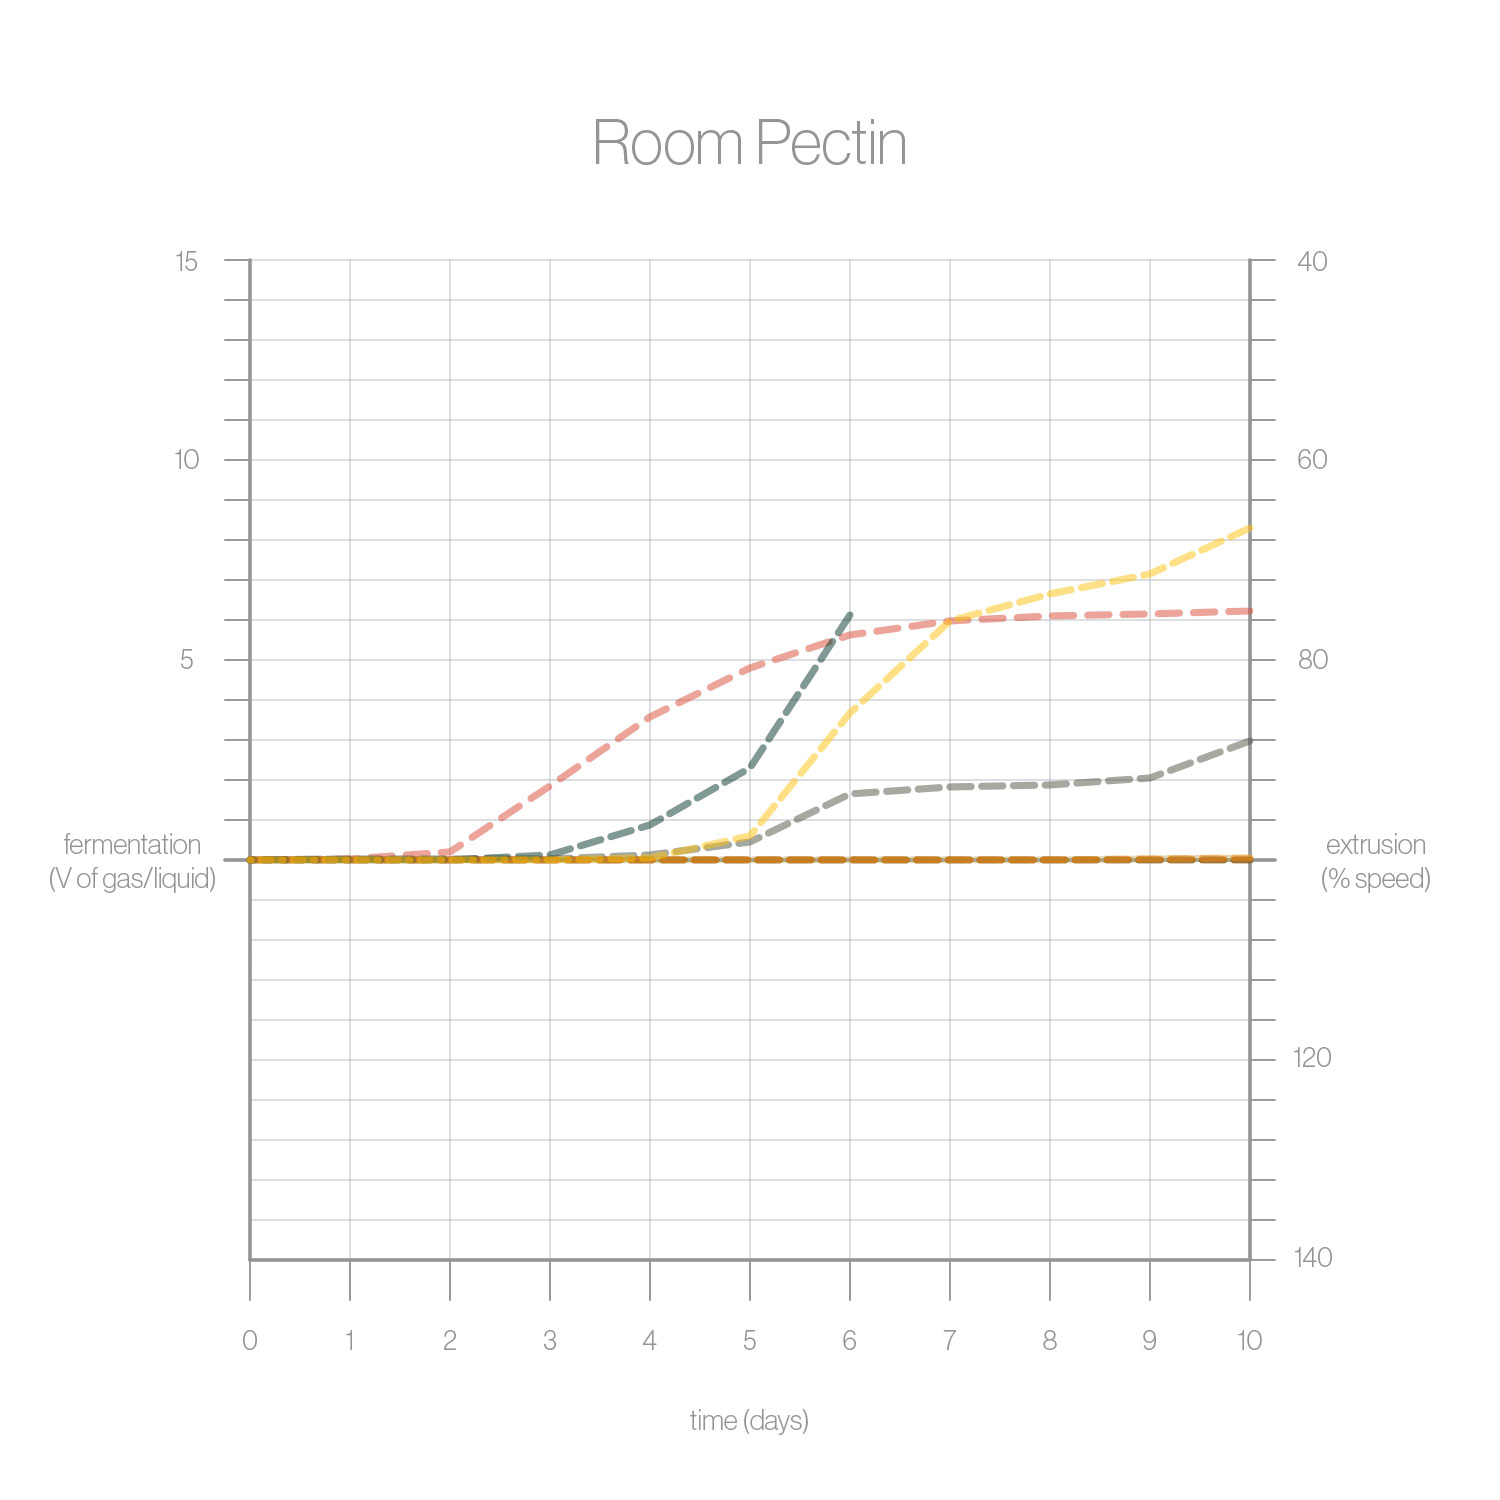
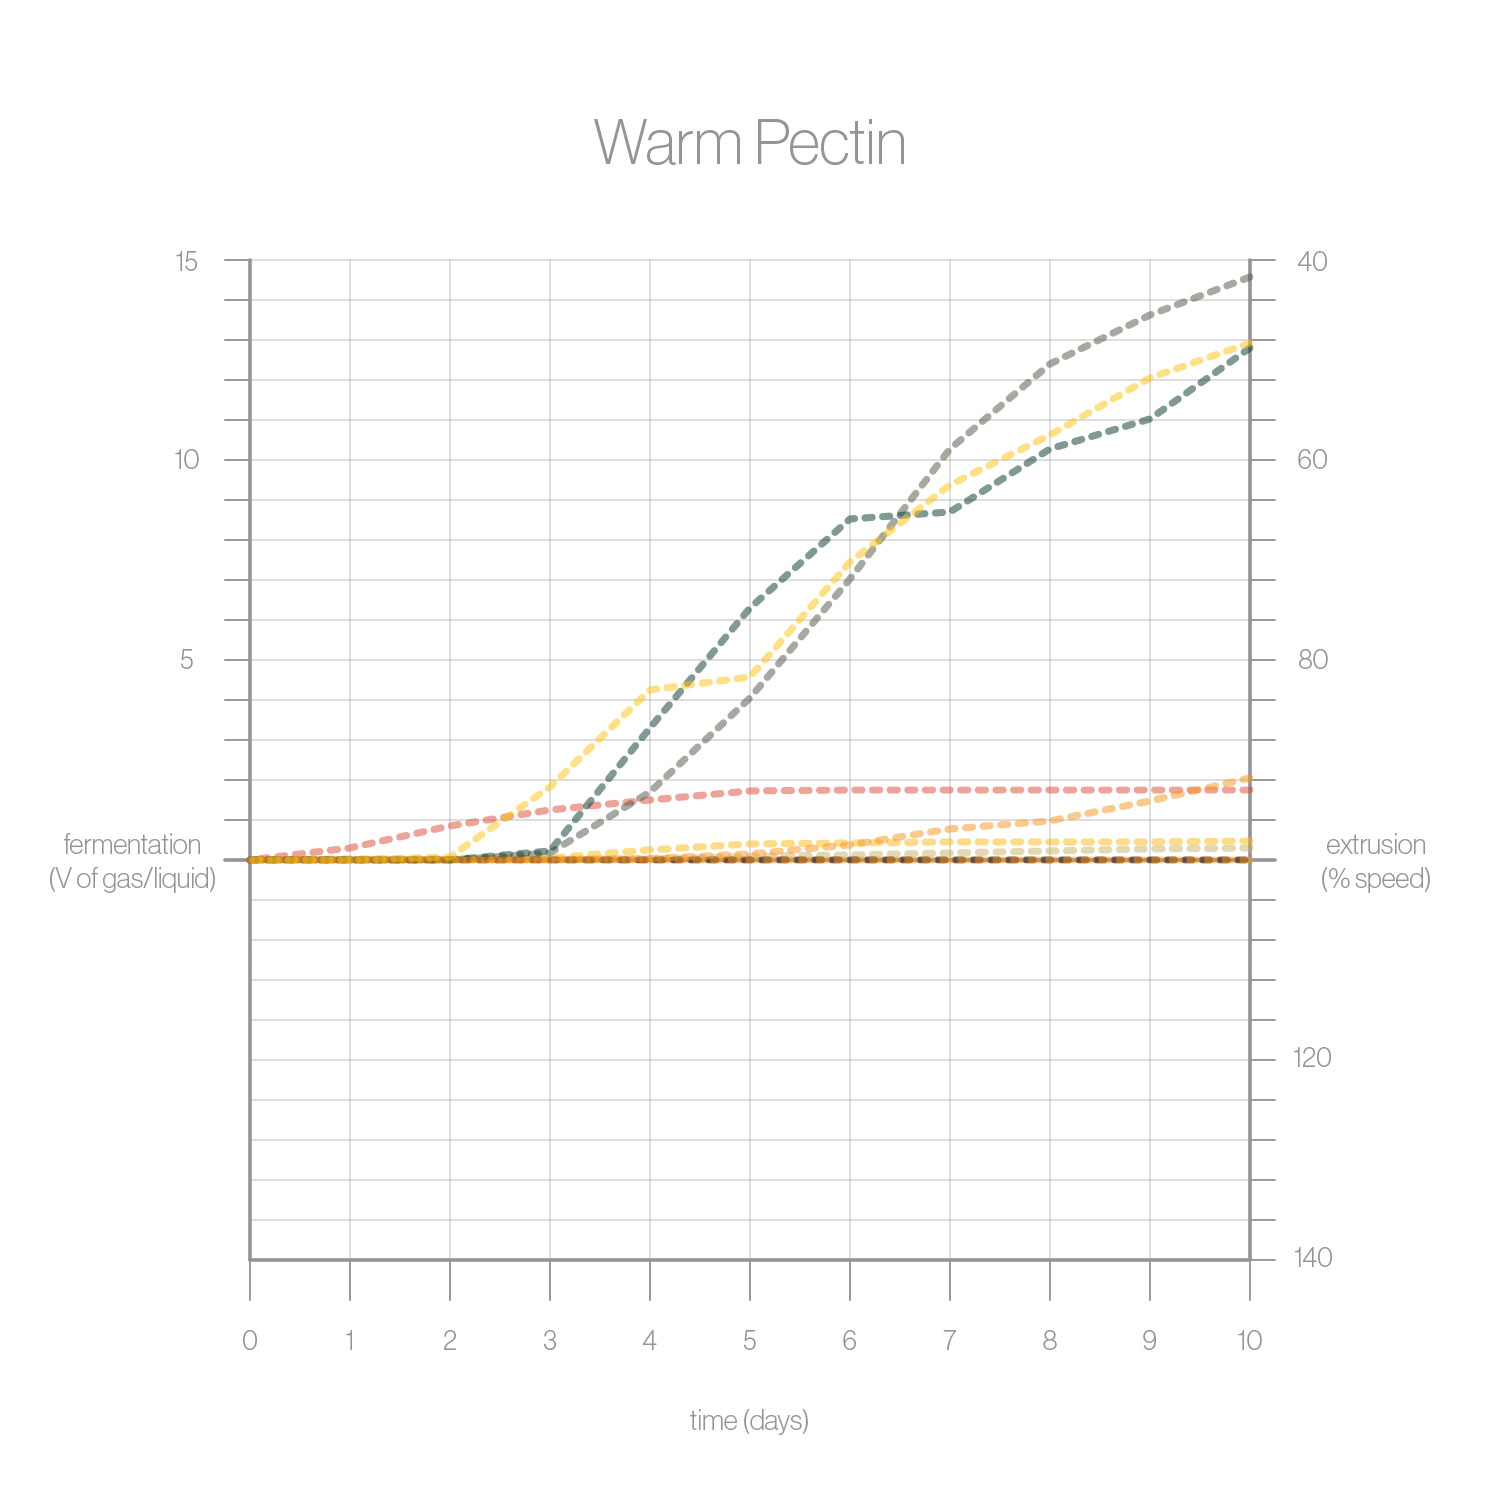
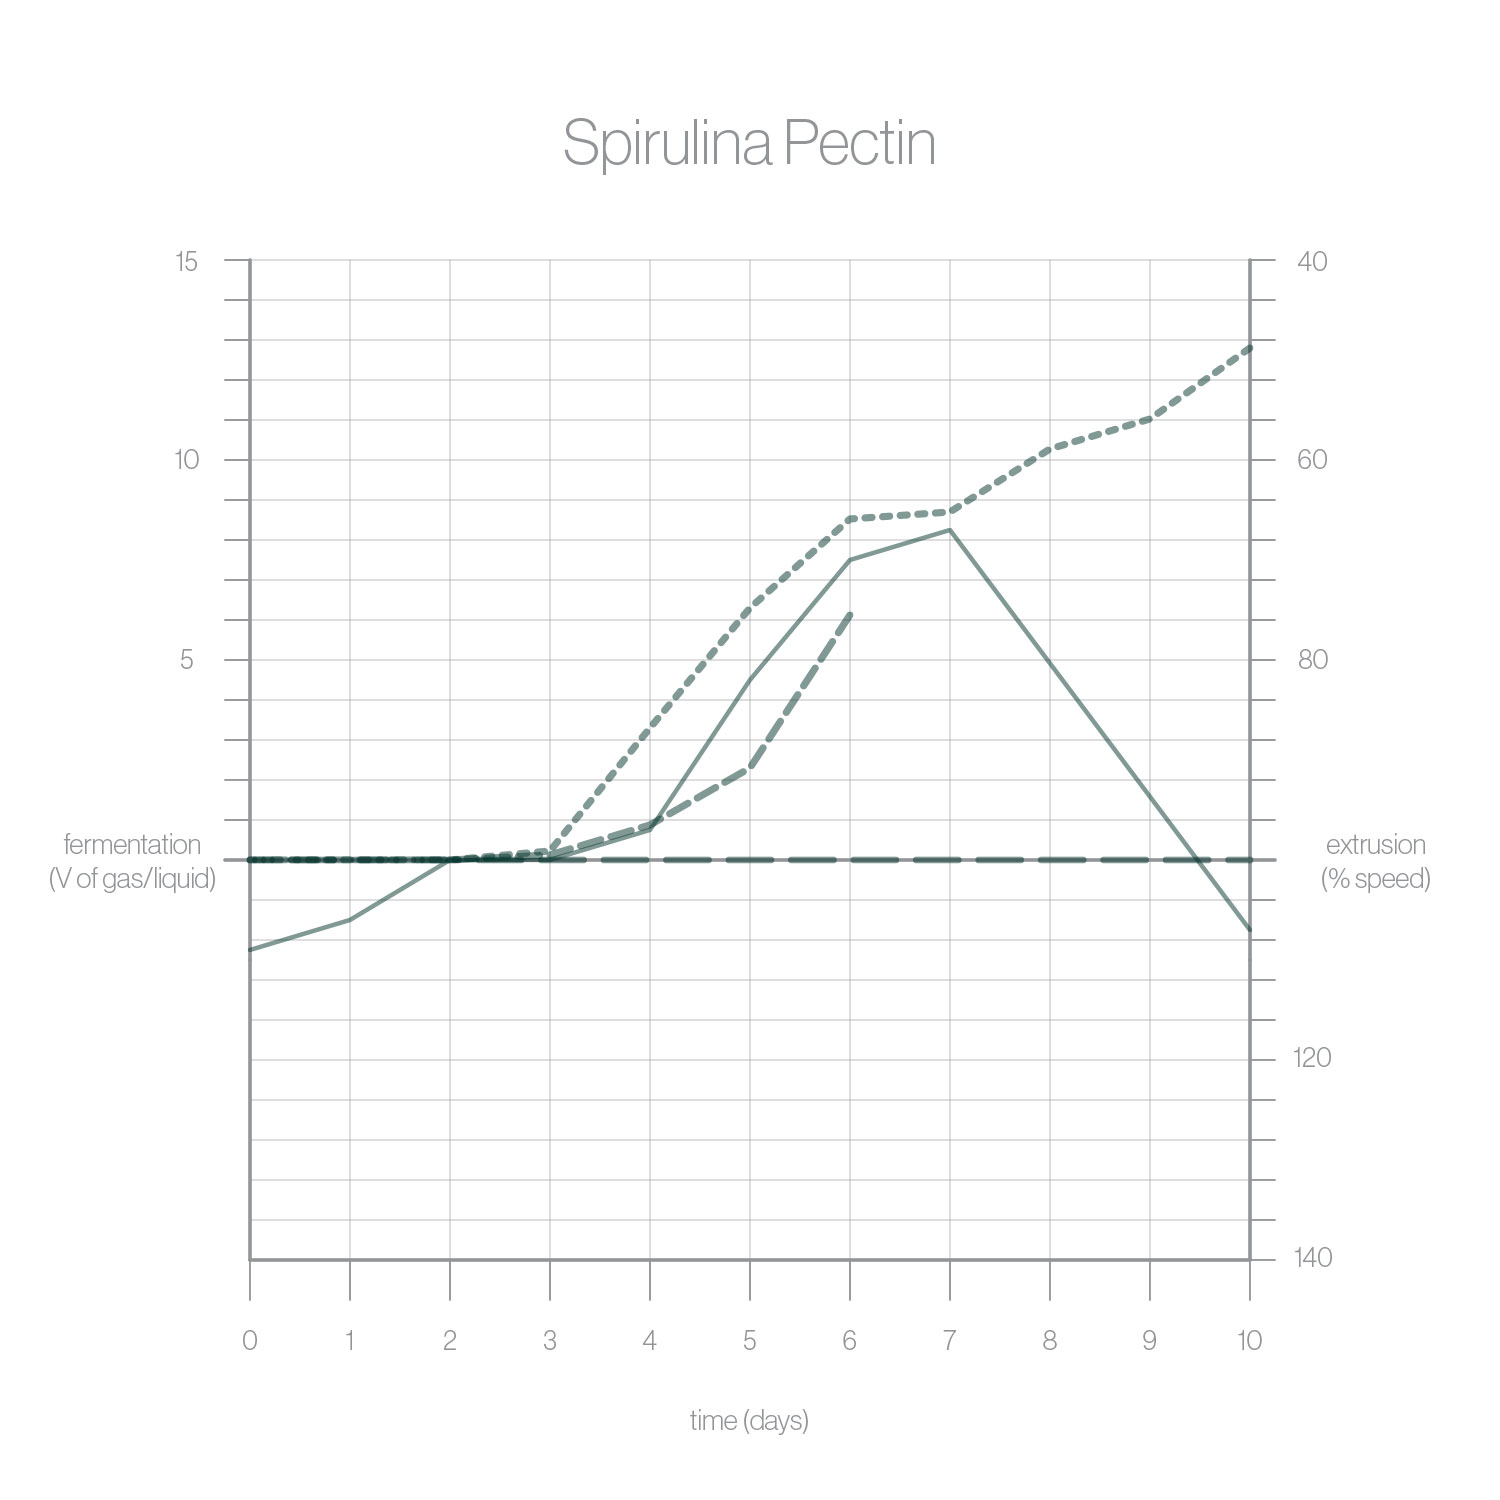

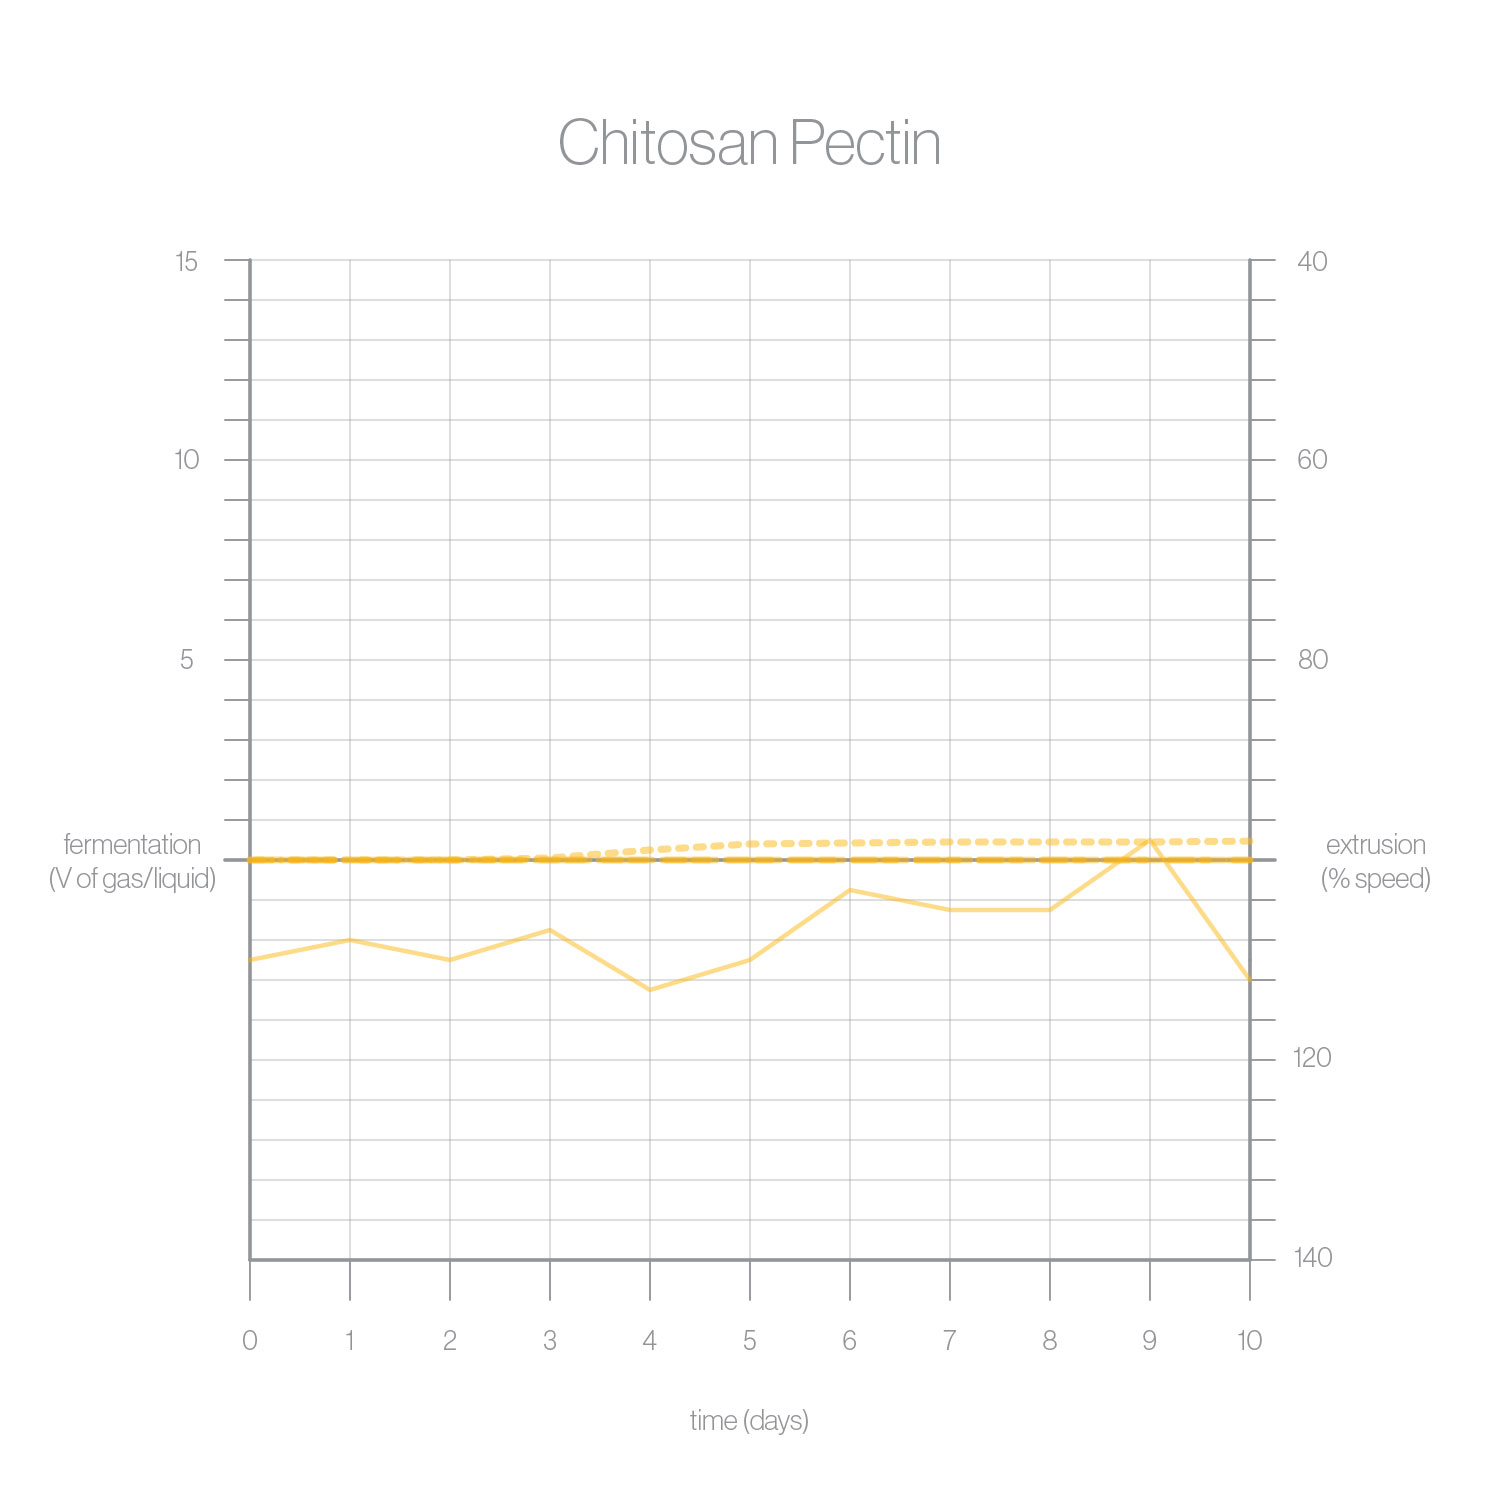
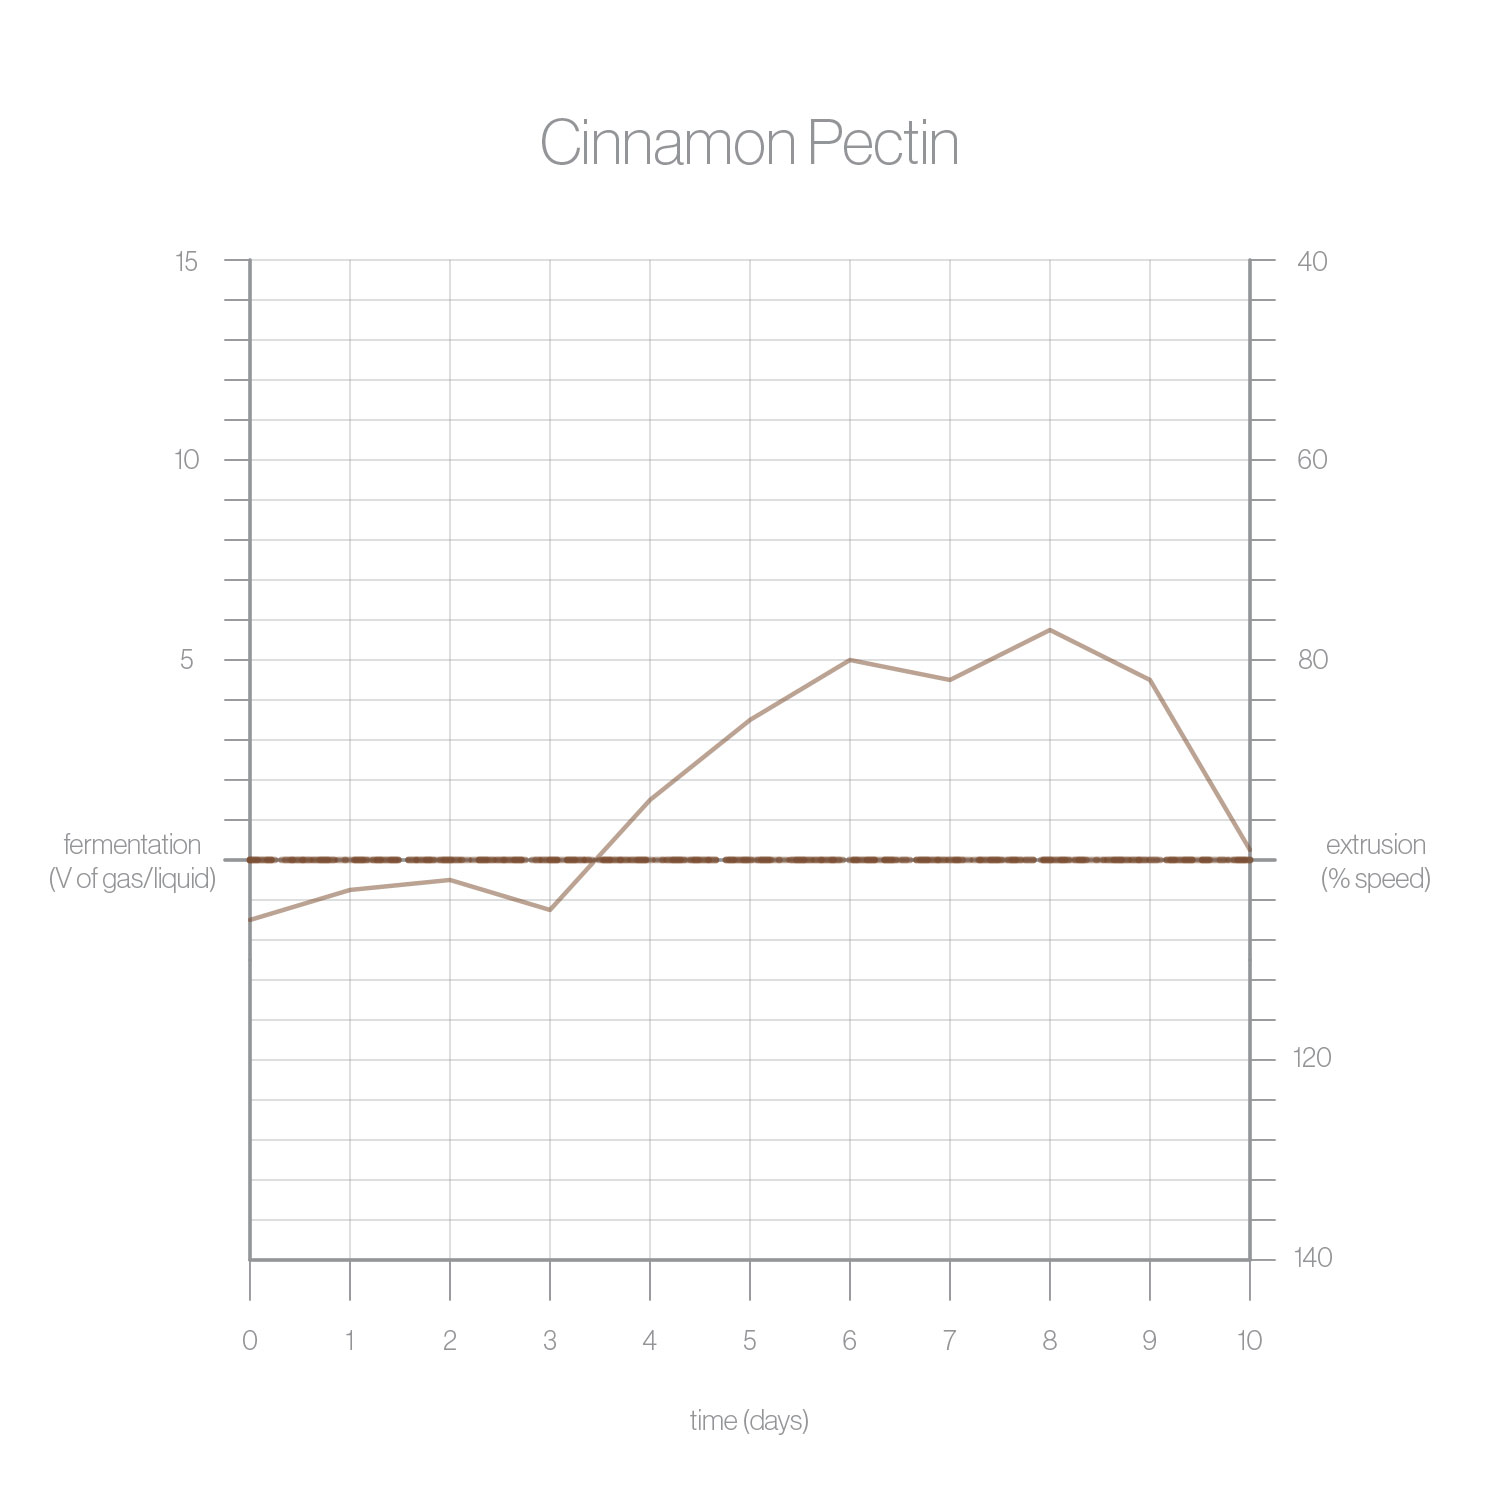

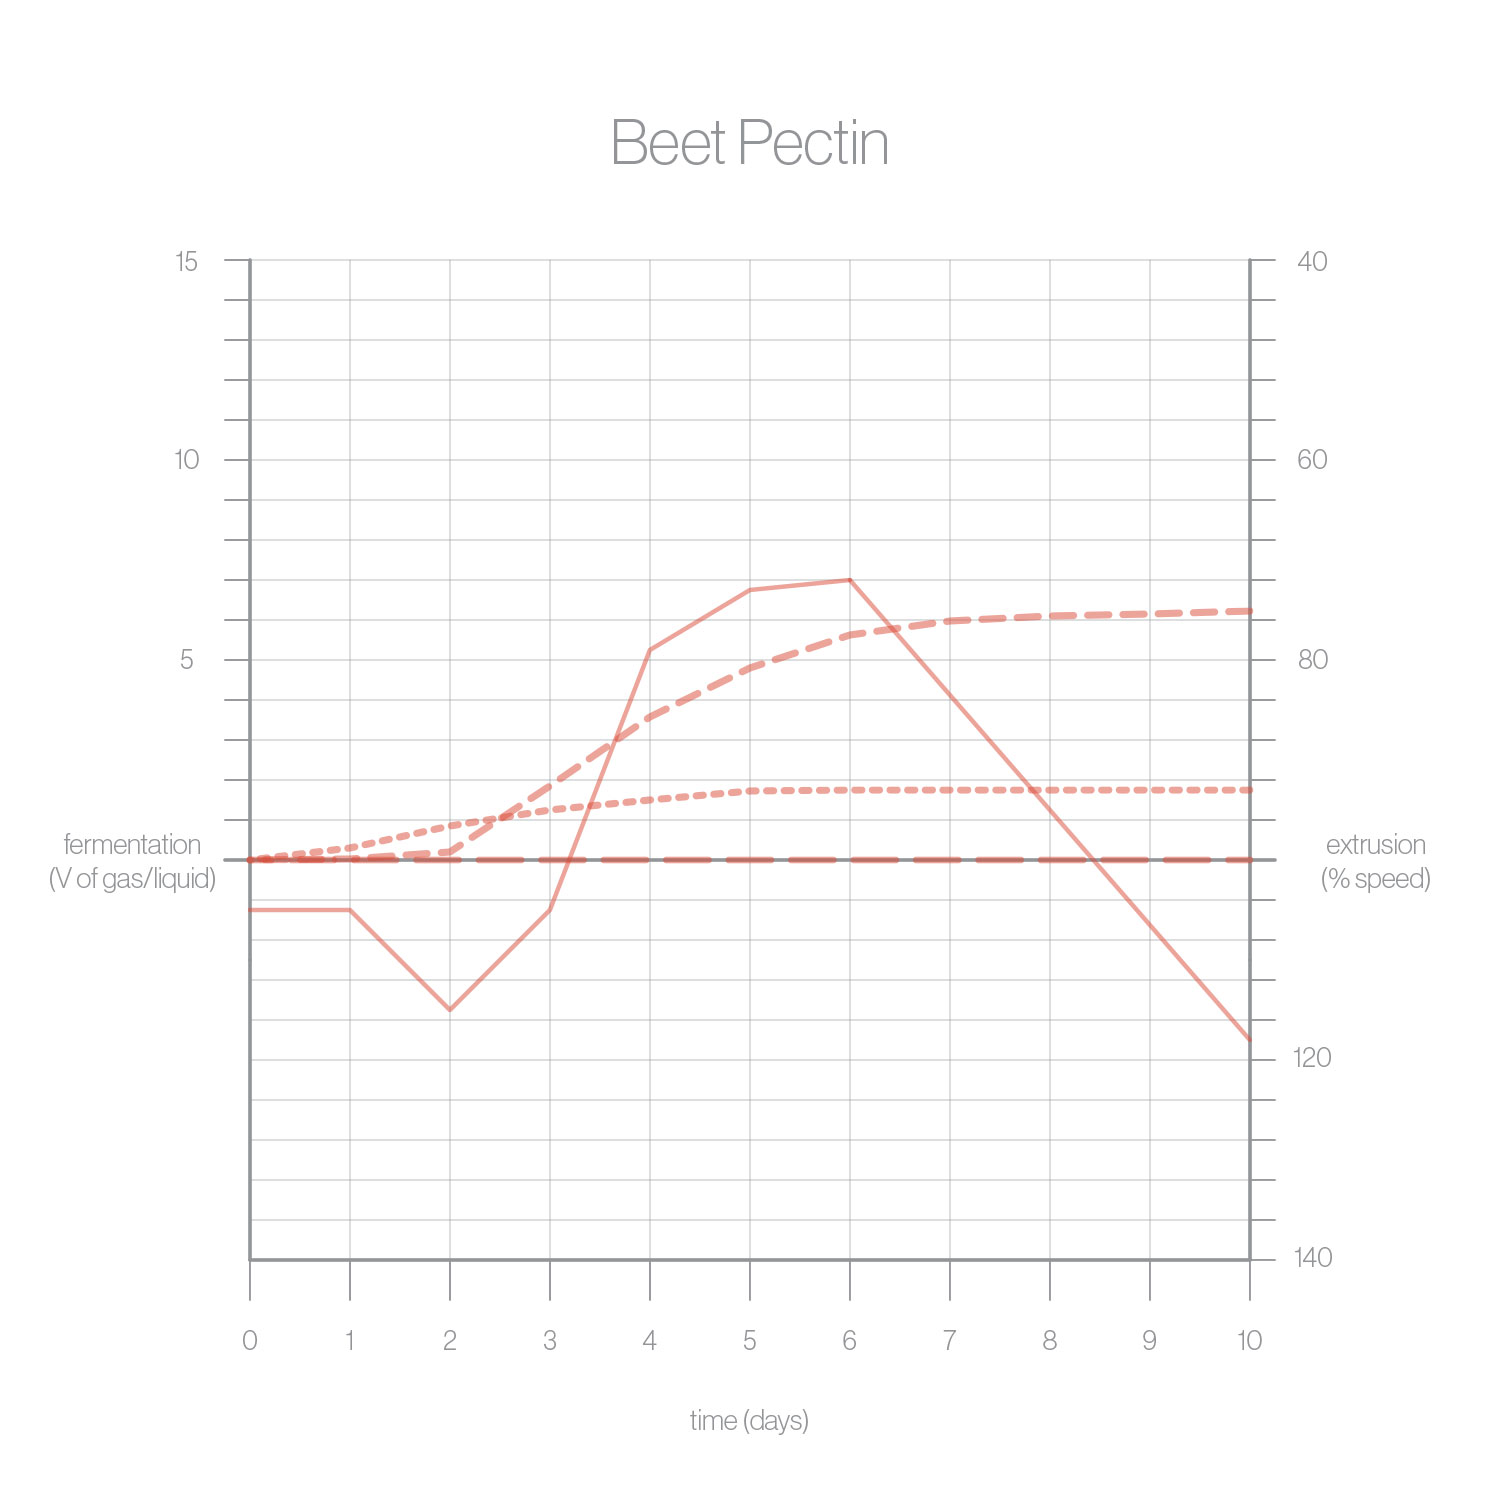
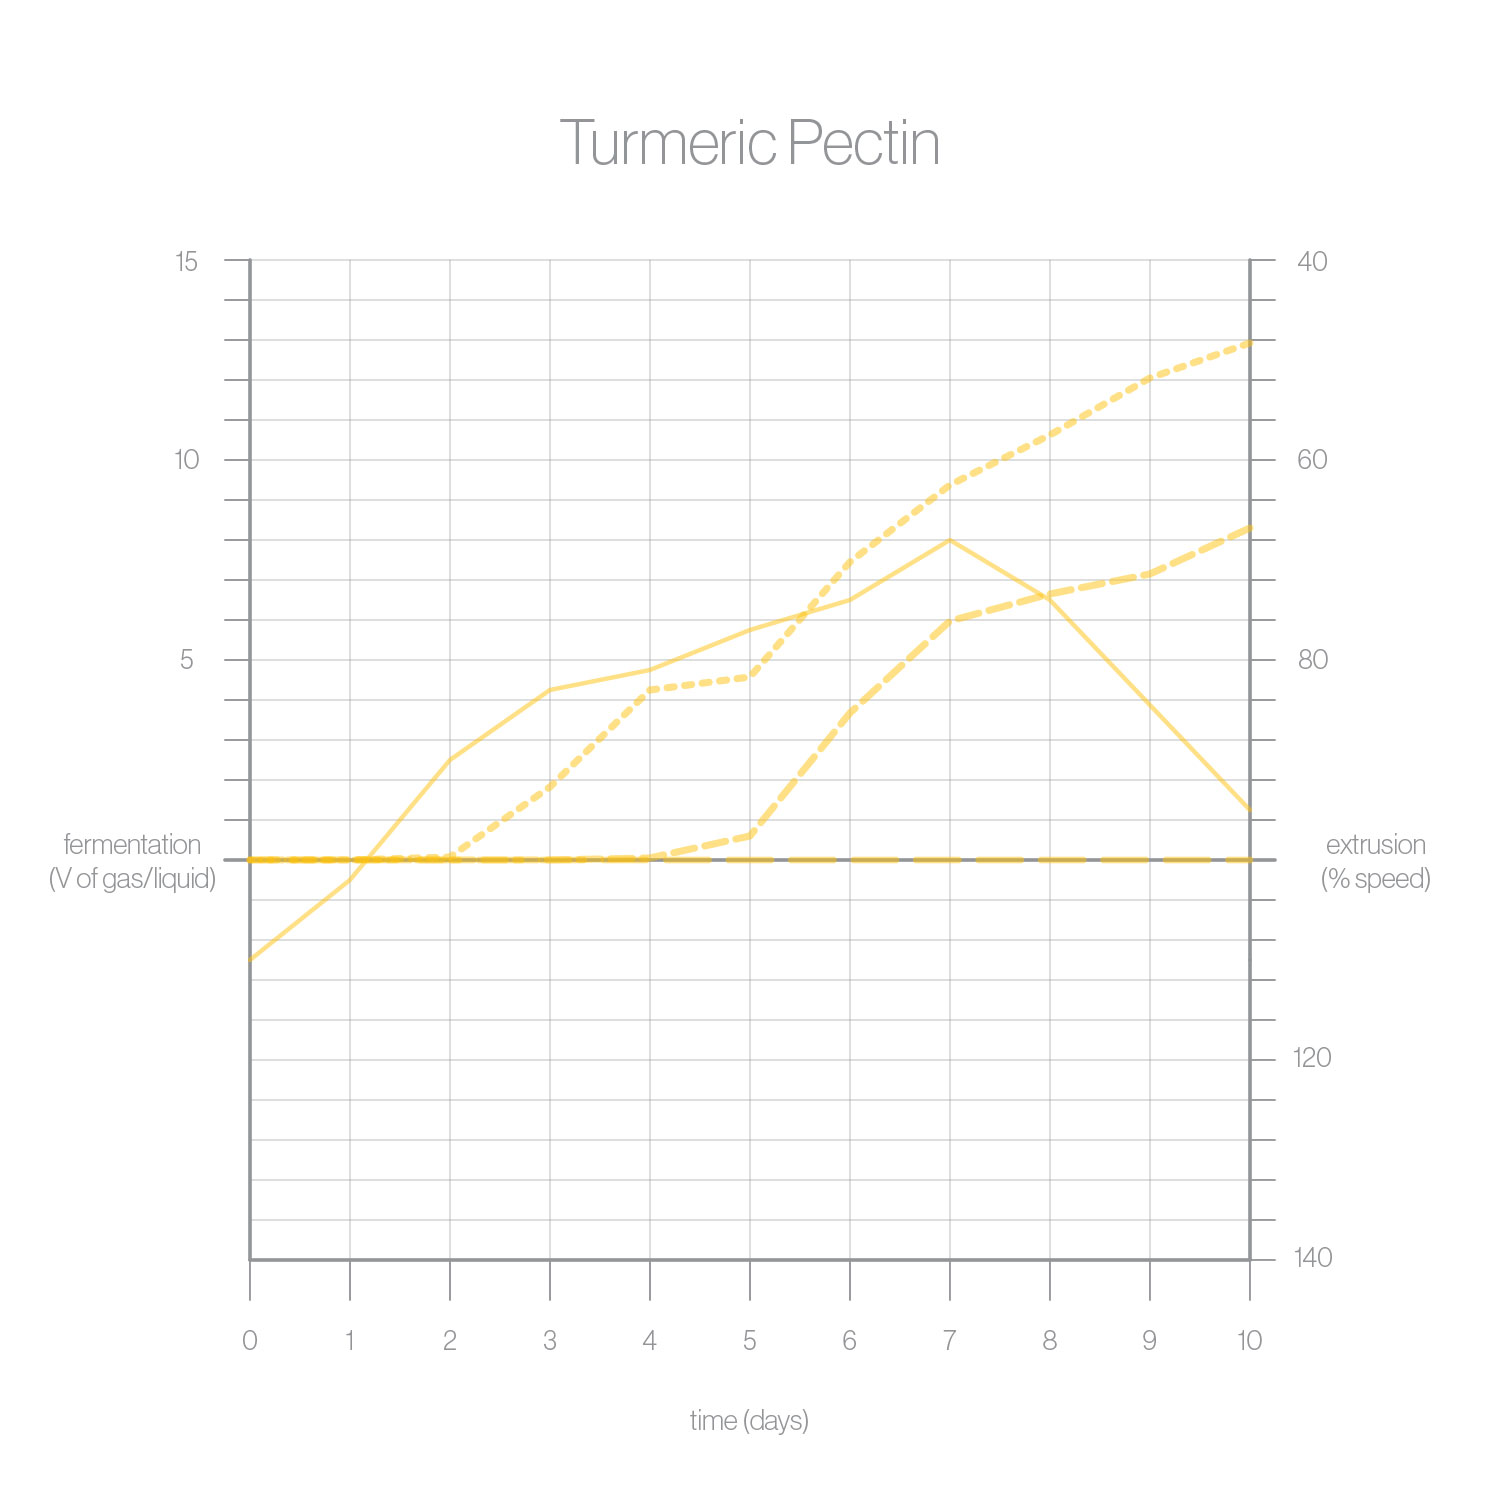
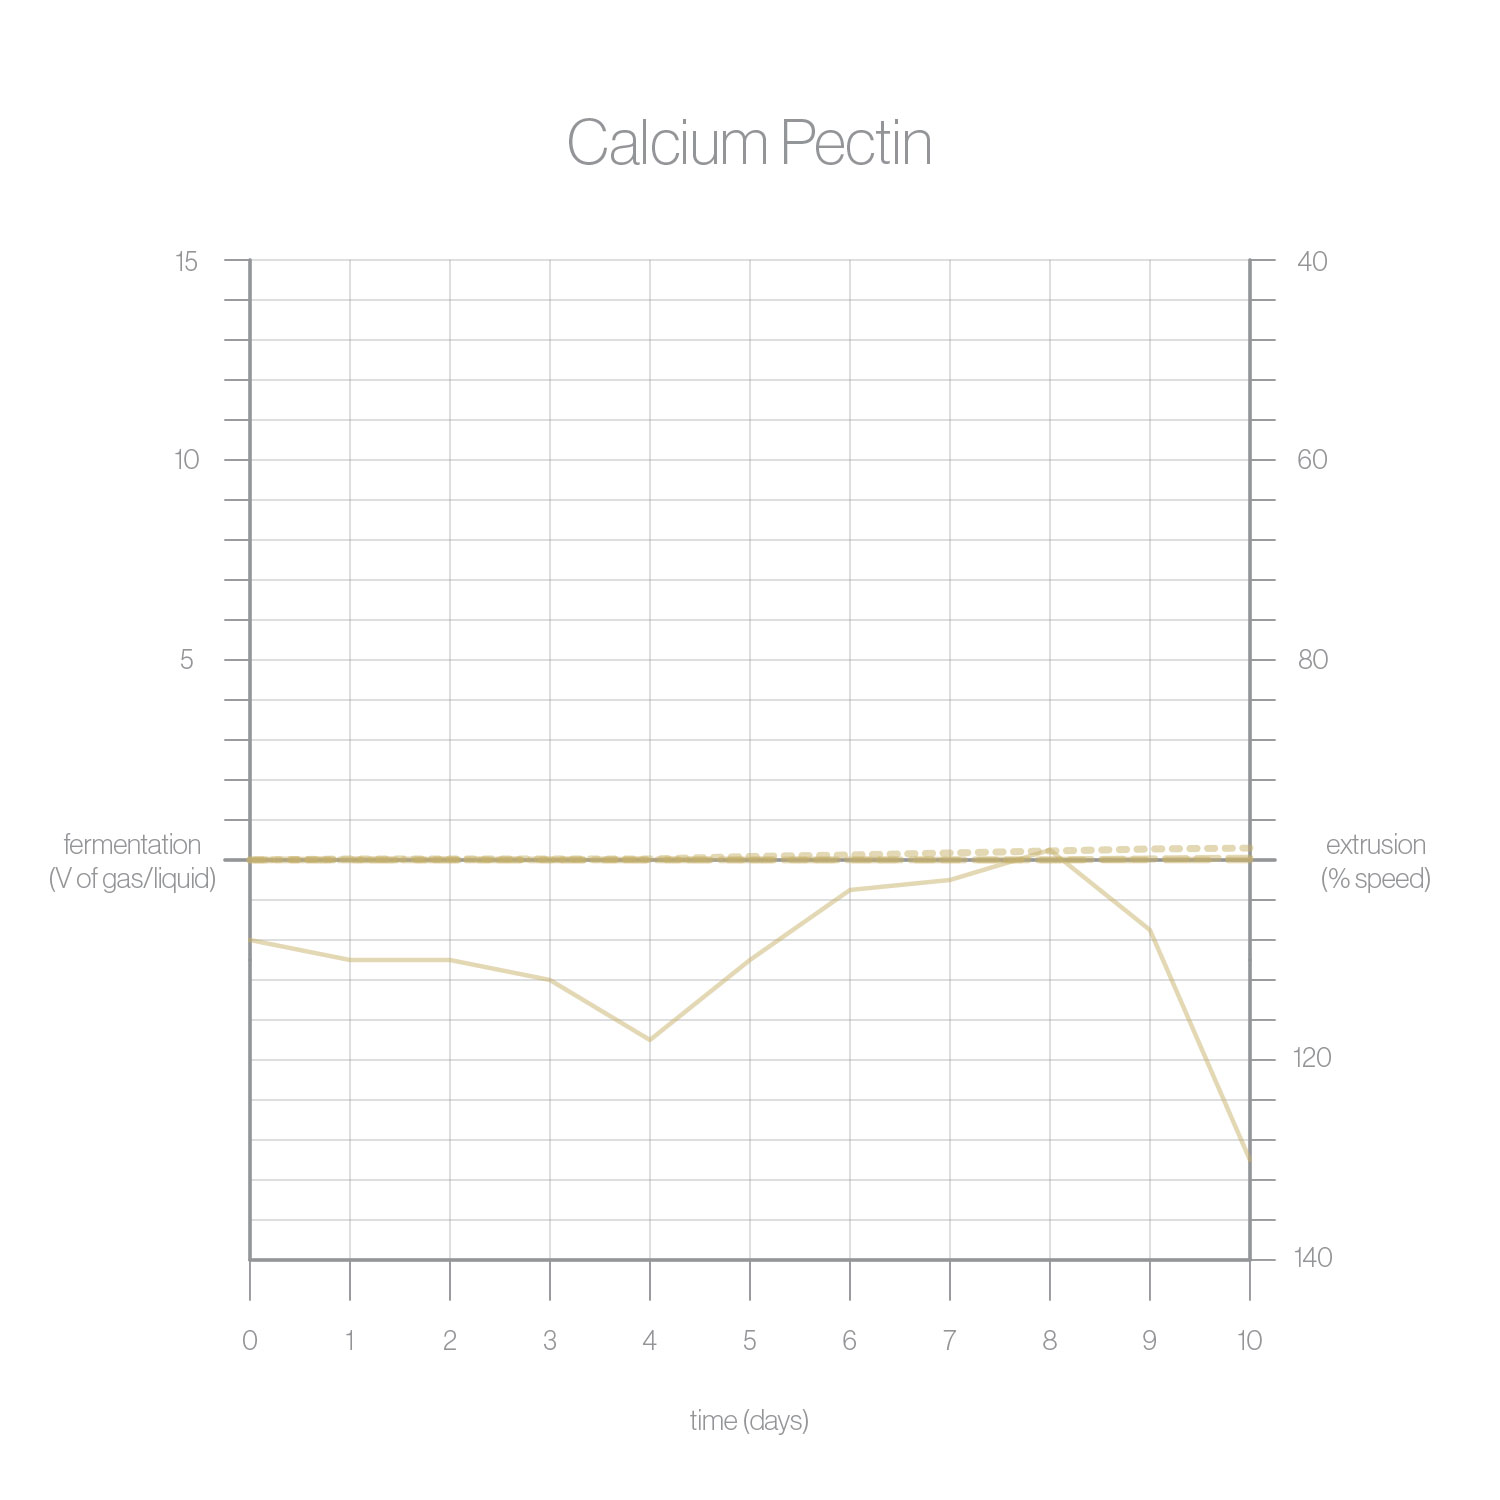
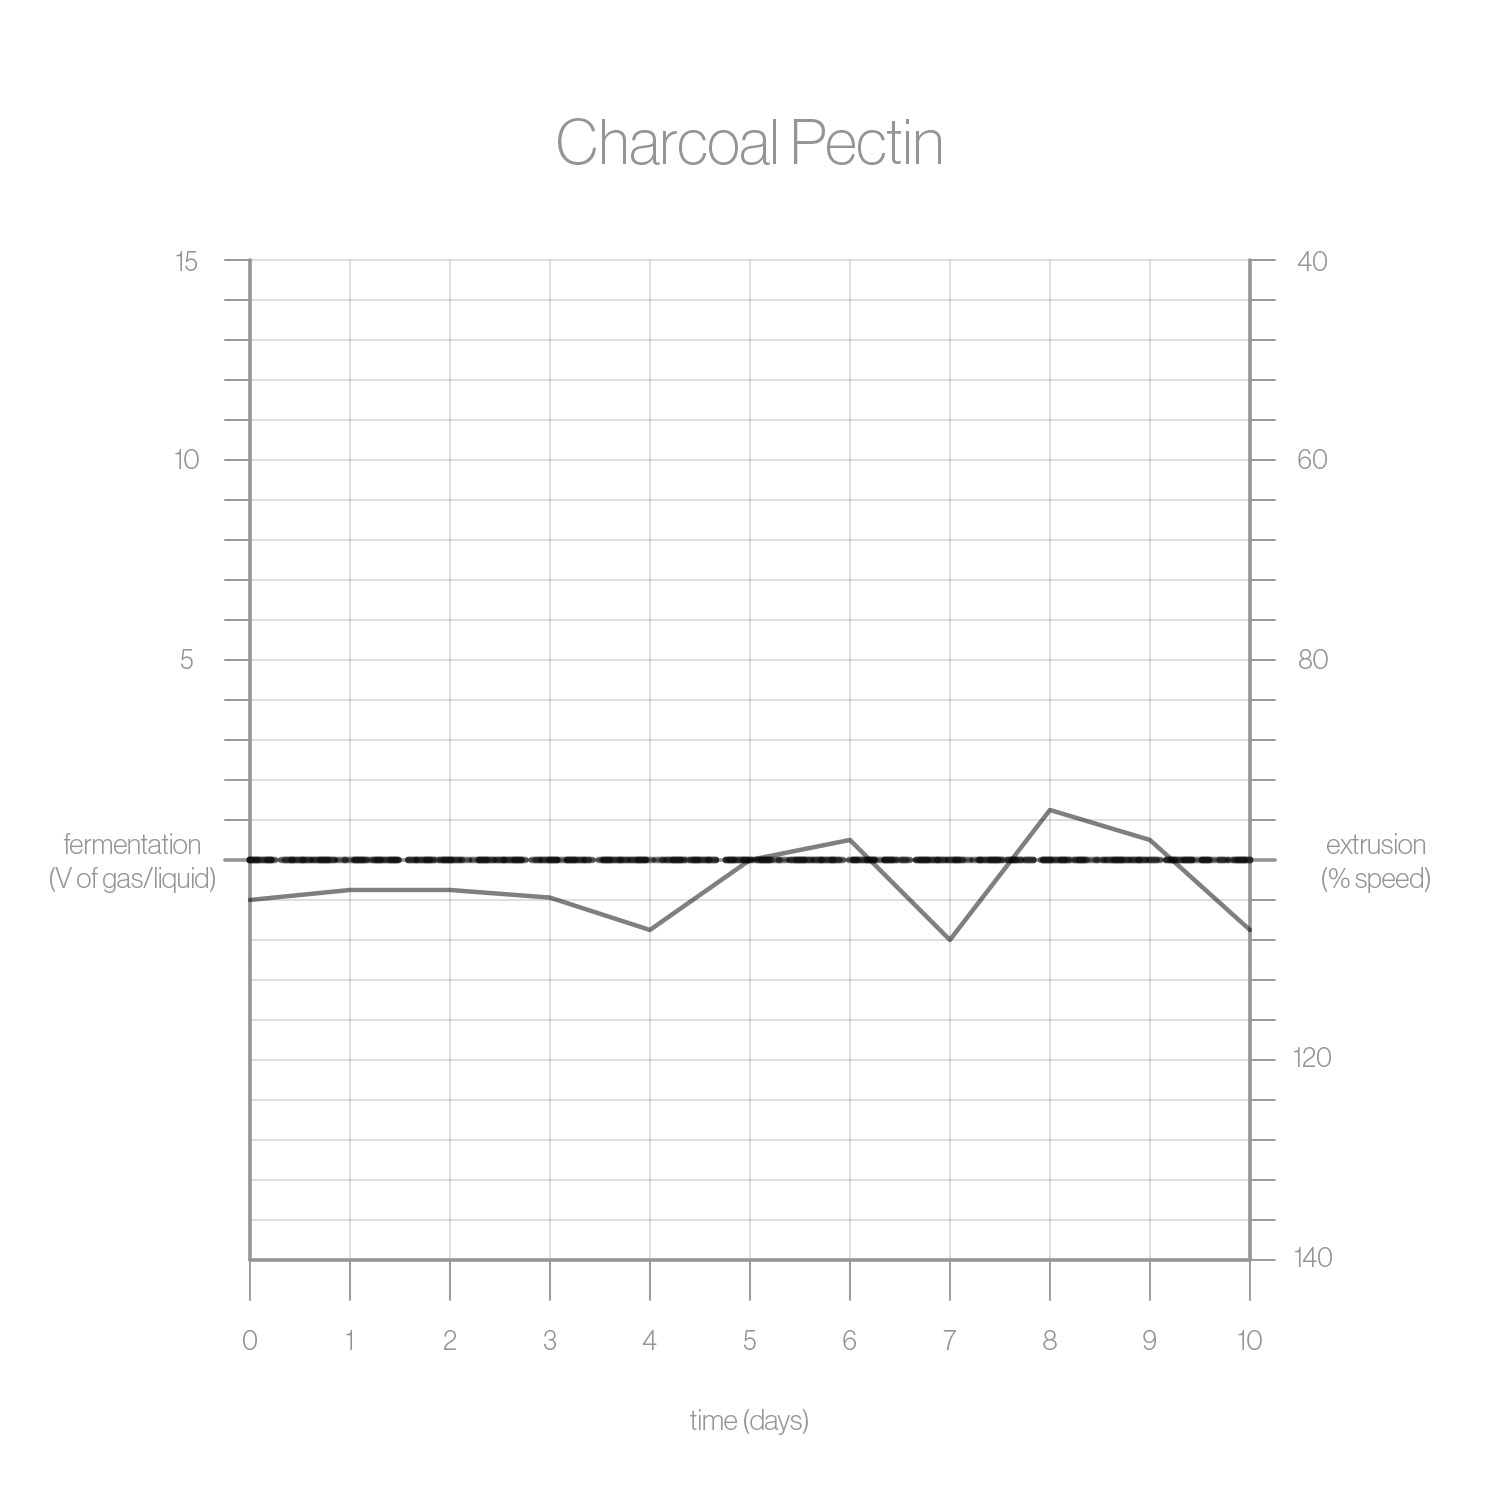
Figure VIII: Correlation between fermentation rates and printing parameters in warm, cold and room temperature (left) and in various pectin formulas (right) by changing extrusion parameters over 10 days.


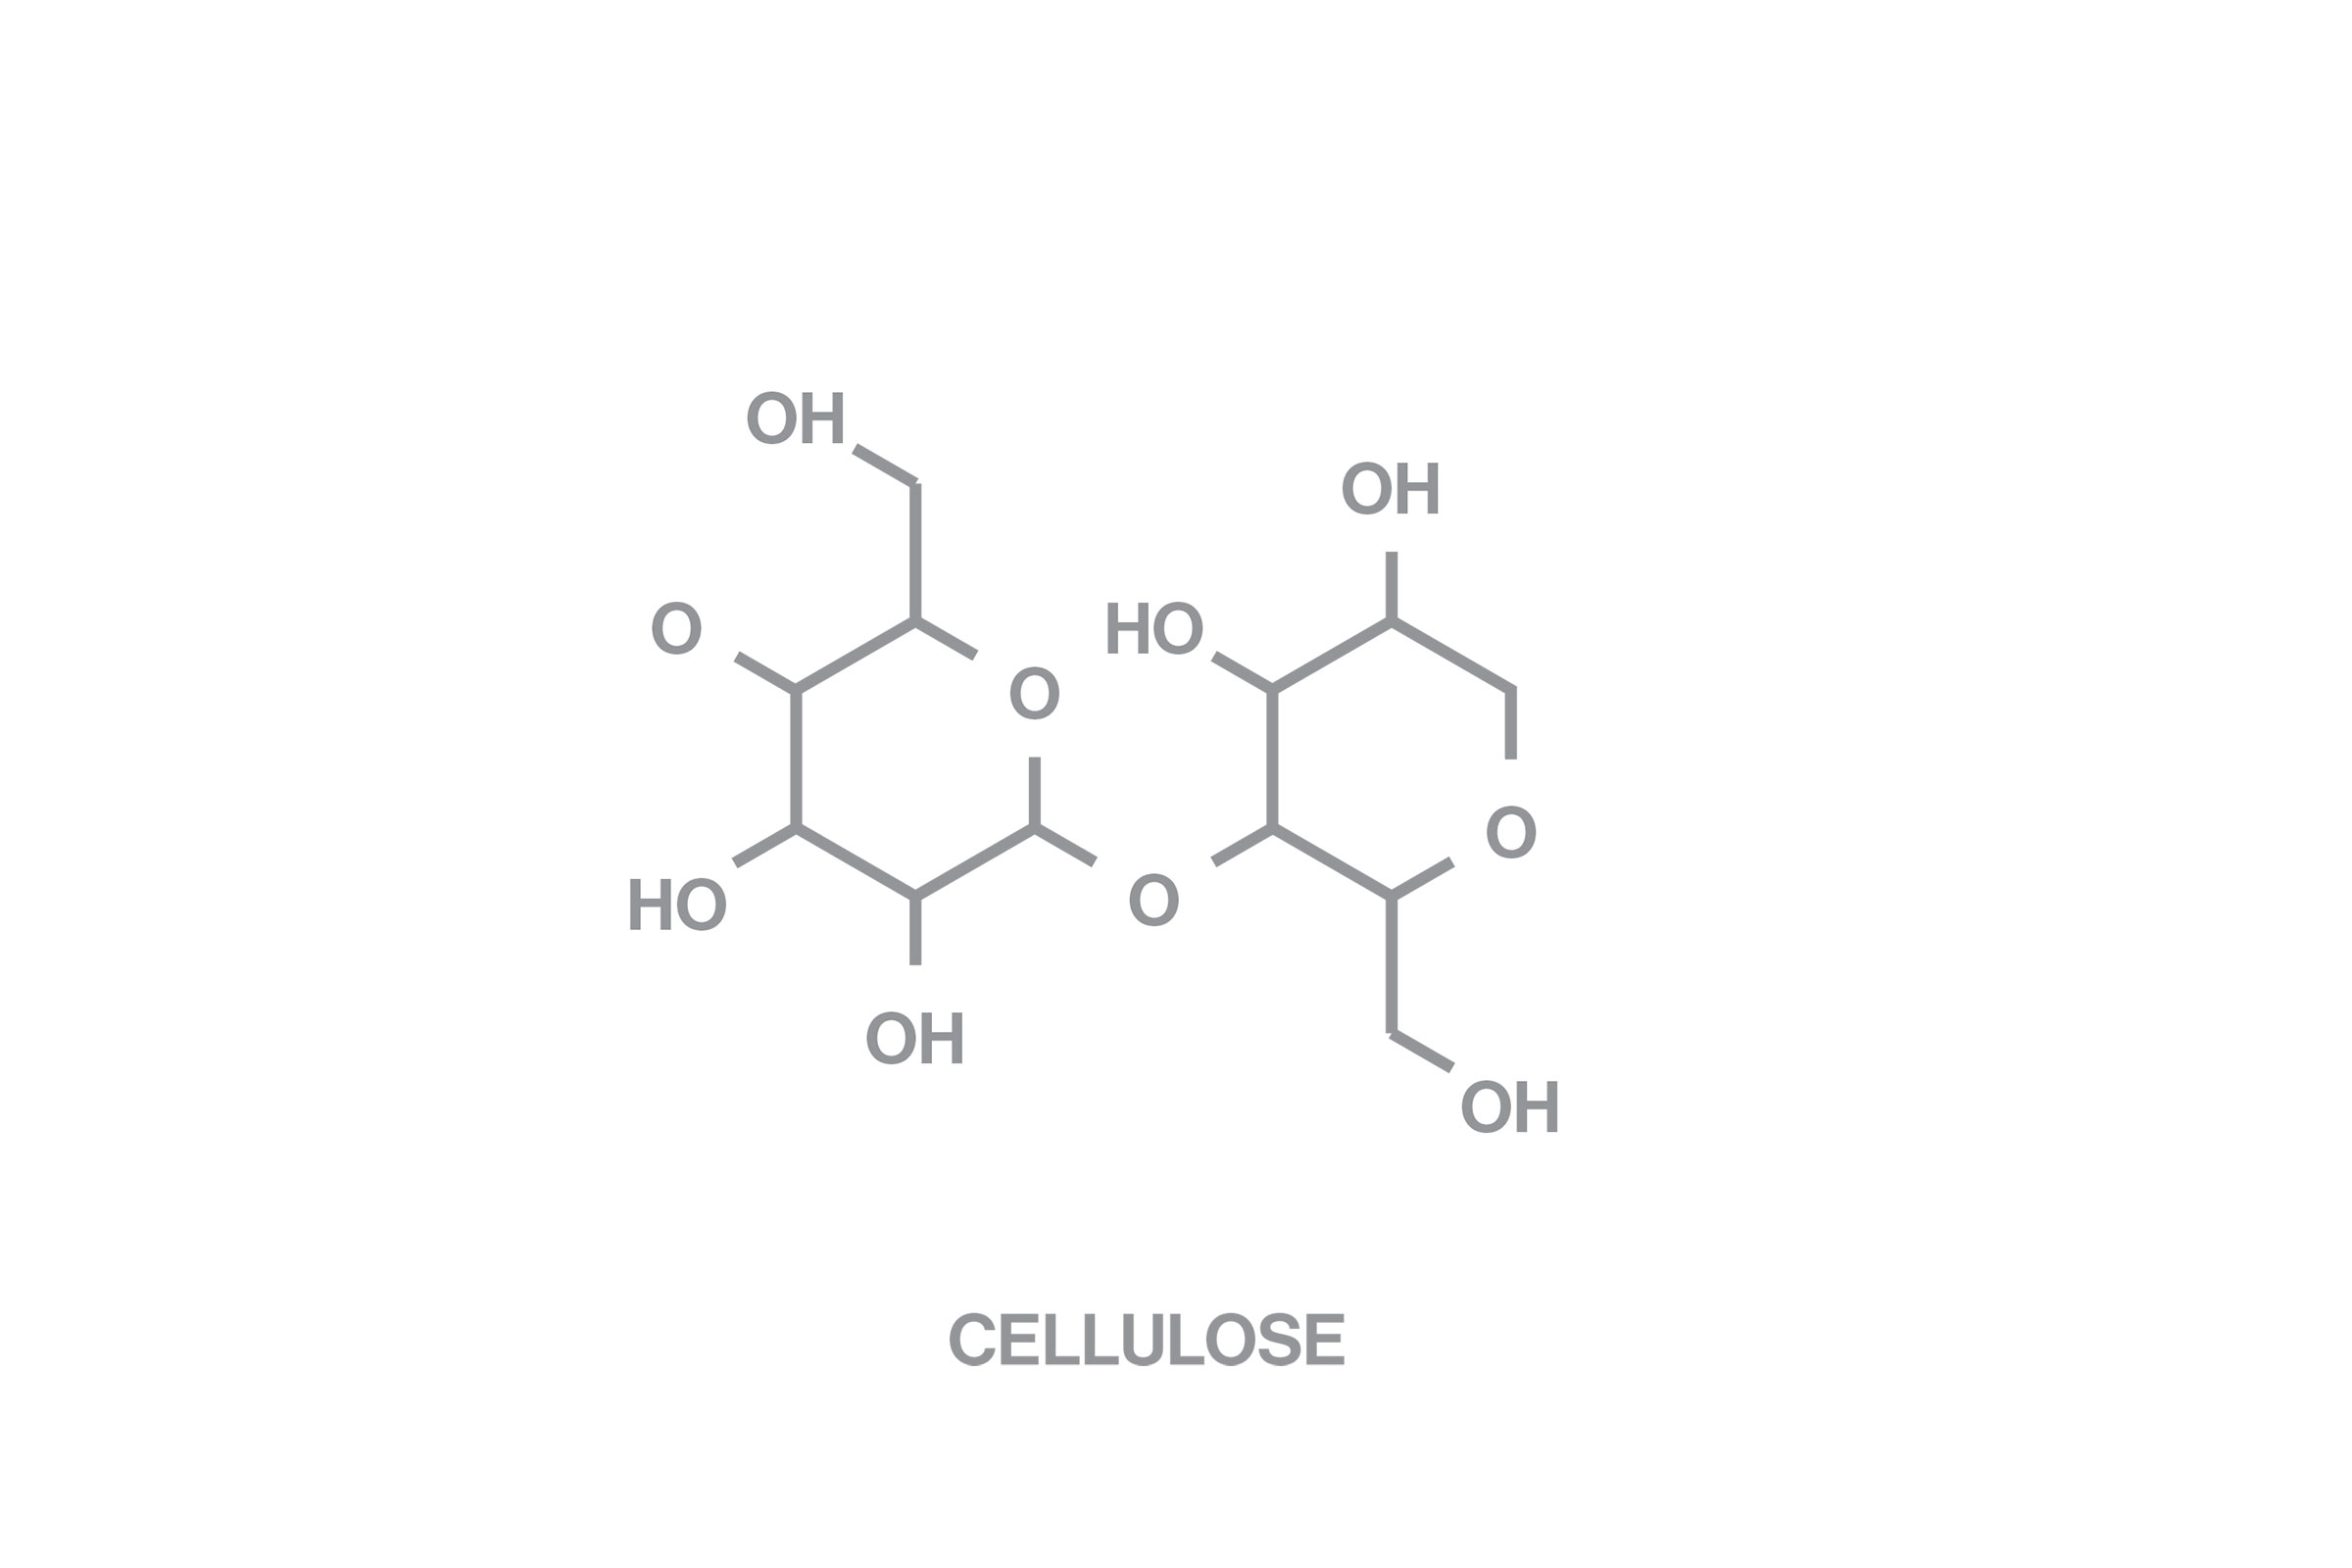


Figure IX: Structural formulas of biopolymer materials used in hydrogel mixtures.
+
The concentration of chitosan in our hydrogel base layer formulas is between 0% - 8%. Hydrogel mixtures containing more than 8% of chitosan will frequently cause jamming in thinner nozzles. In addition, the higher concentrations of chitosan come with a higher probability of warping and tearing as the hydrogel films dry on the print bed.
The formulas for the hydrogel base layer typically contain between 25% - 35% pectin. Anything more than 40% becomes difficult to blend into an extrudable solution. Hydrogels with a concentration of 25% pectin are relatively liquid and will diffuse outwards and mix more readily. On the other hand, hydrogels with a concentration of 32% pectin will have higher viscosity to remain more distinct when mixed. When pectin formulas of significantly different viscosities are blended, the resulting hydrodynamic interactions can generate complex surface patterns.
Printer
The material mixtures are based on a percentage value of volume to weight for water to powder. The primary ingredients are apple pectin, shrimp chitosan, vegetable glycerin, plant cellulose, and water in addition to other additives to modify color and surface texture.The concentration of chitosan in our hydrogel base layer formulas is between 0% - 8%. Hydrogel mixtures containing more than 8% of chitosan will frequently cause jamming in thinner nozzles. In addition, the higher concentrations of chitosan come with a higher probability of warping and tearing as the hydrogel films dry on the print bed.
The formulas for the hydrogel base layer typically contain between 25% - 35% pectin. Anything more than 40% becomes difficult to blend into an extrudable solution. Hydrogels with a concentration of 25% pectin are relatively liquid and will diffuse outwards and mix more readily. On the other hand, hydrogels with a concentration of 32% pectin will have higher viscosity to remain more distinct when mixed. When pectin formulas of significantly different viscosities are blended, the resulting hydrodynamic interactions can generate complex surface patterns.