
Figure I: Comparison of the deformation and color change of radially aggregated and nested biopolymer prints aged over 1 year with different 2-dimensional geometries and 3-dimensional forms.

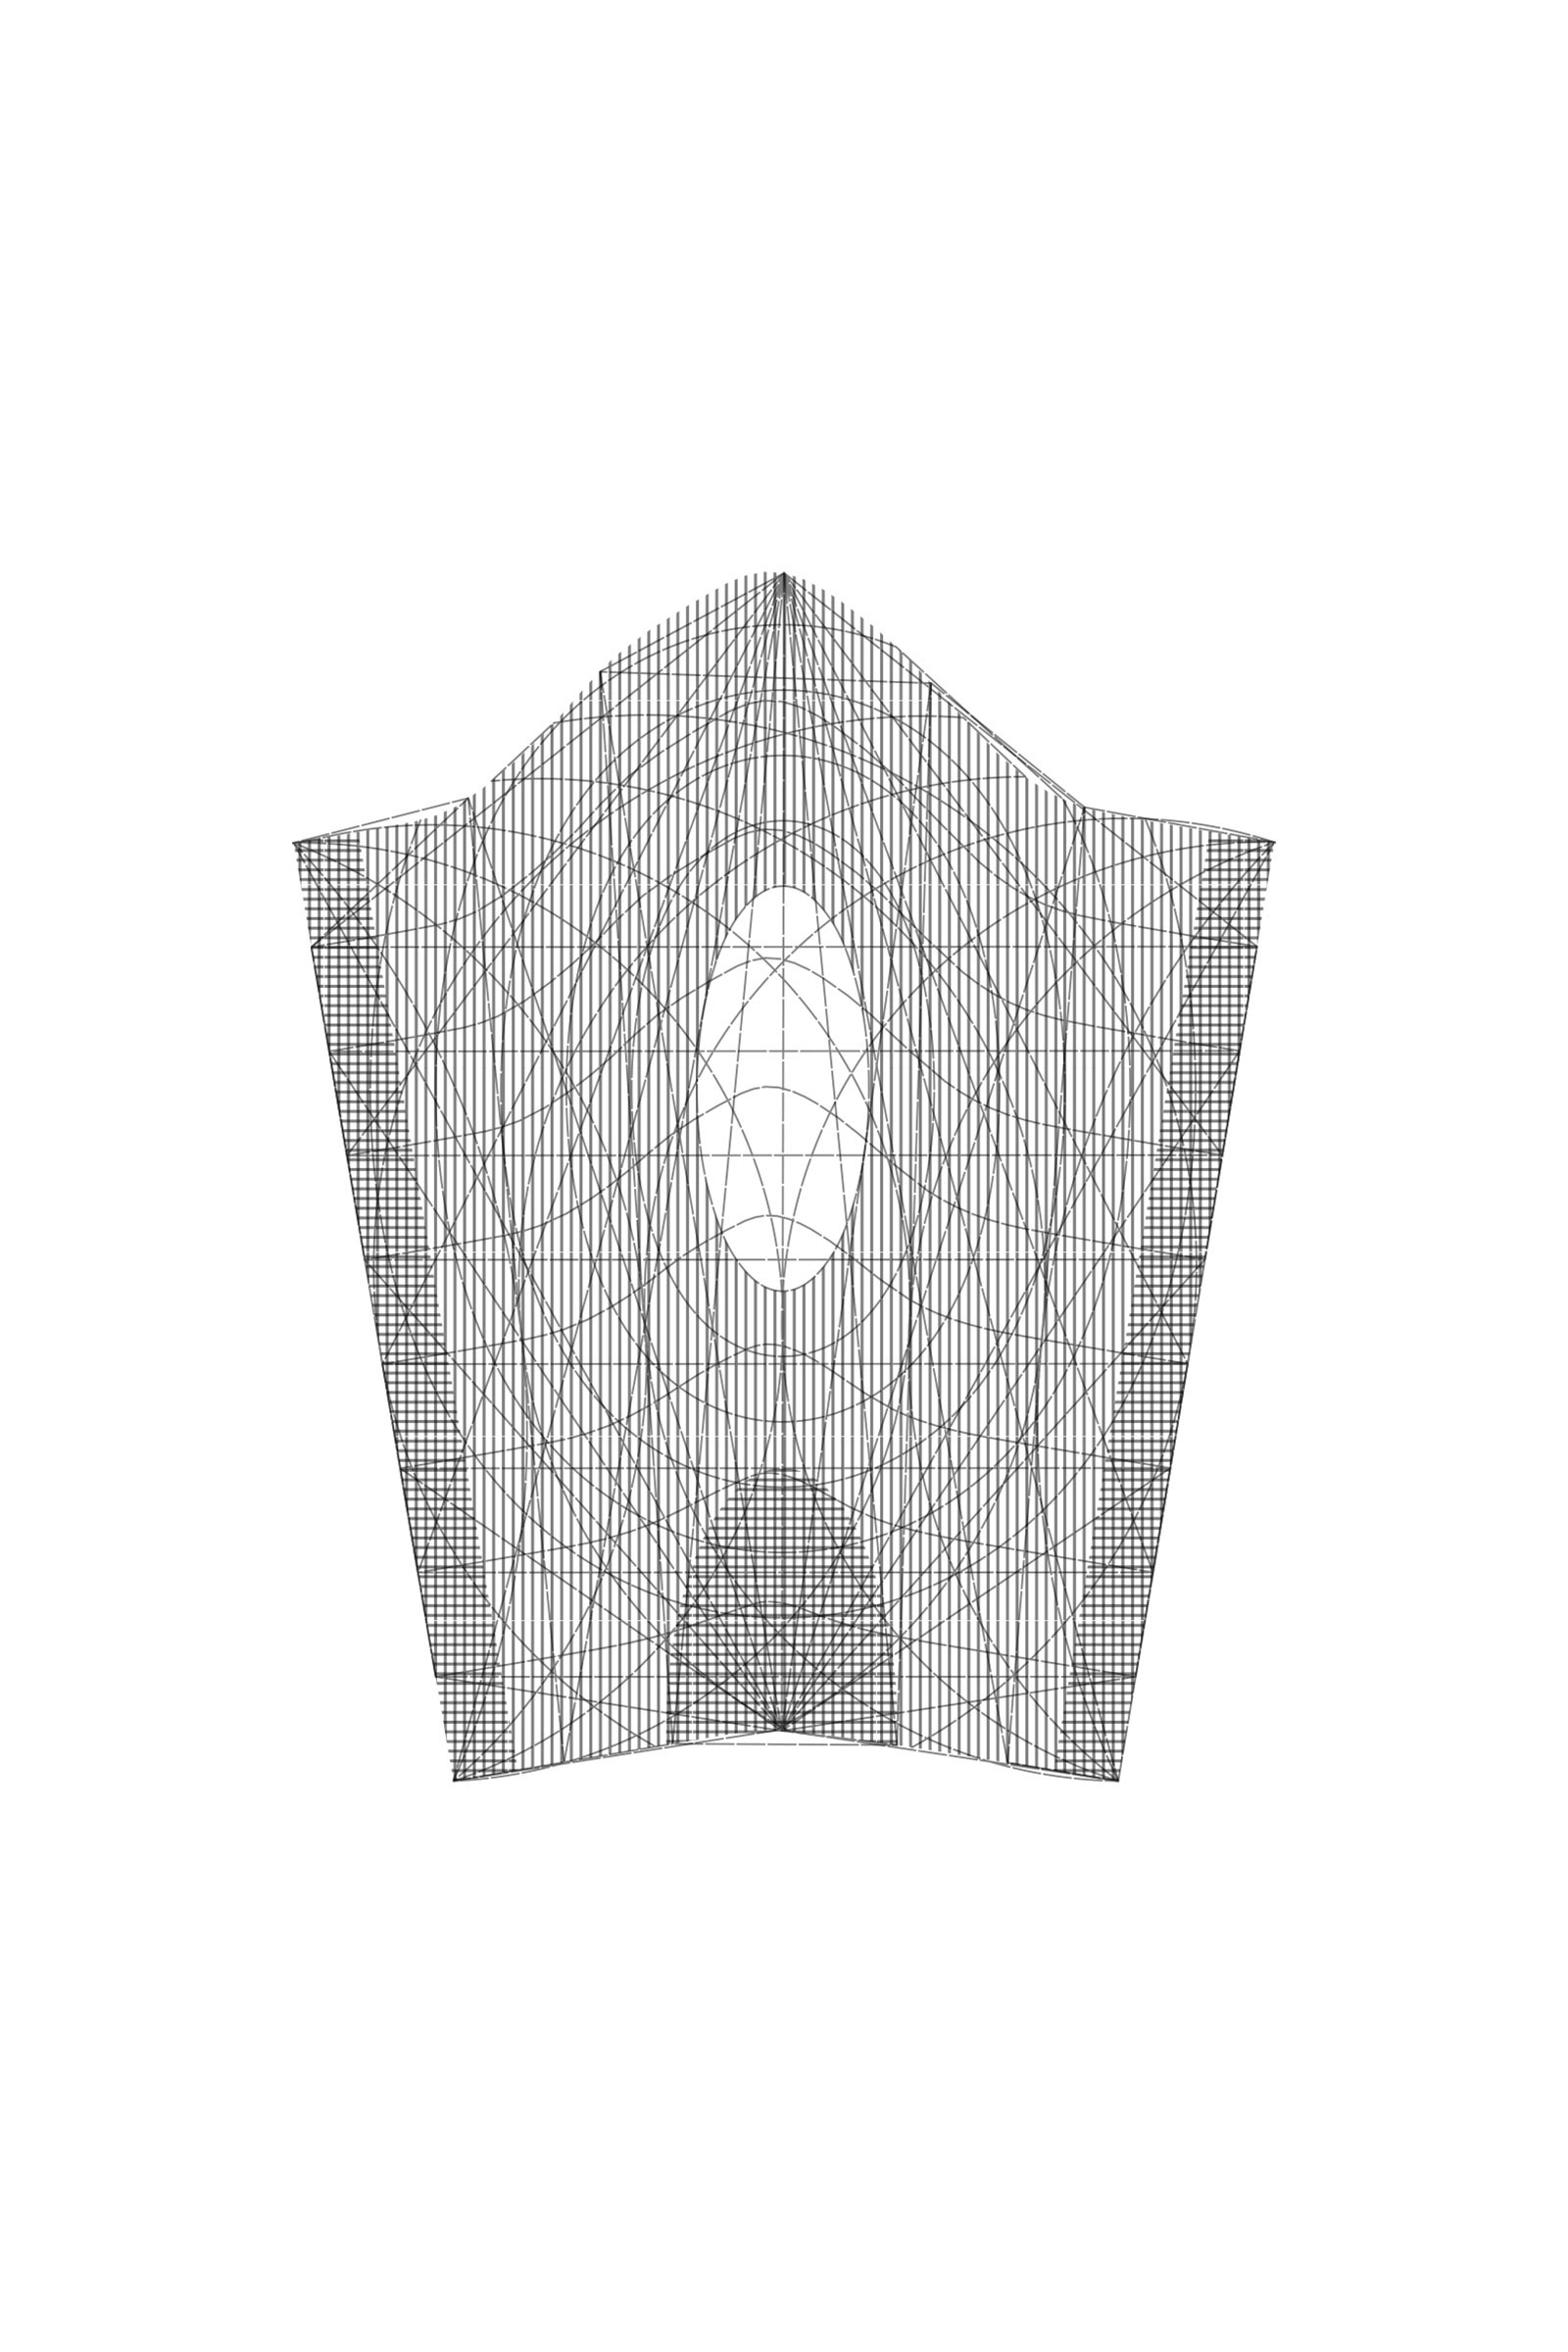
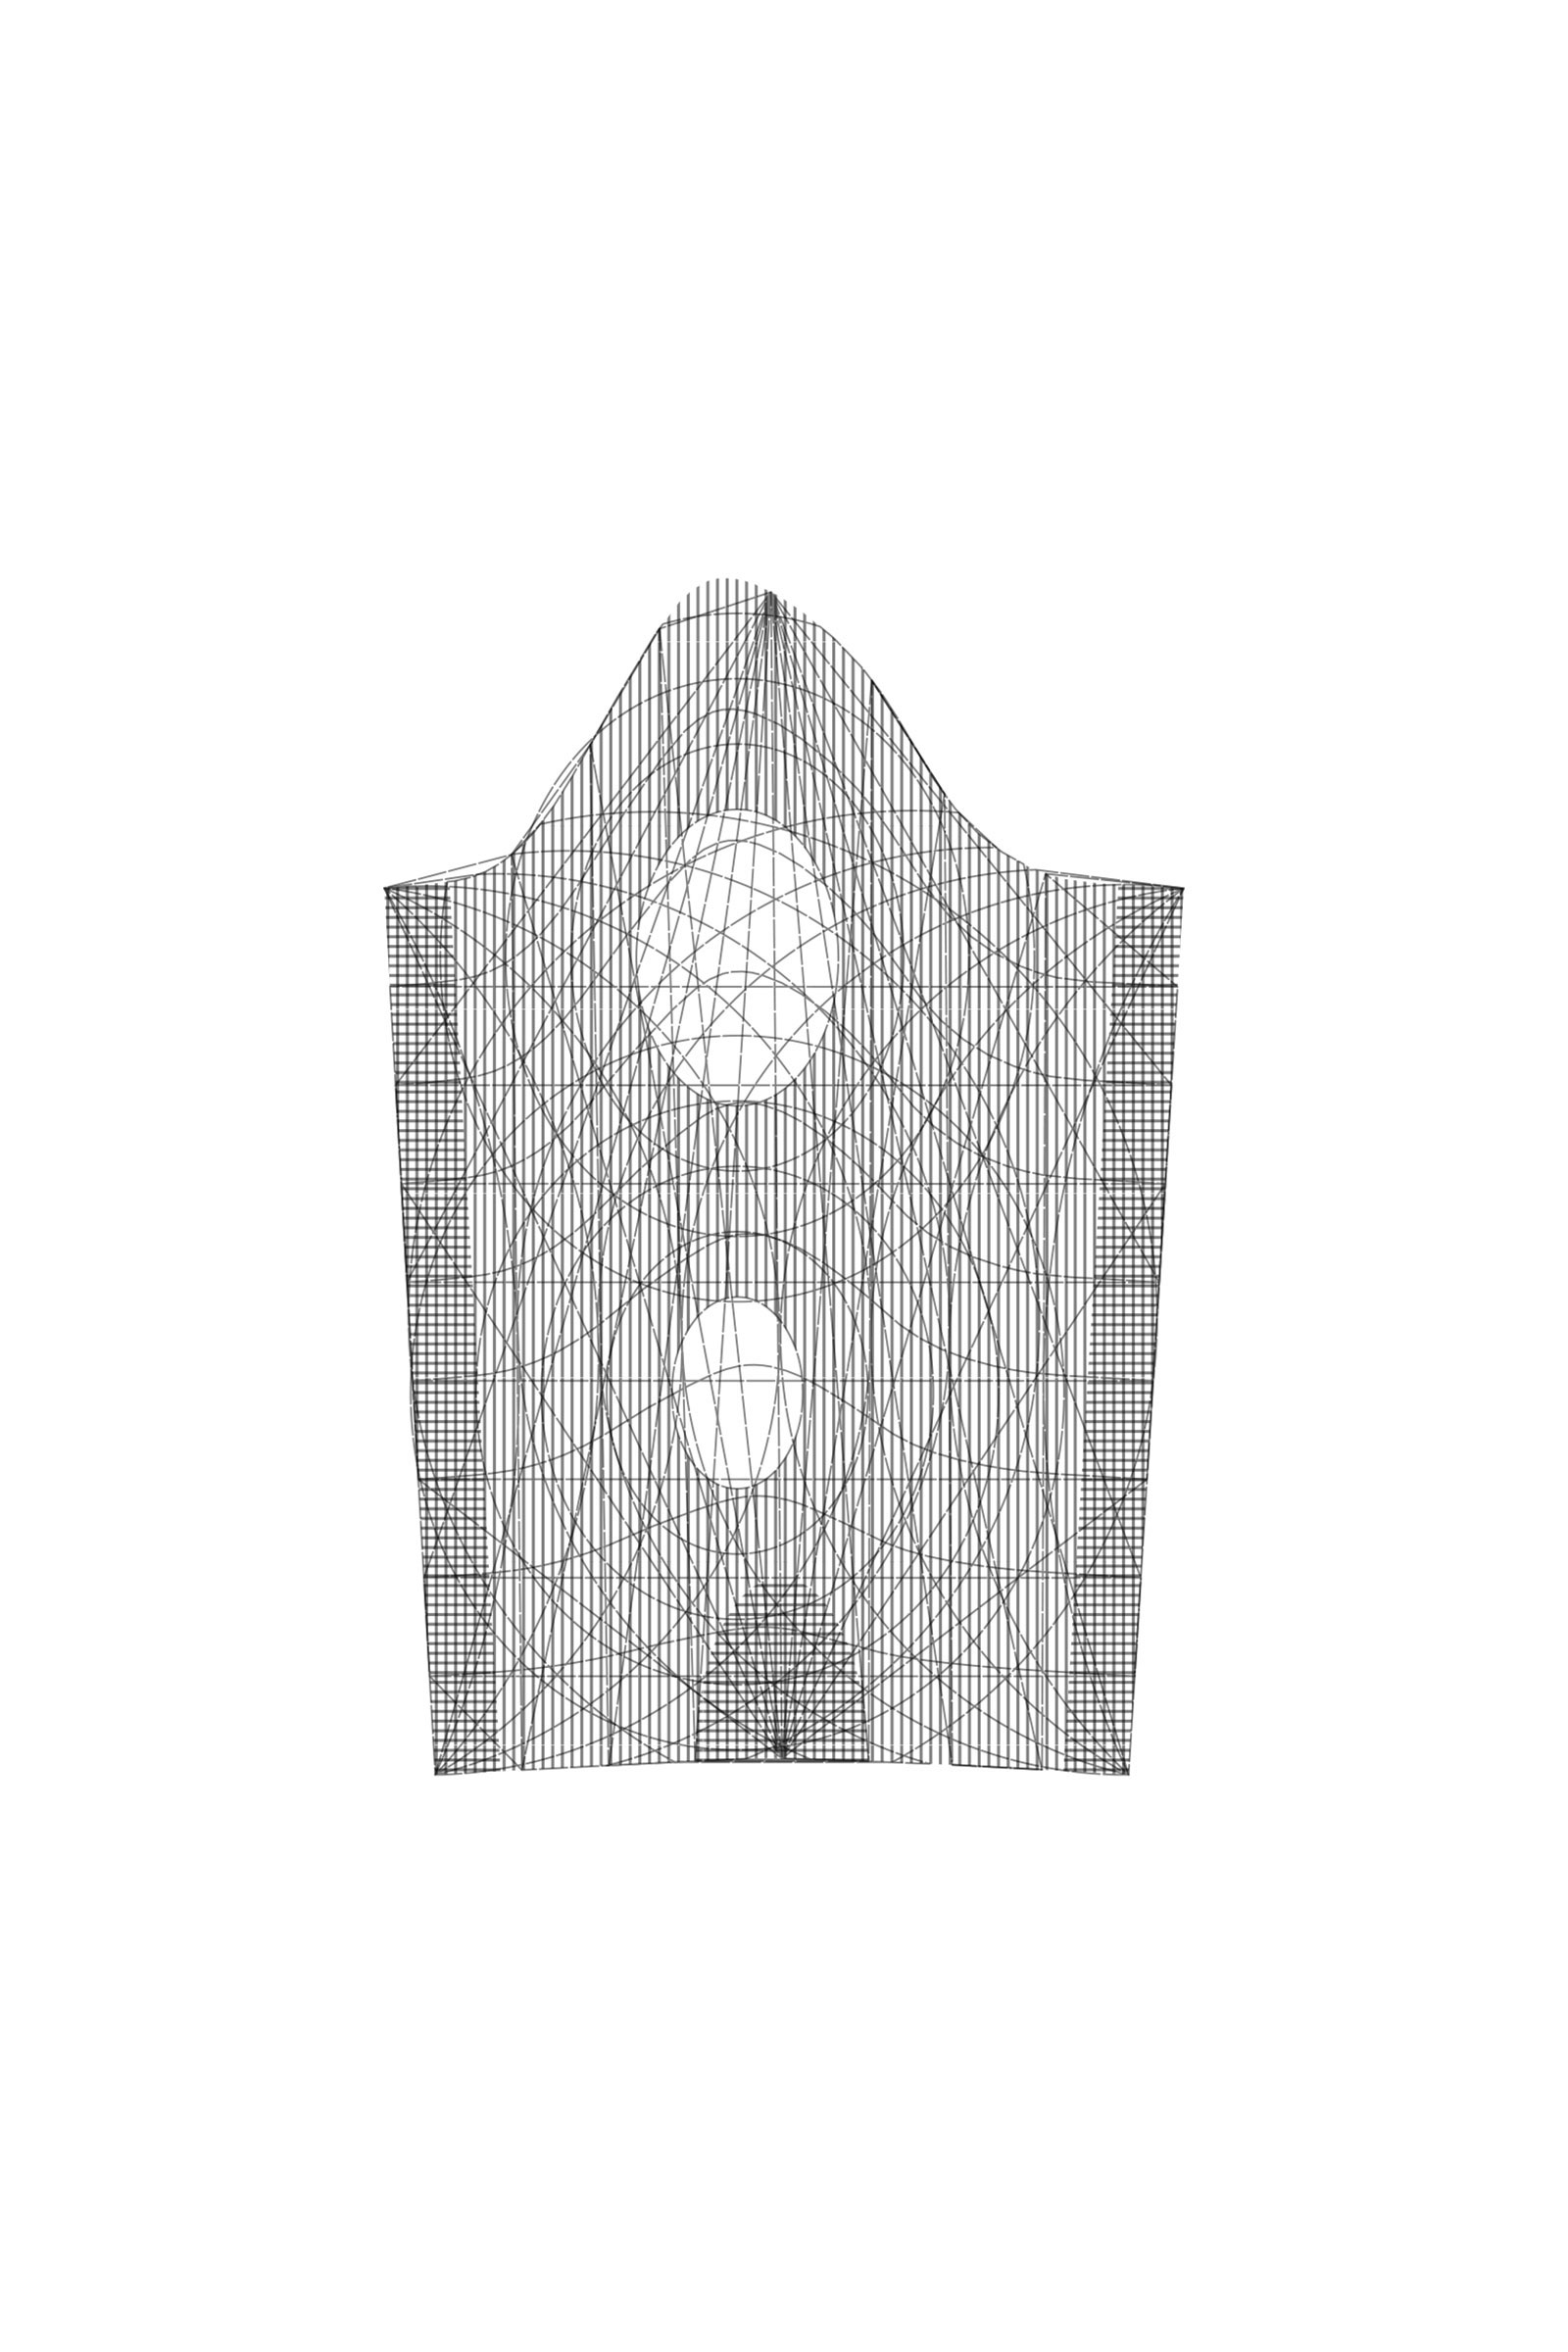
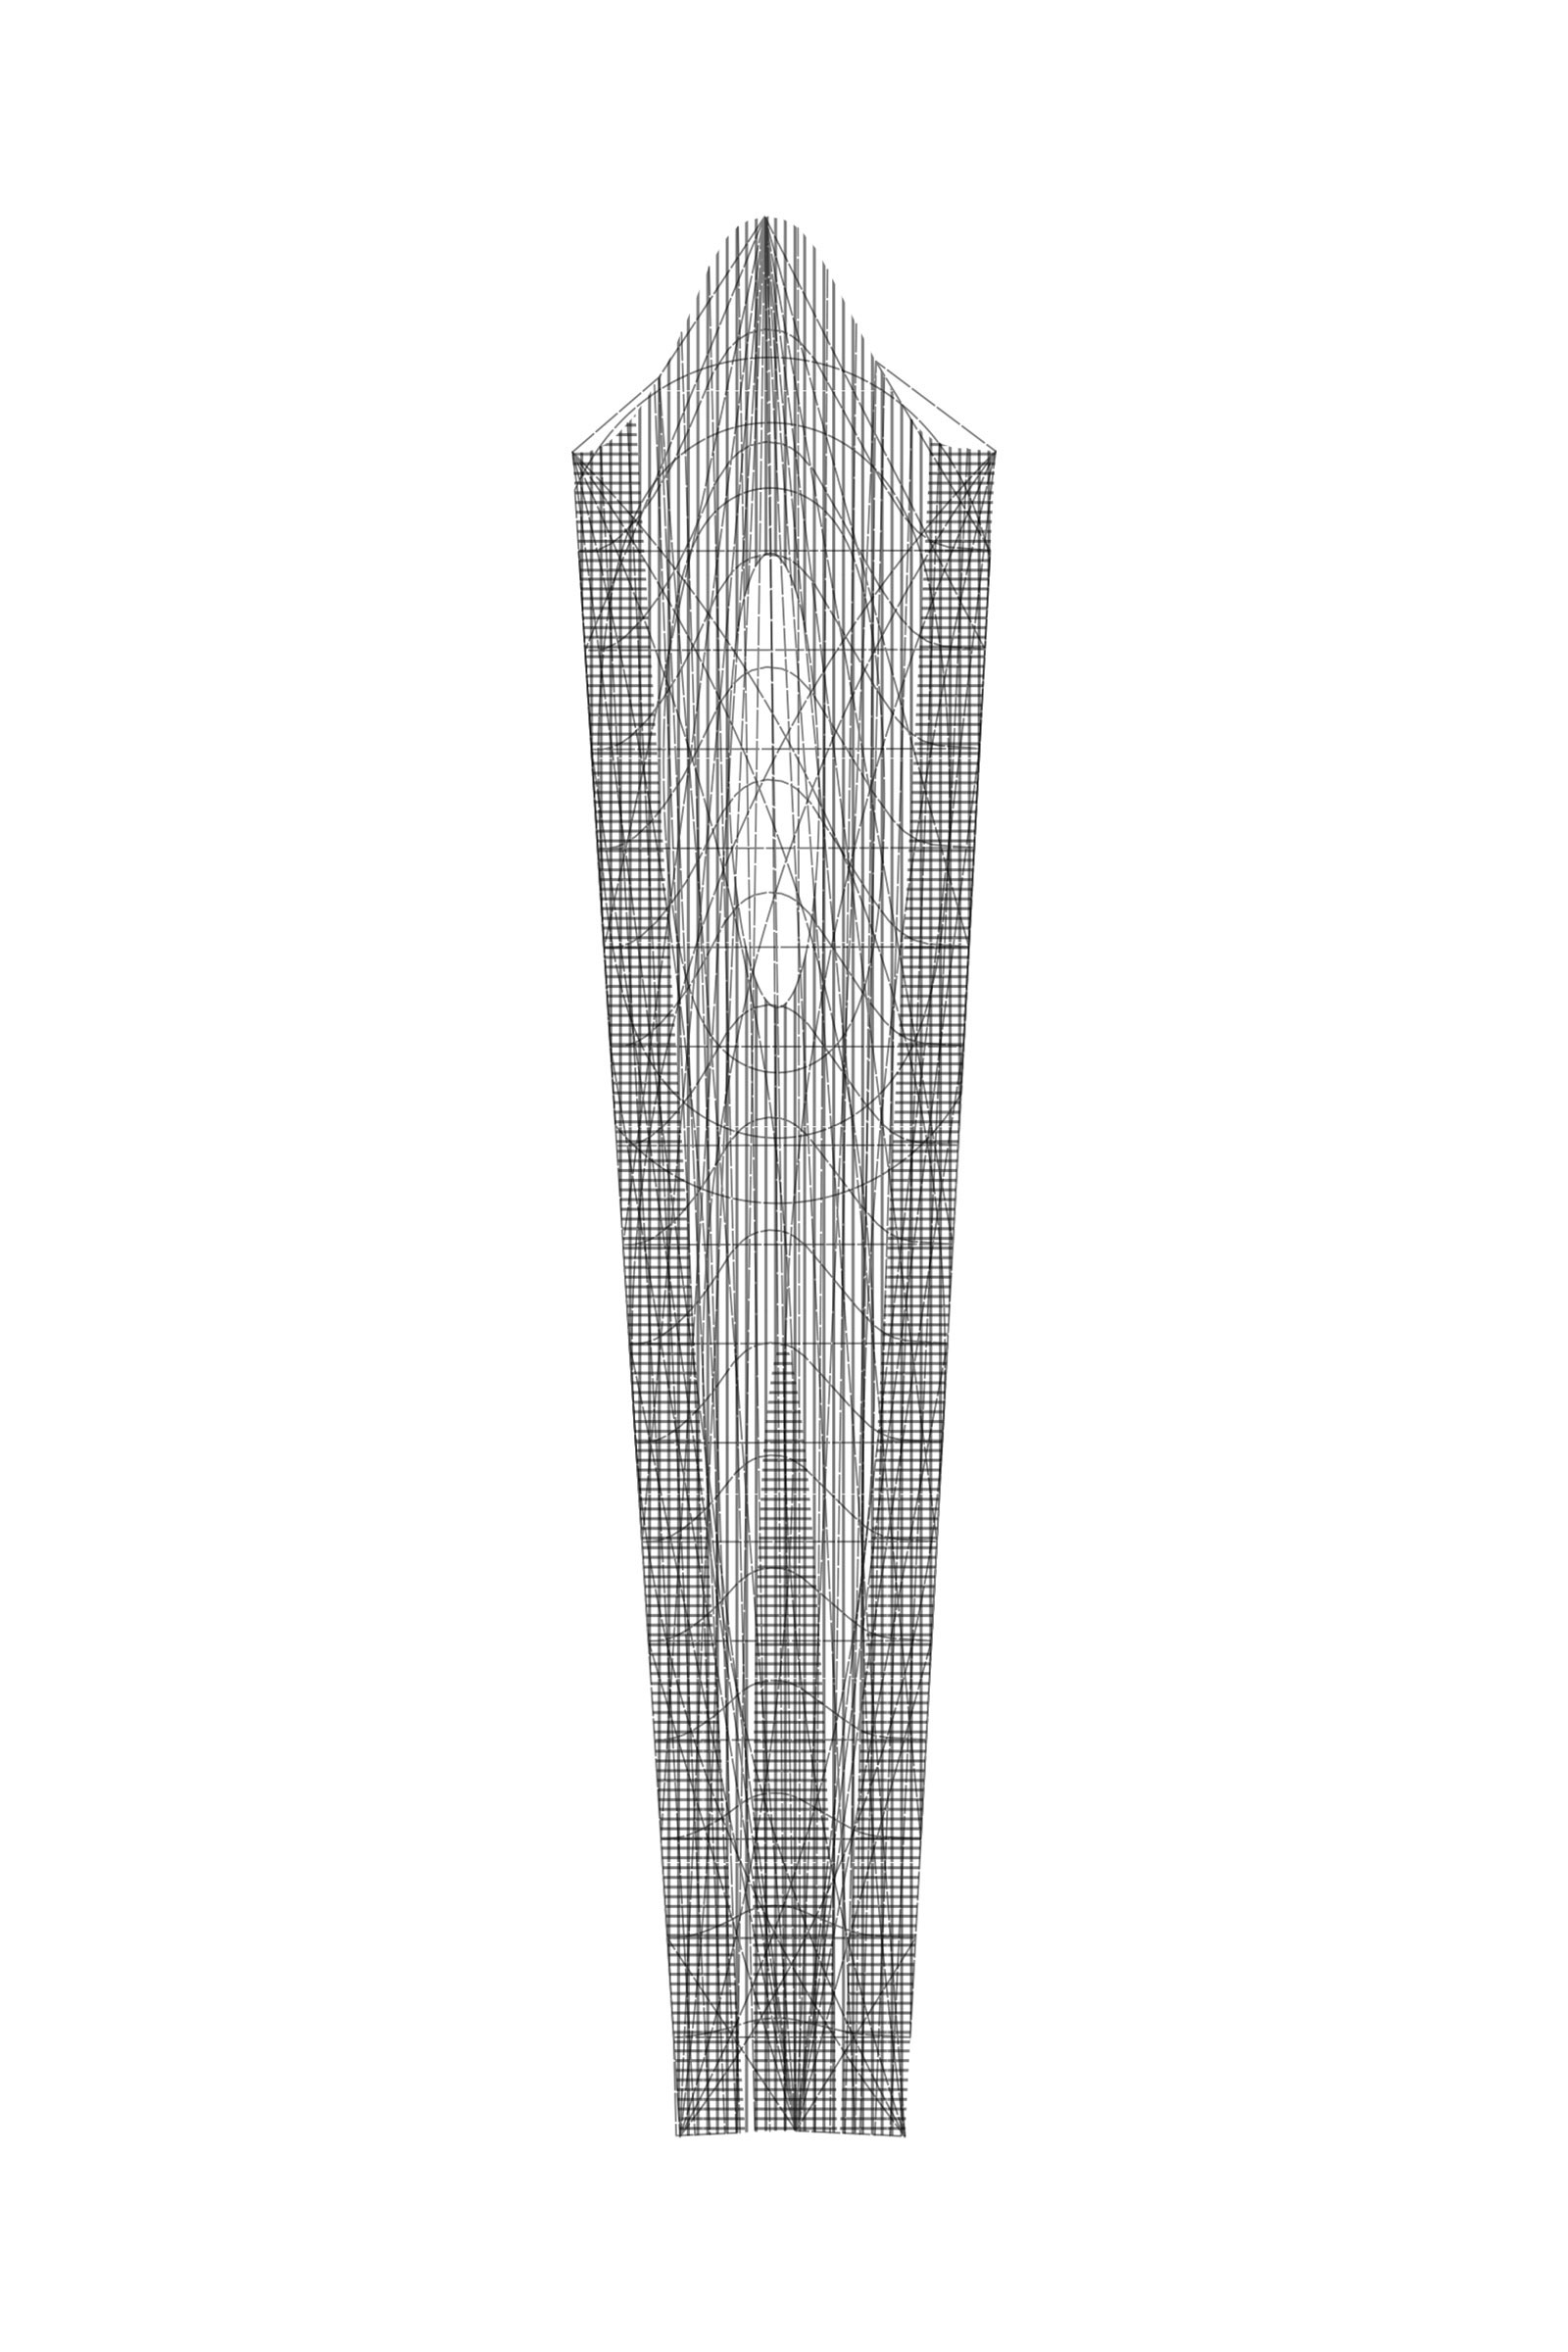
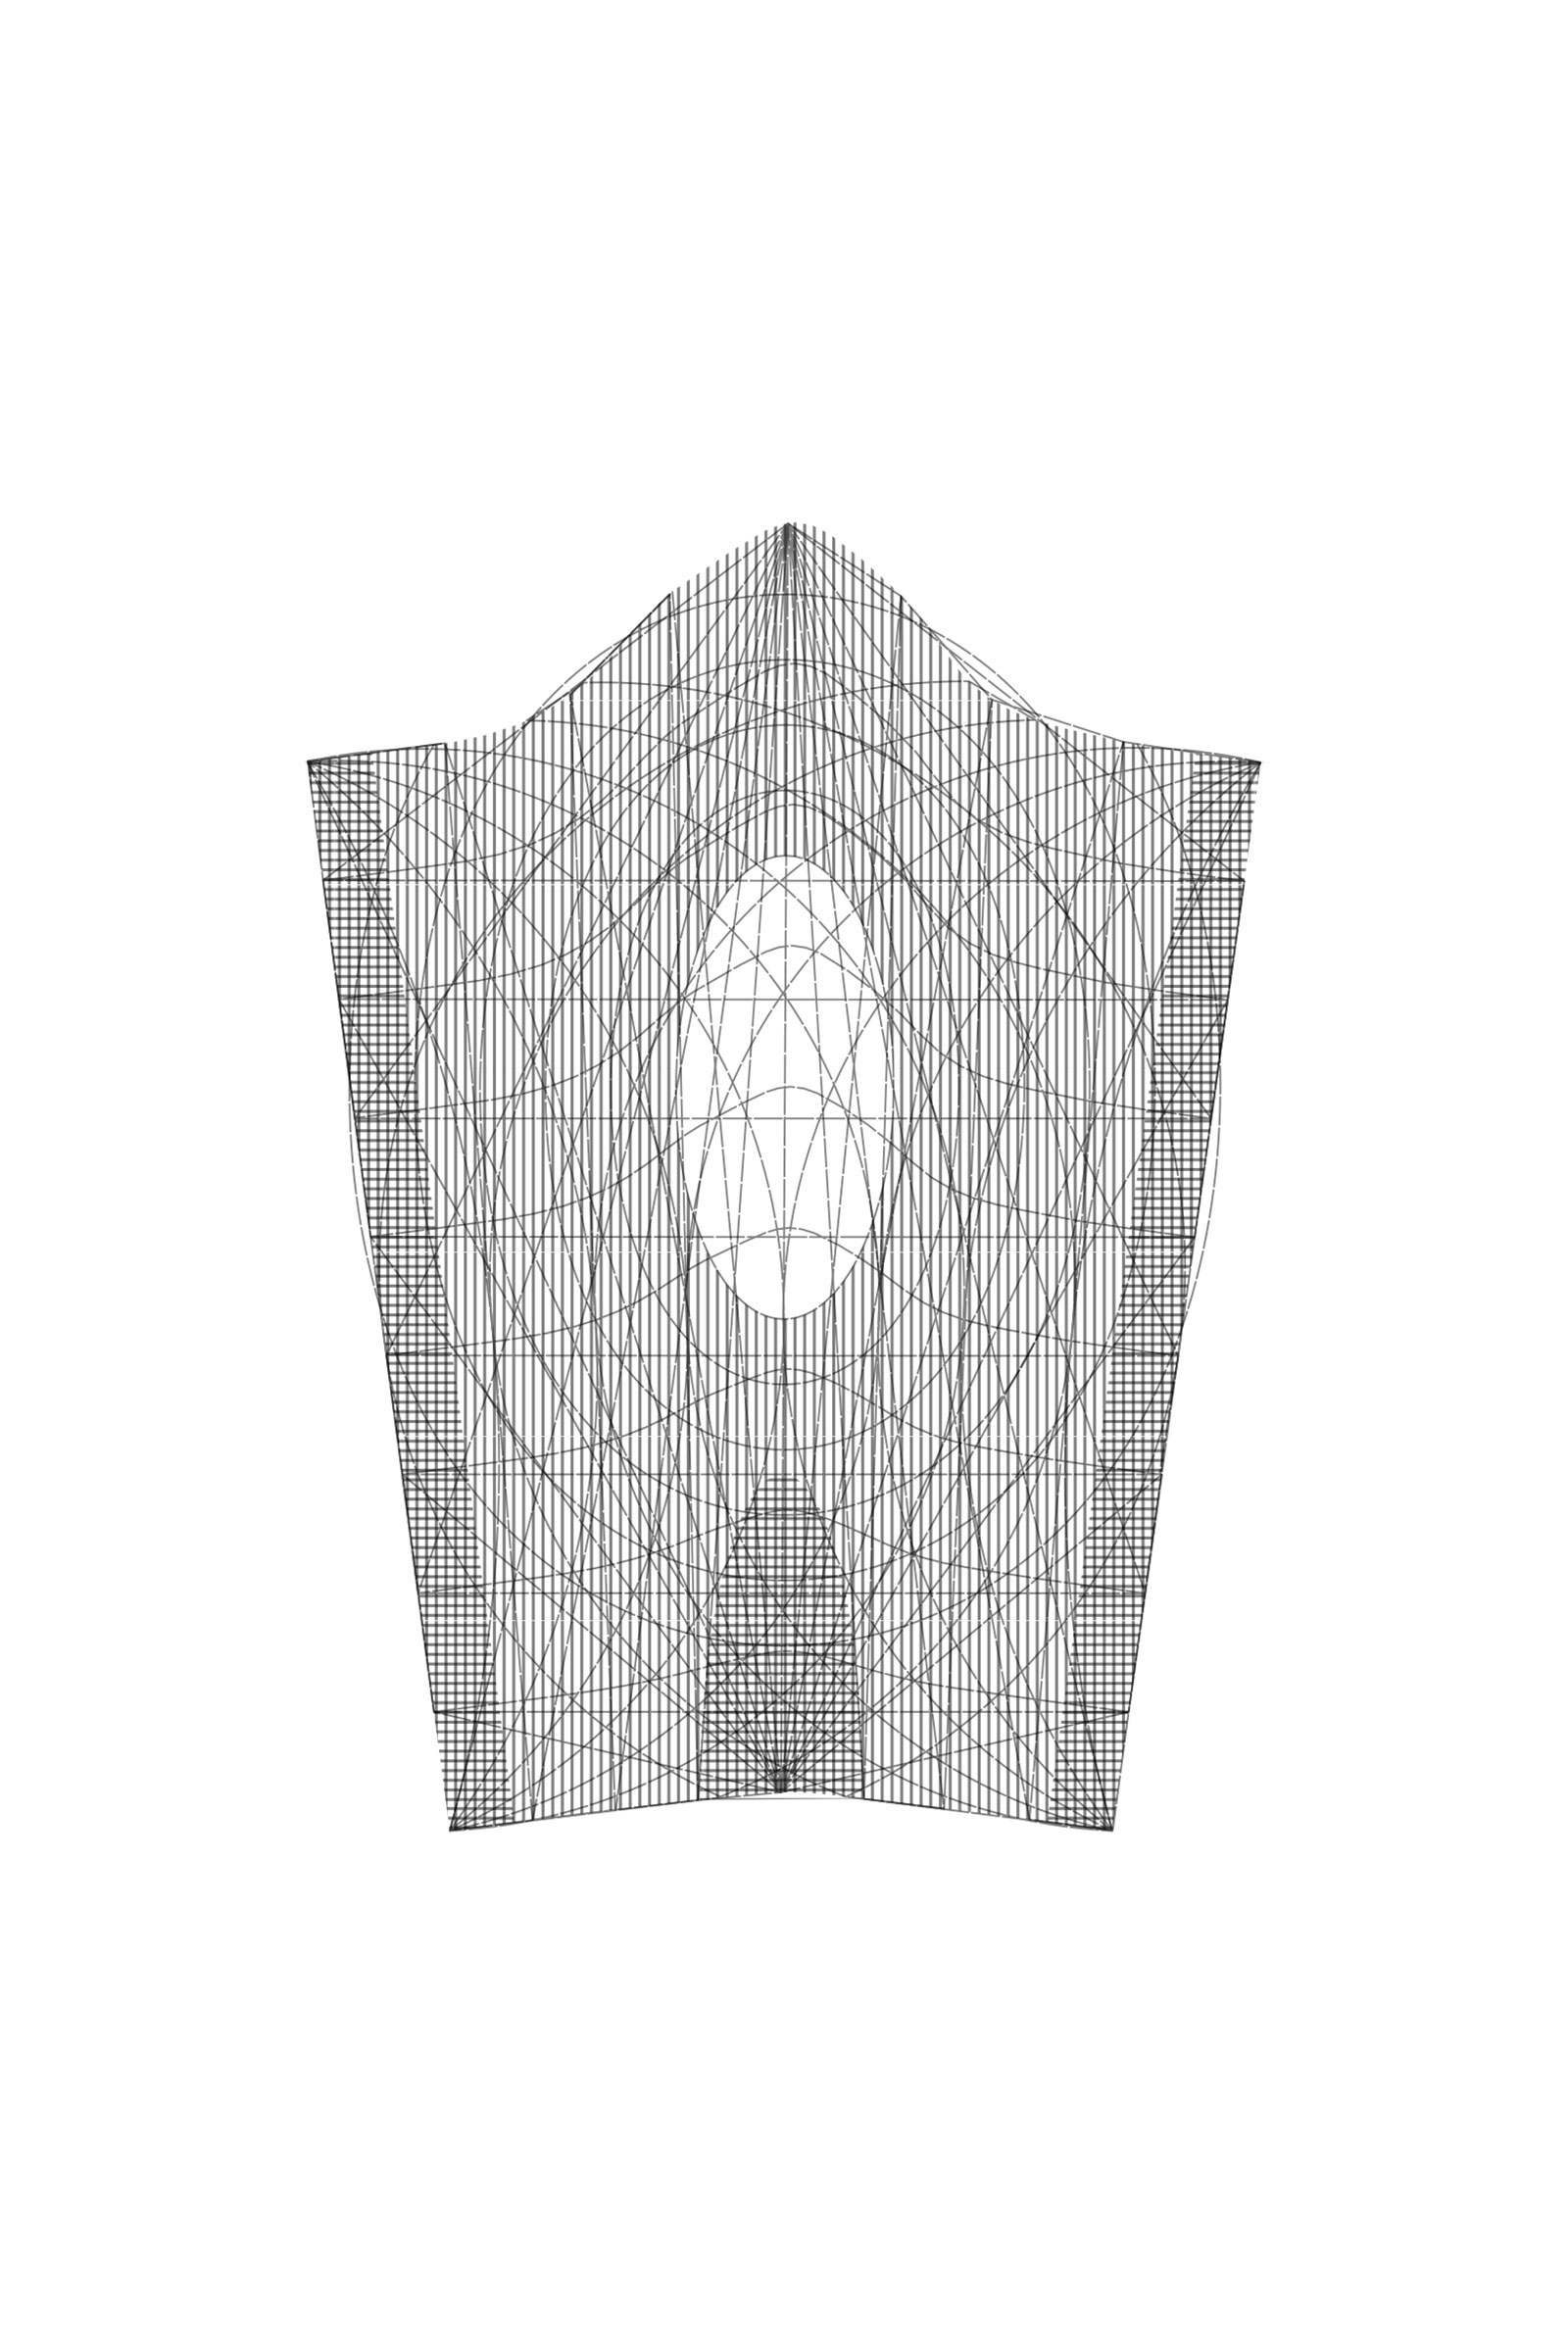


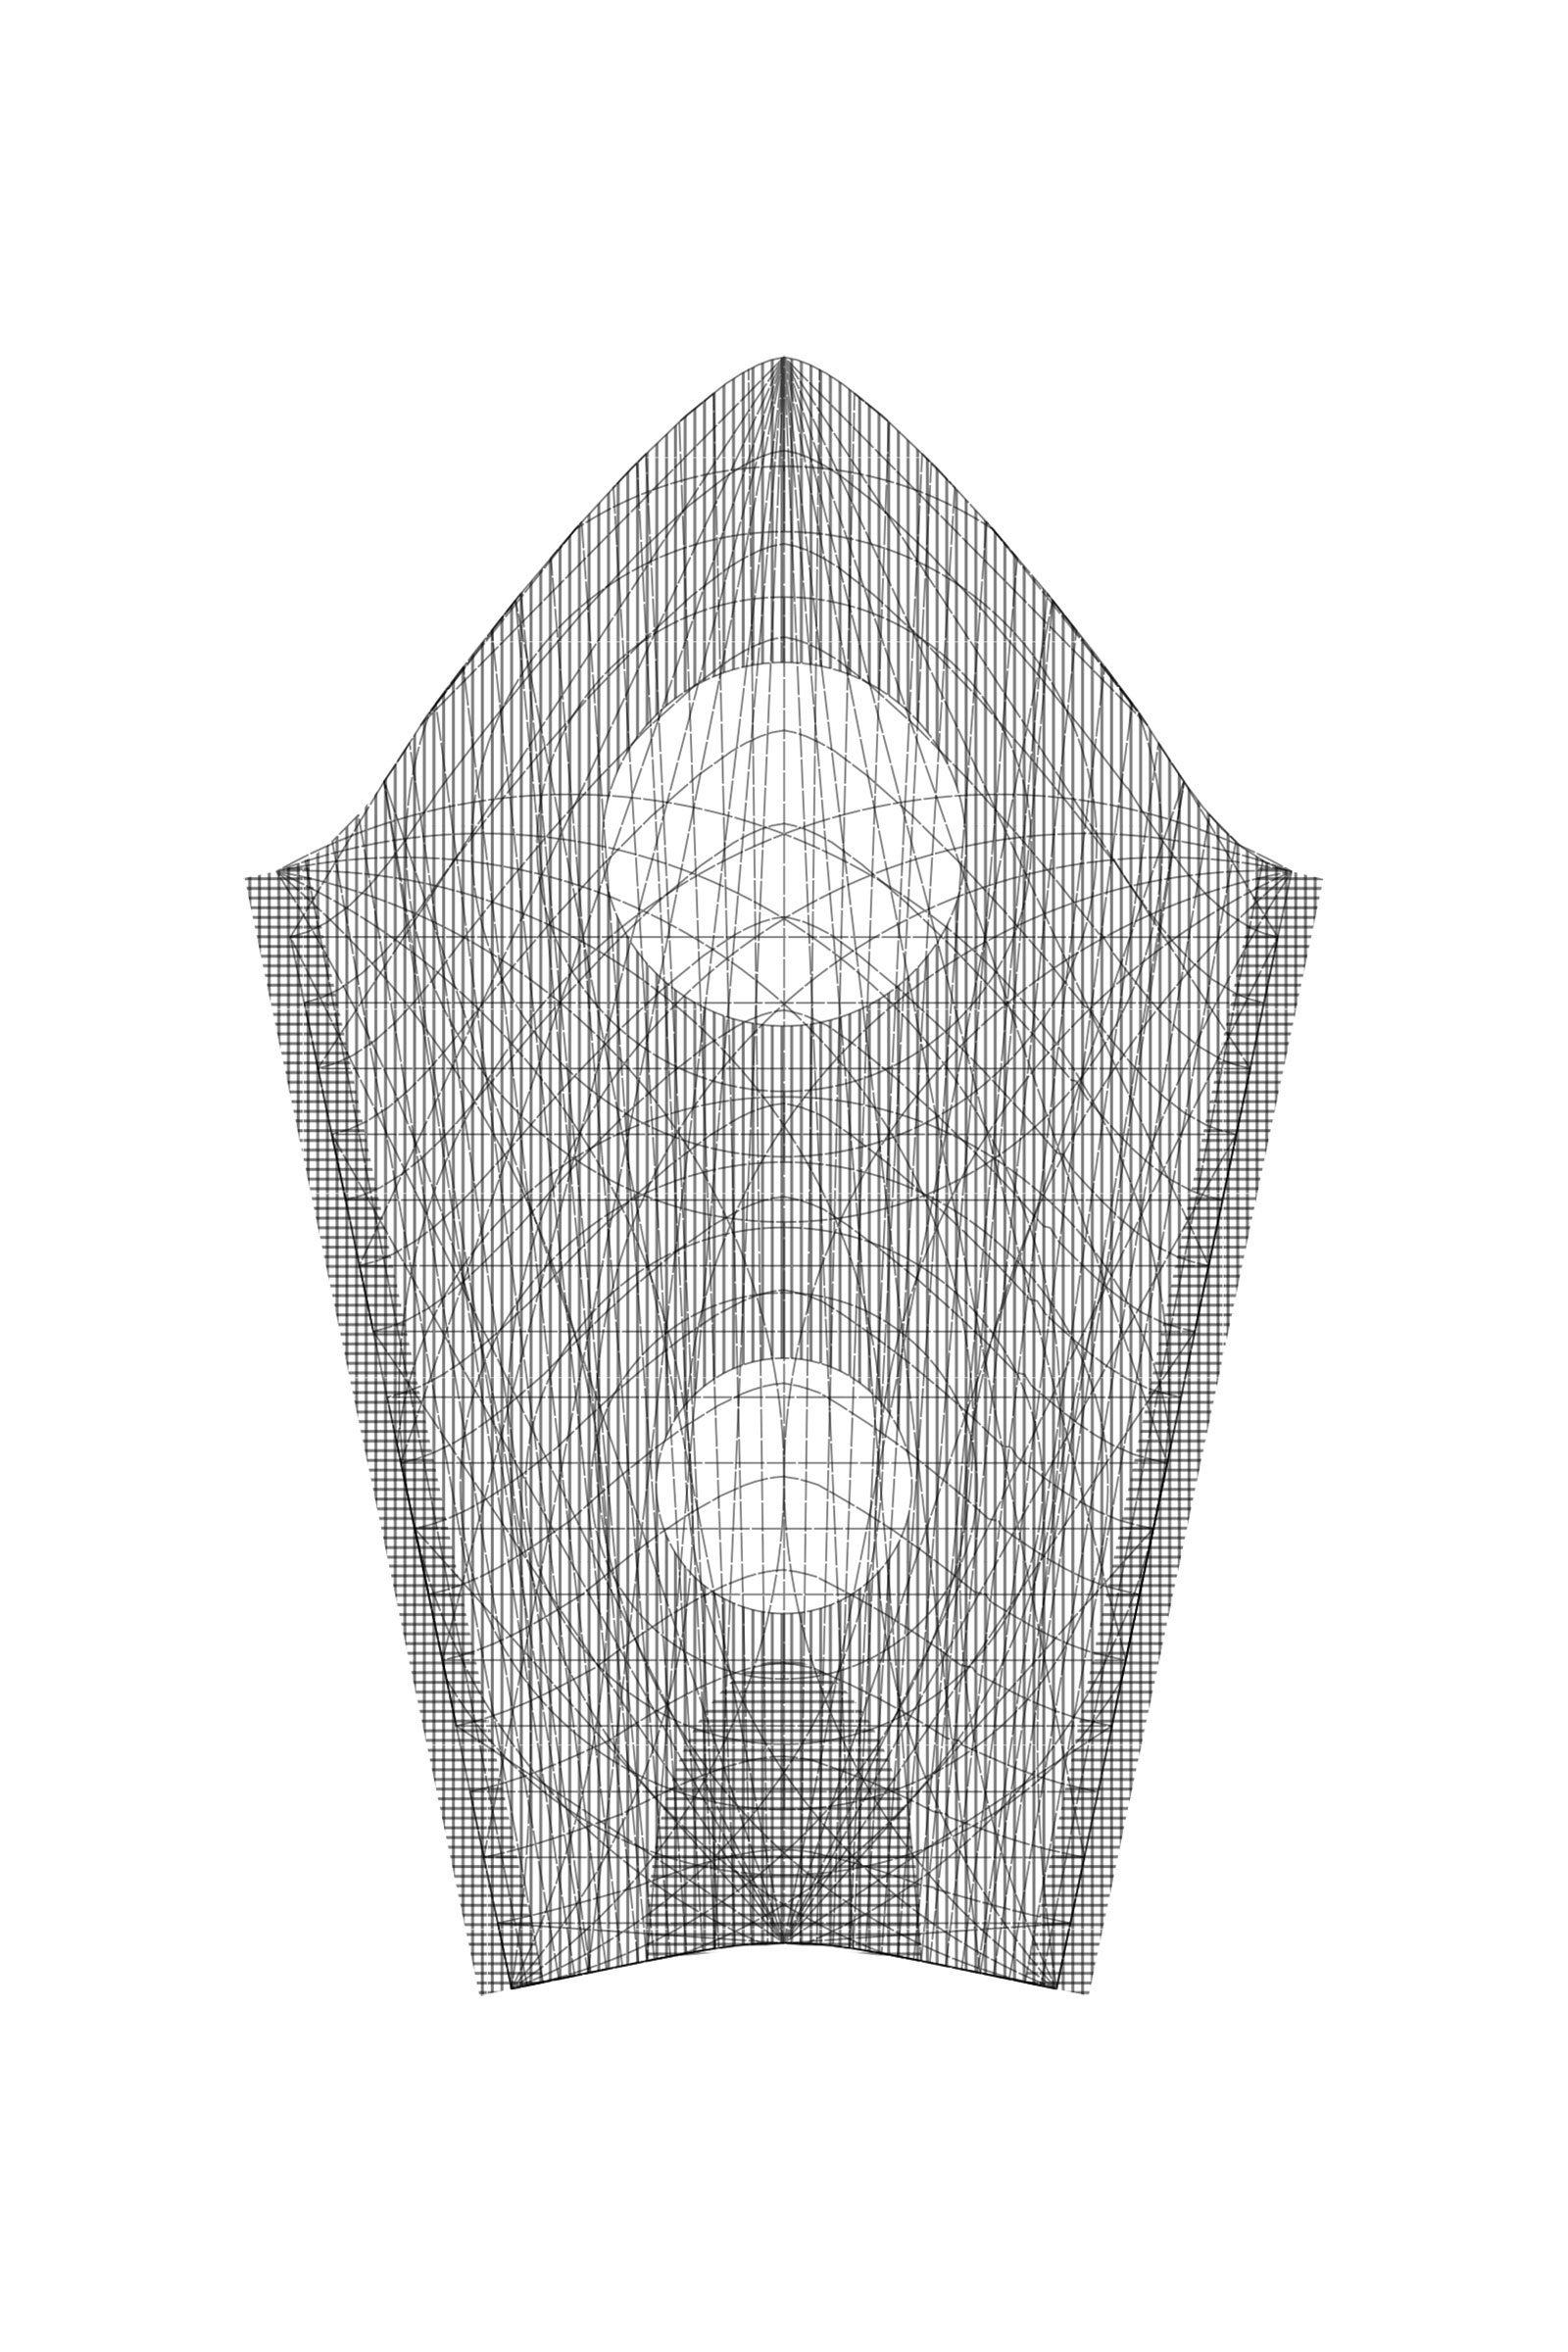
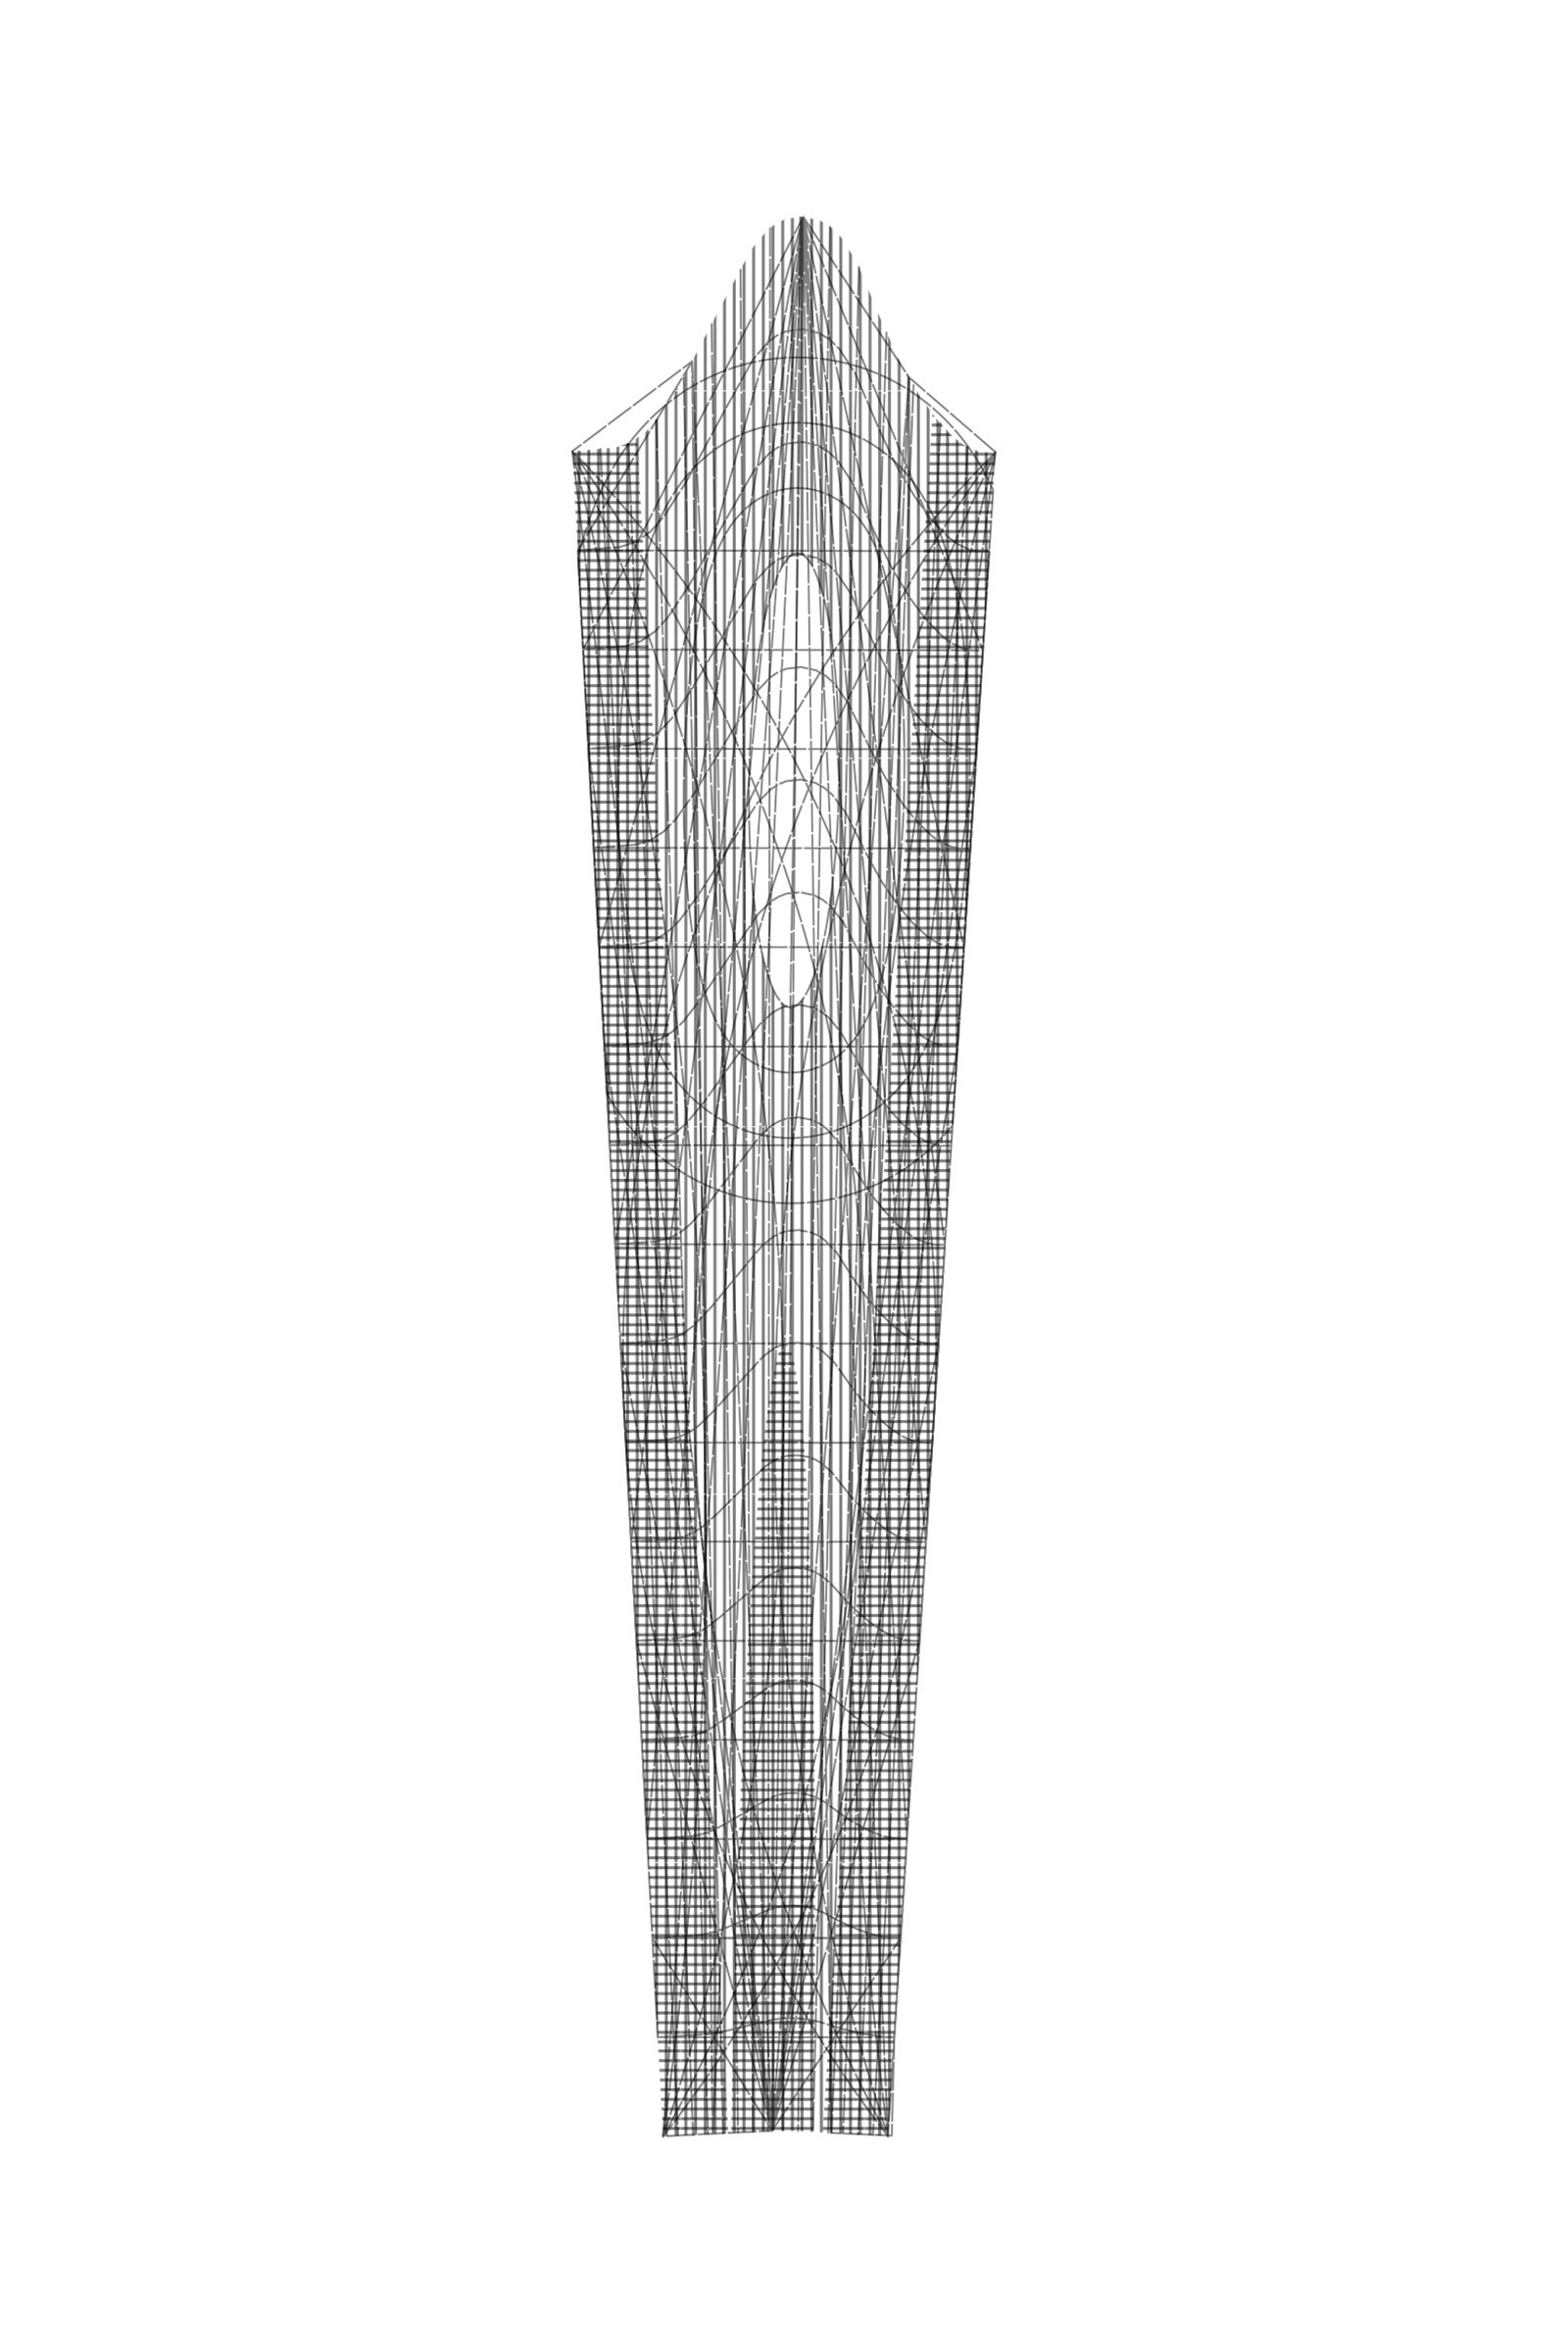

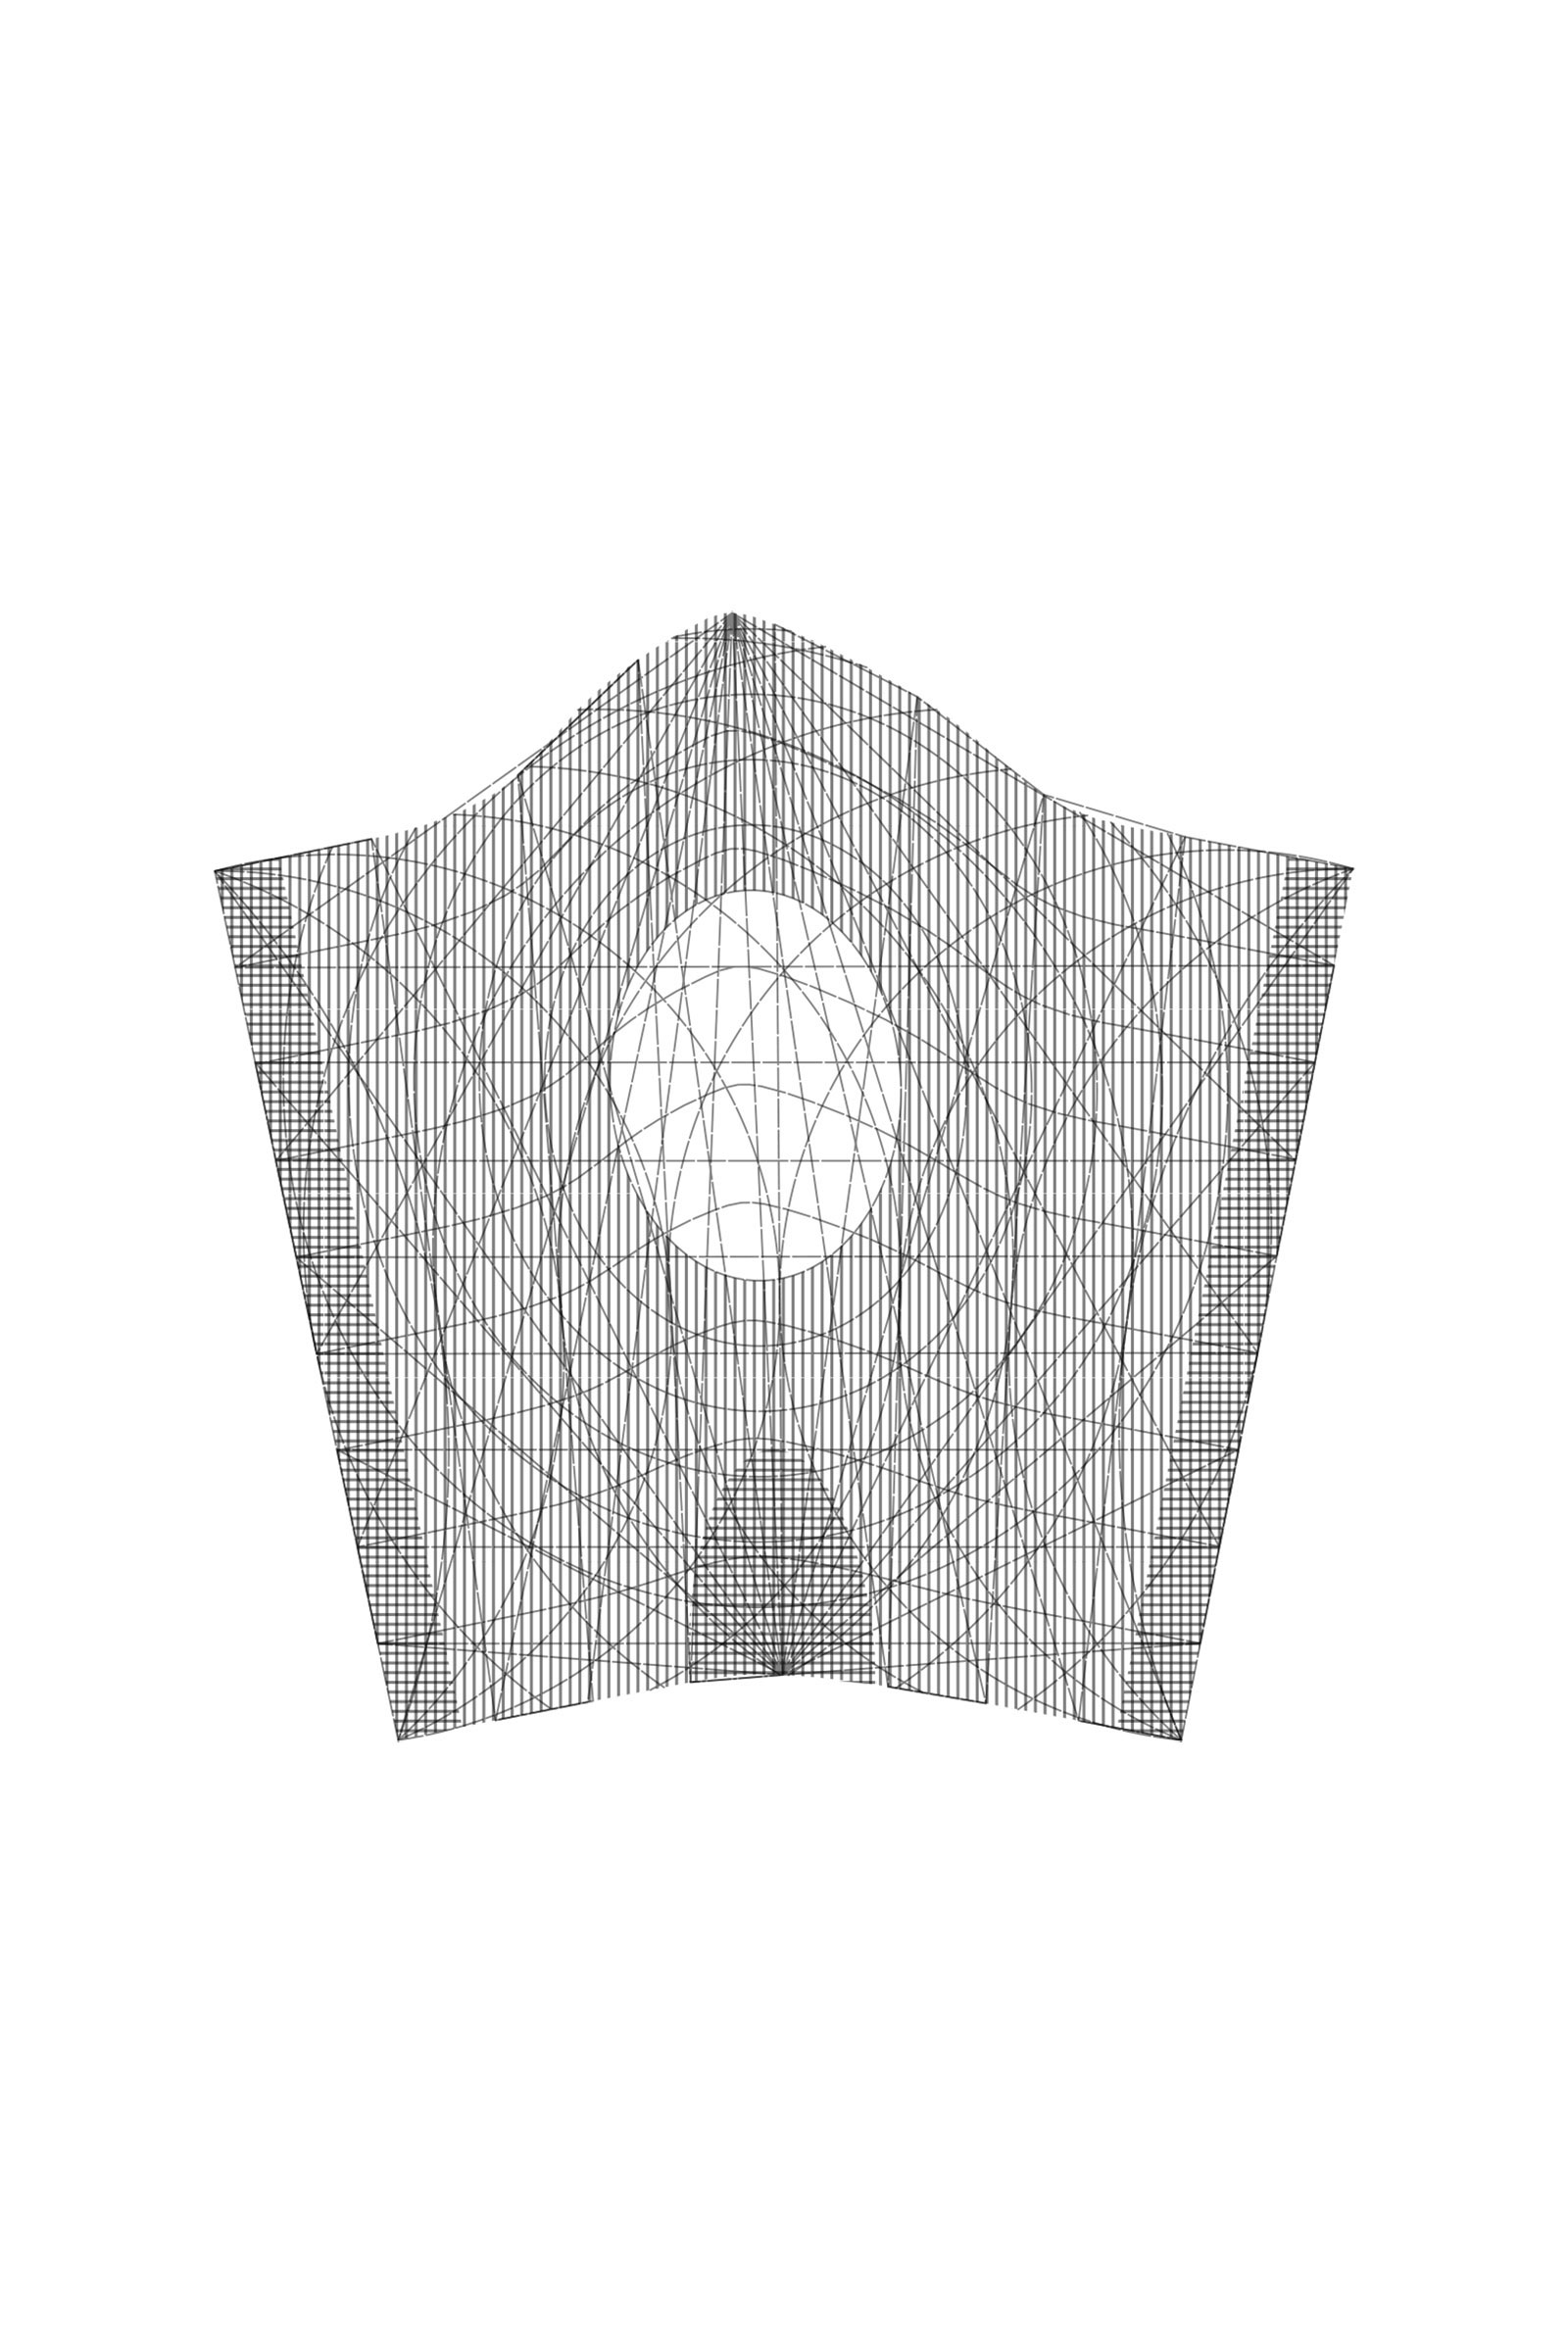
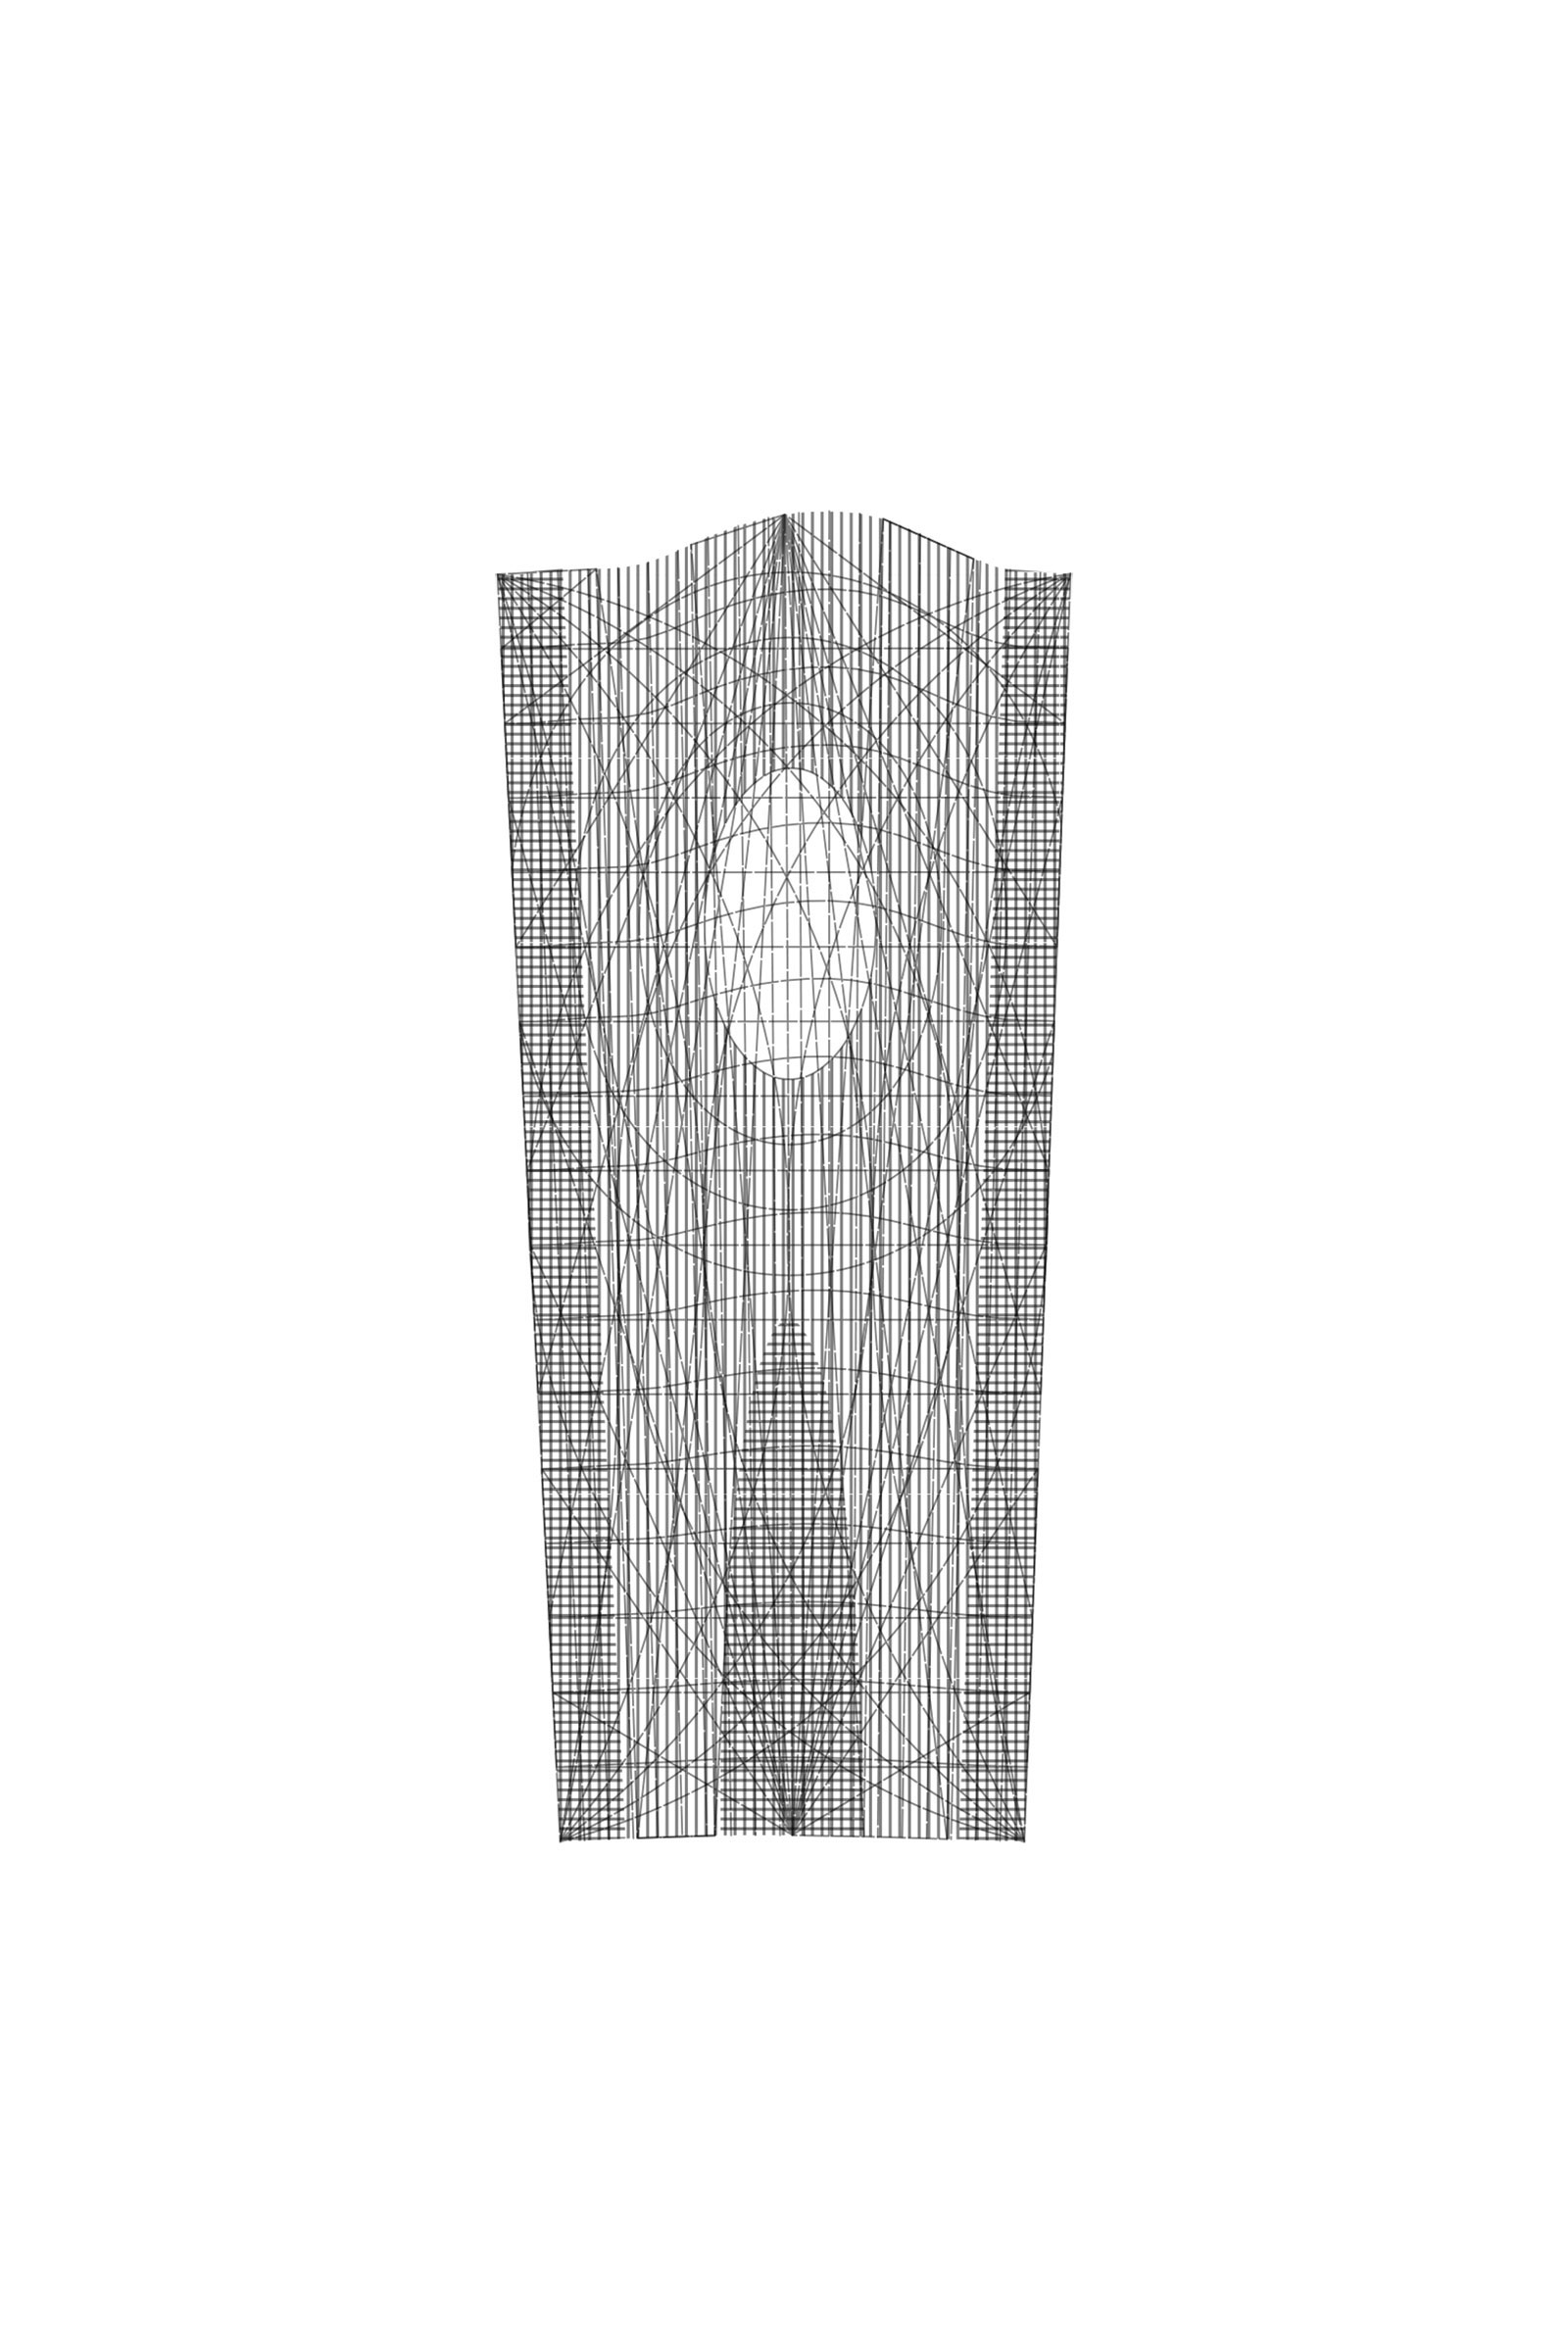
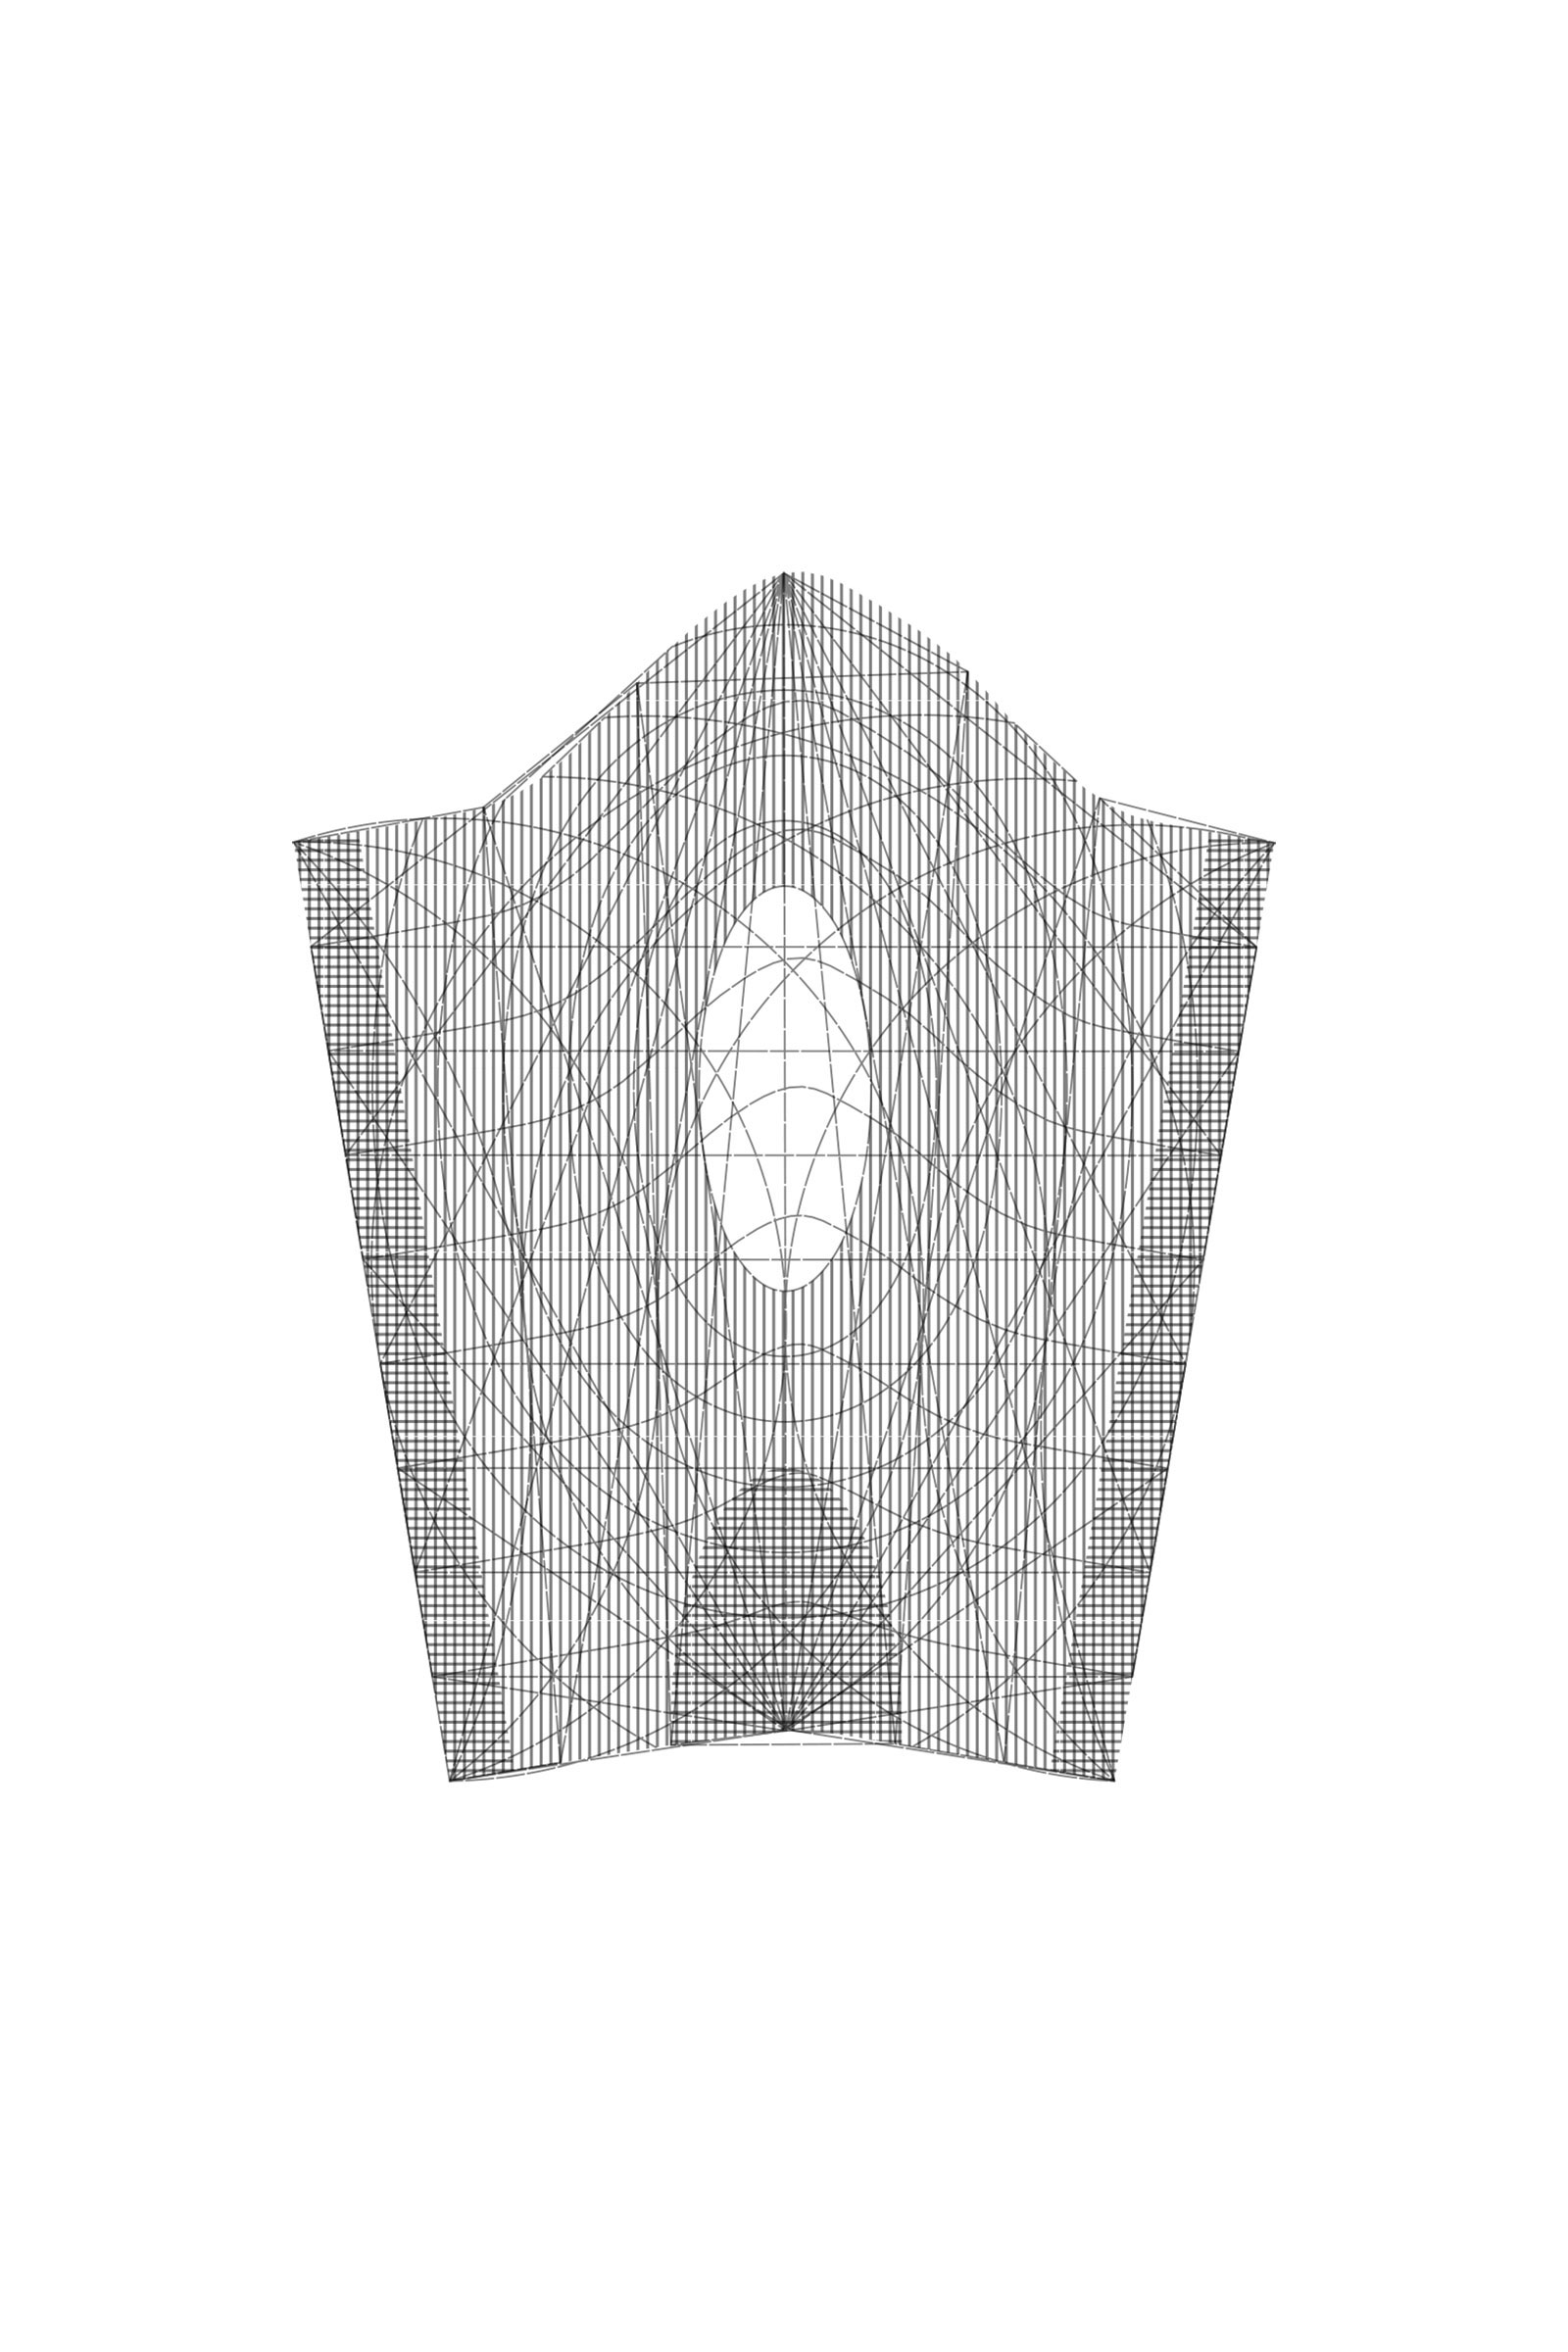
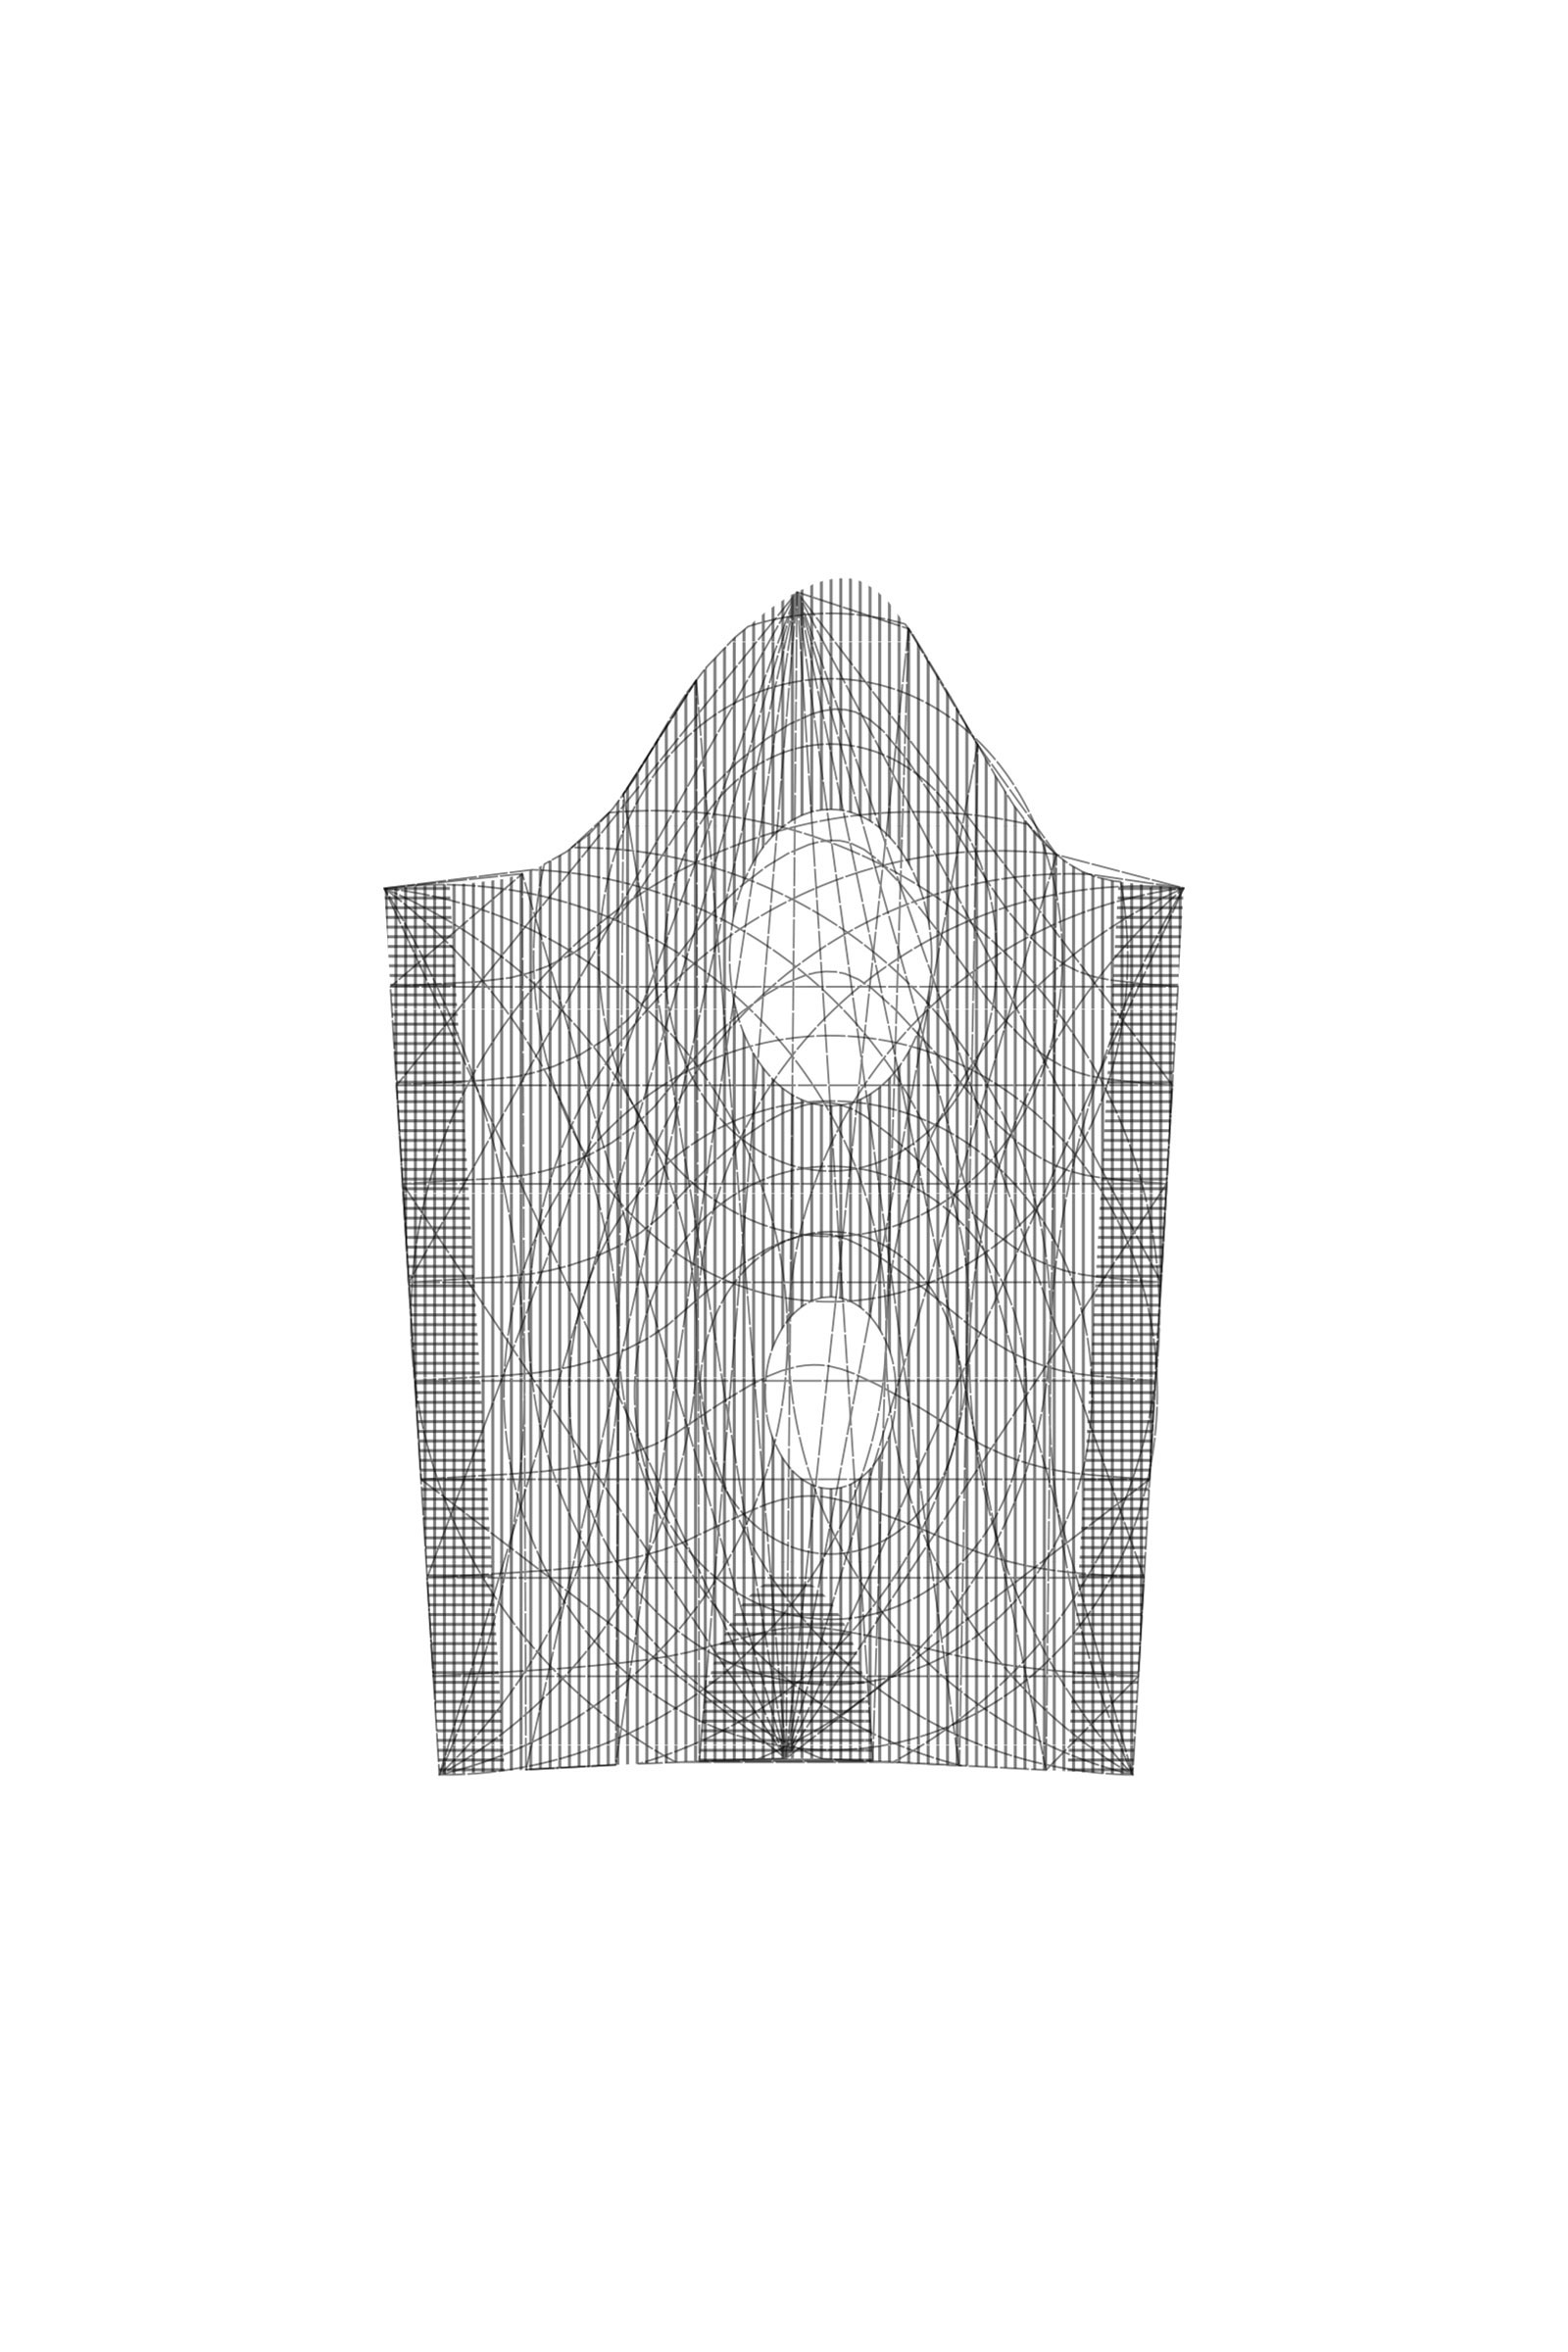
Figure II: Toolpaths from printed biopolymer sheets in set.
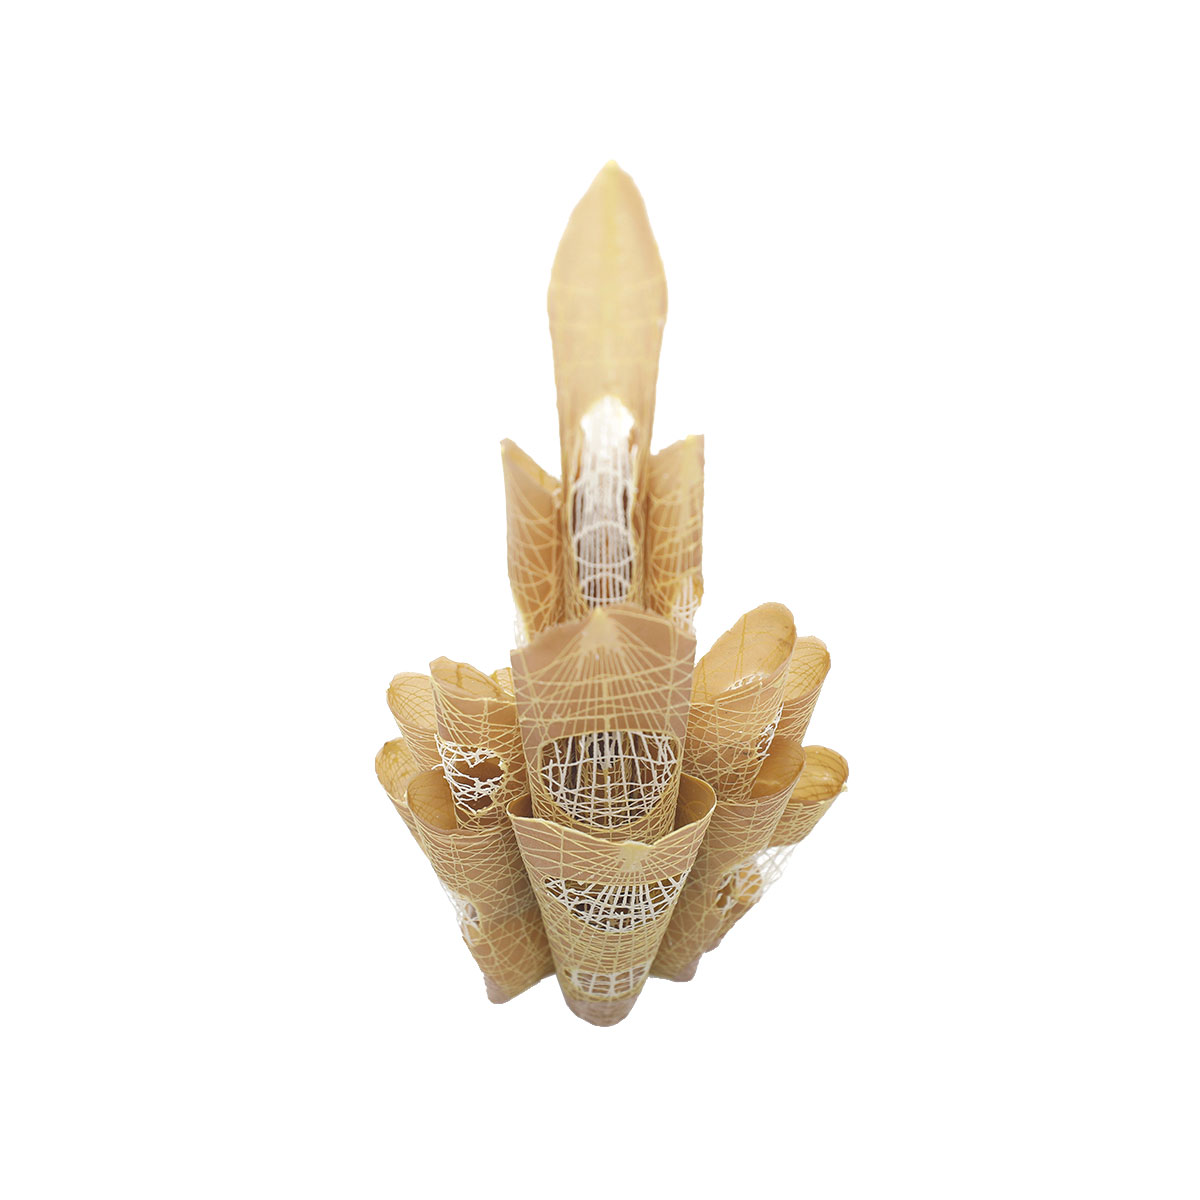
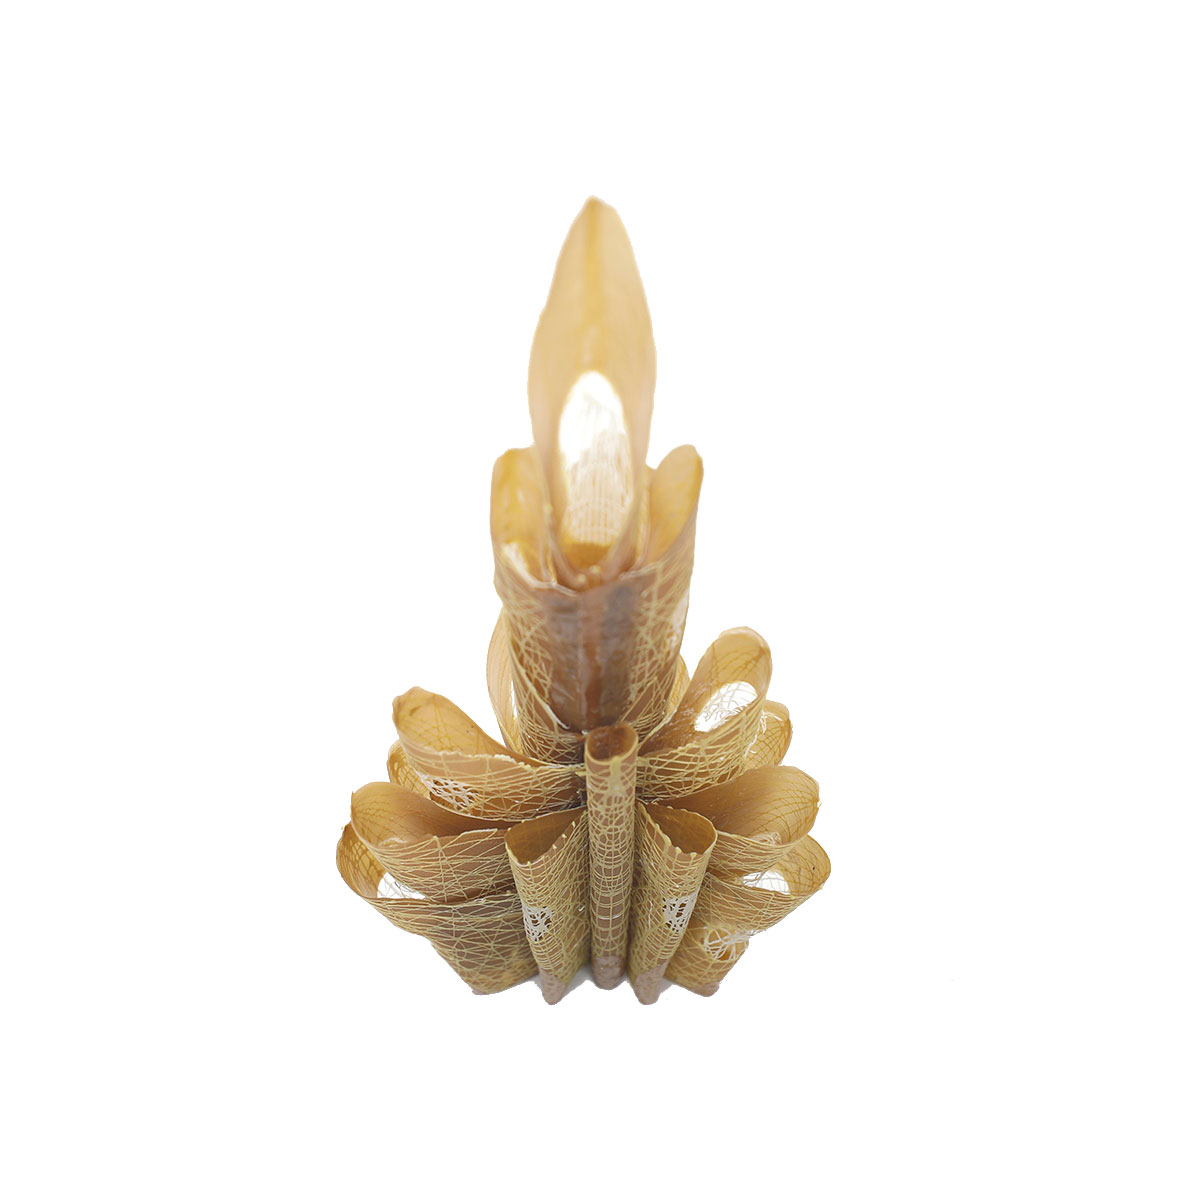
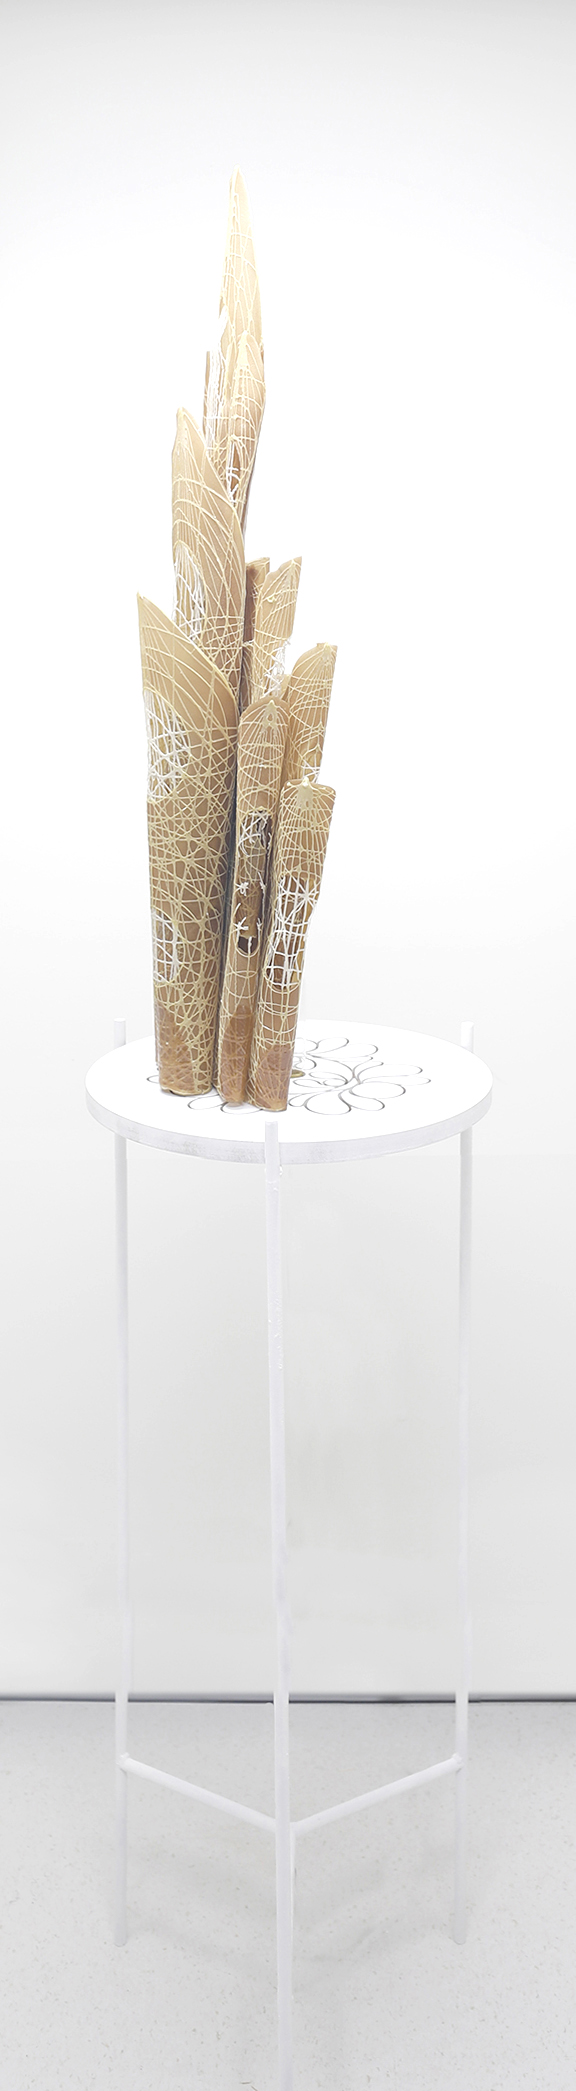
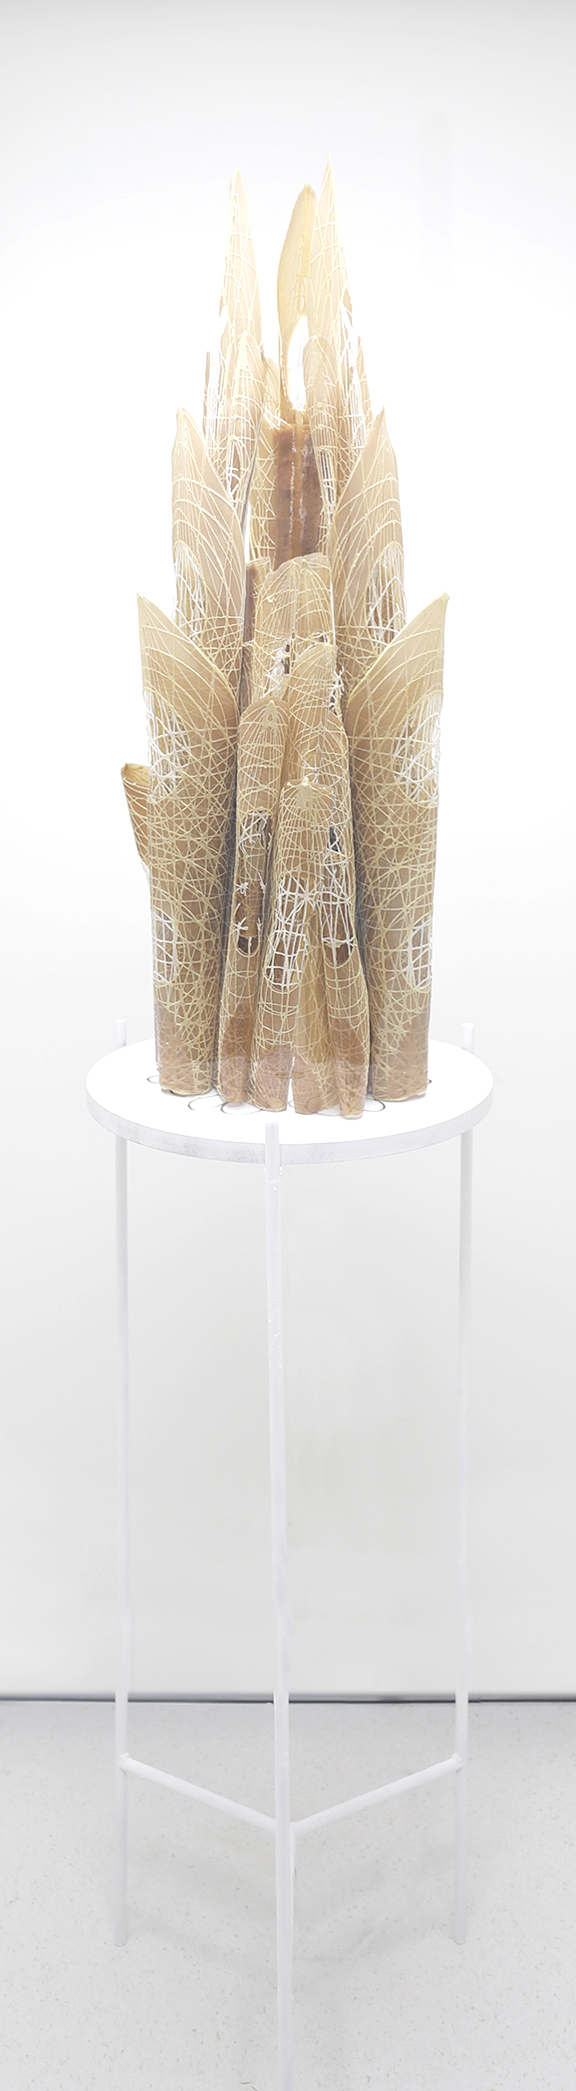
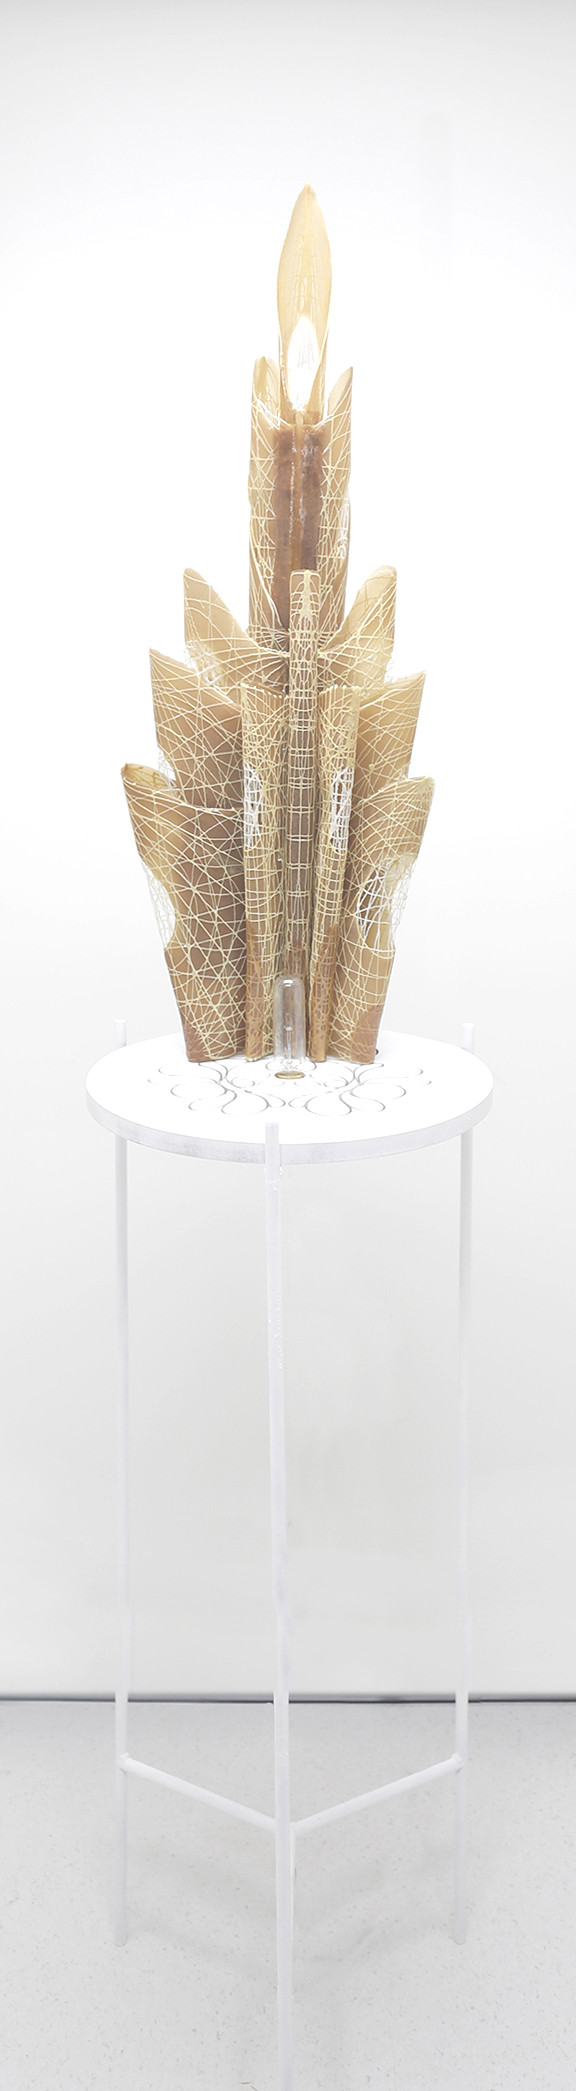
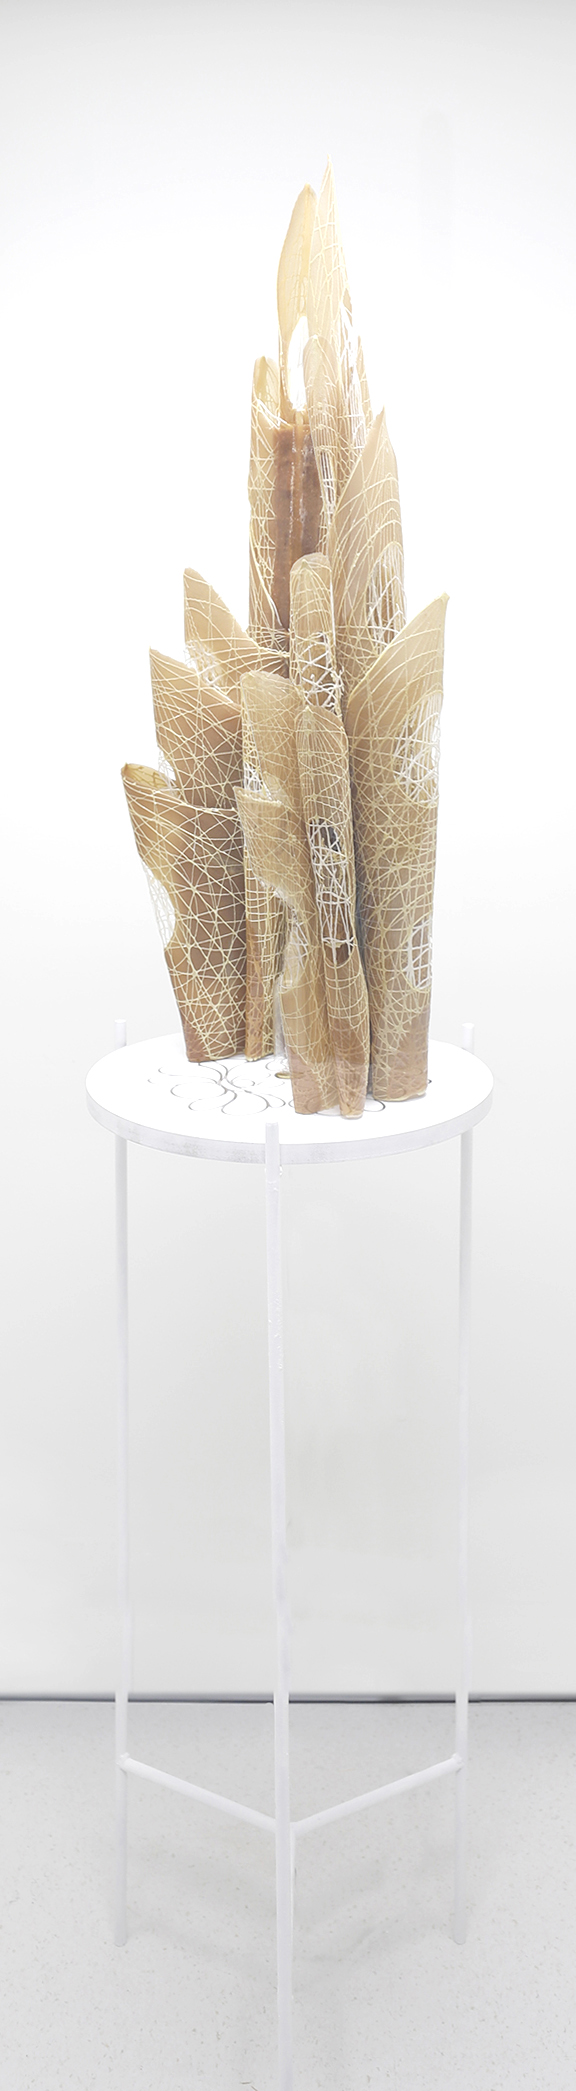
Figure III: A series of bilaterally symmetric prints are composed of a pectin chitosan infill base layer with a cellulose lattice surface layer. The center lines of each print have a region of pectin infill printed above the cellulose lattice.
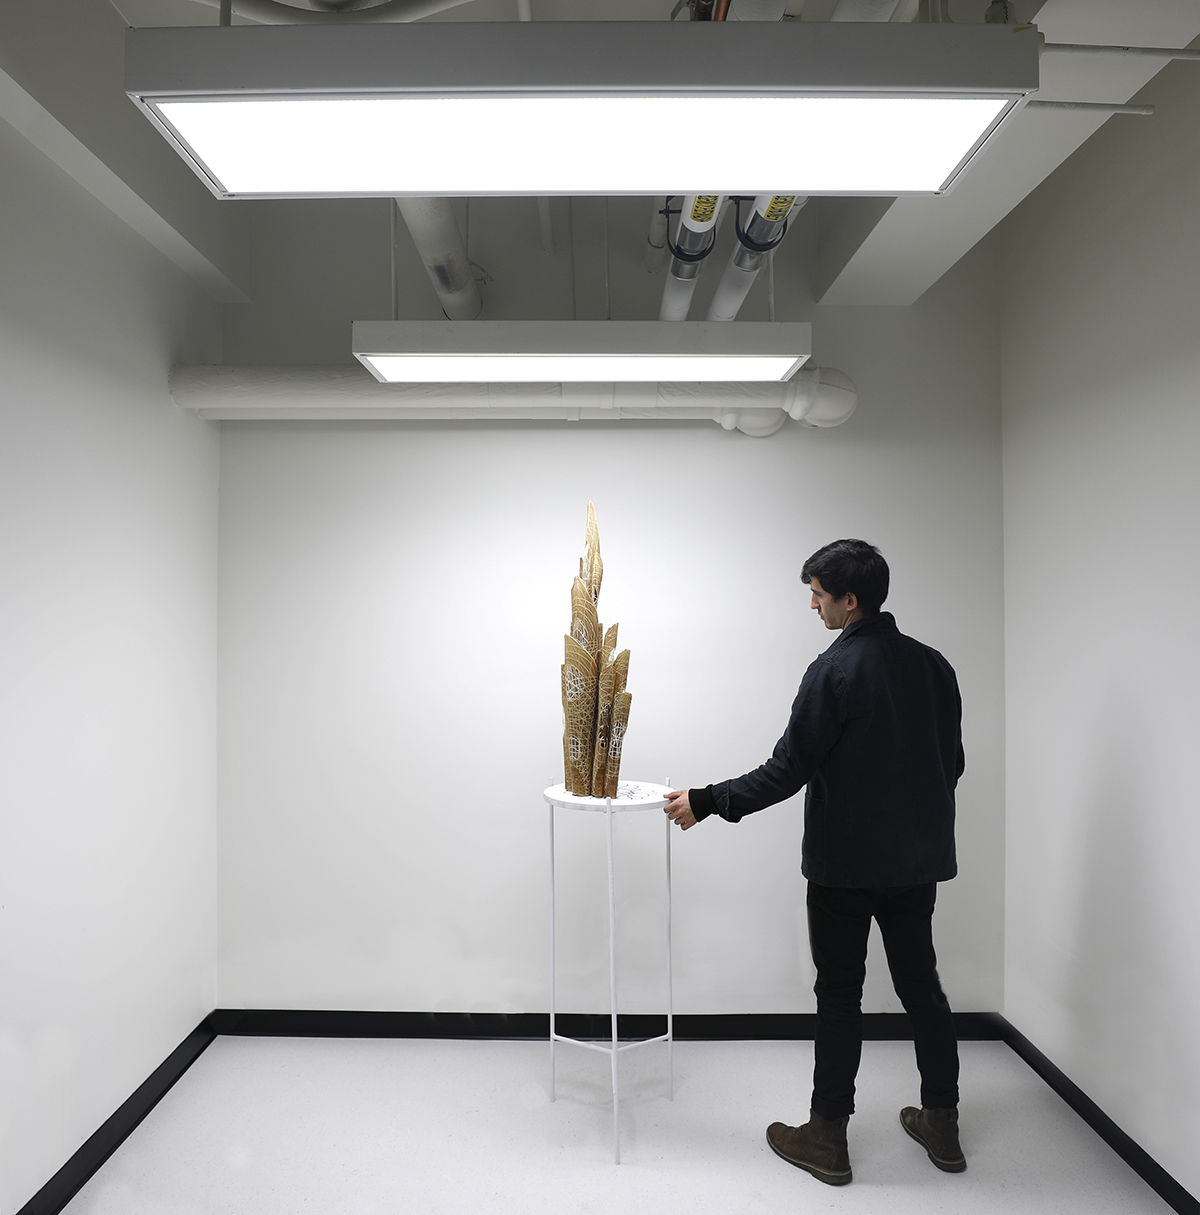
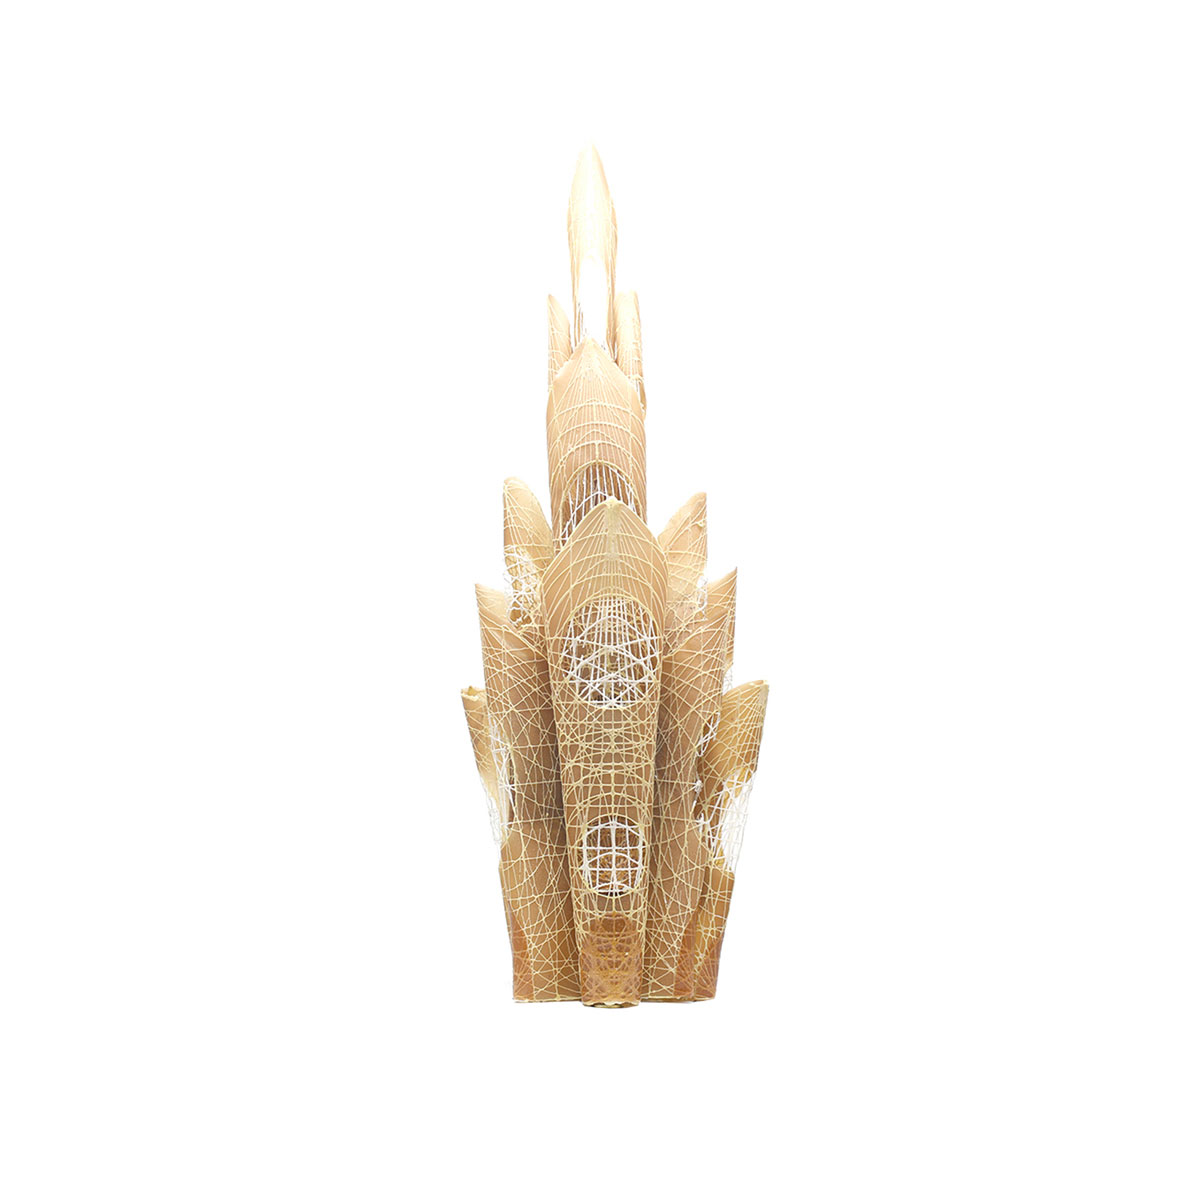
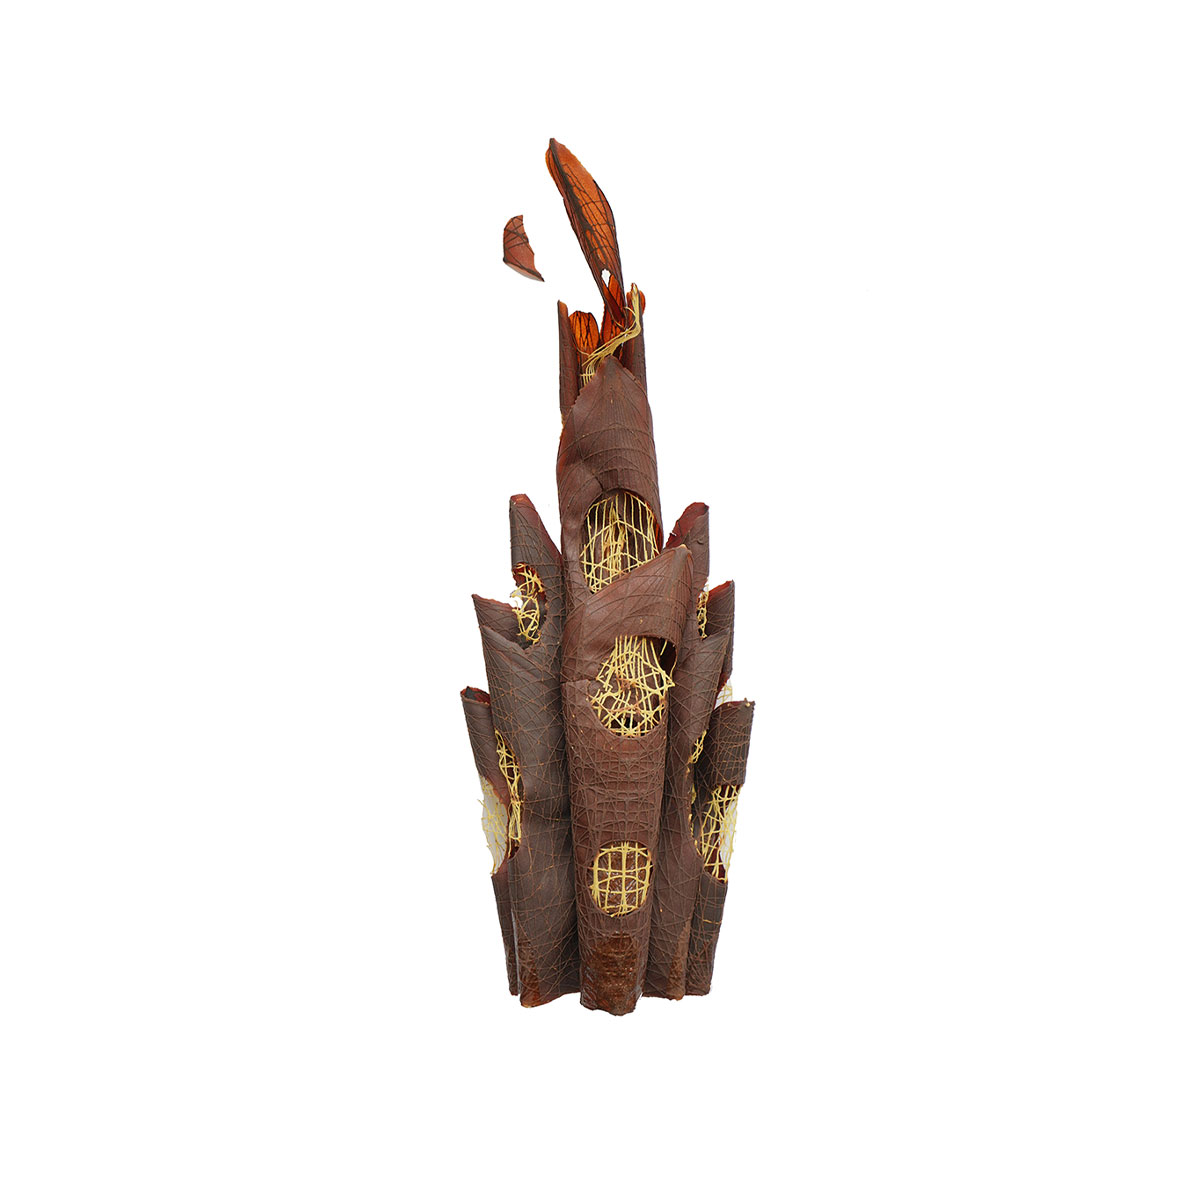
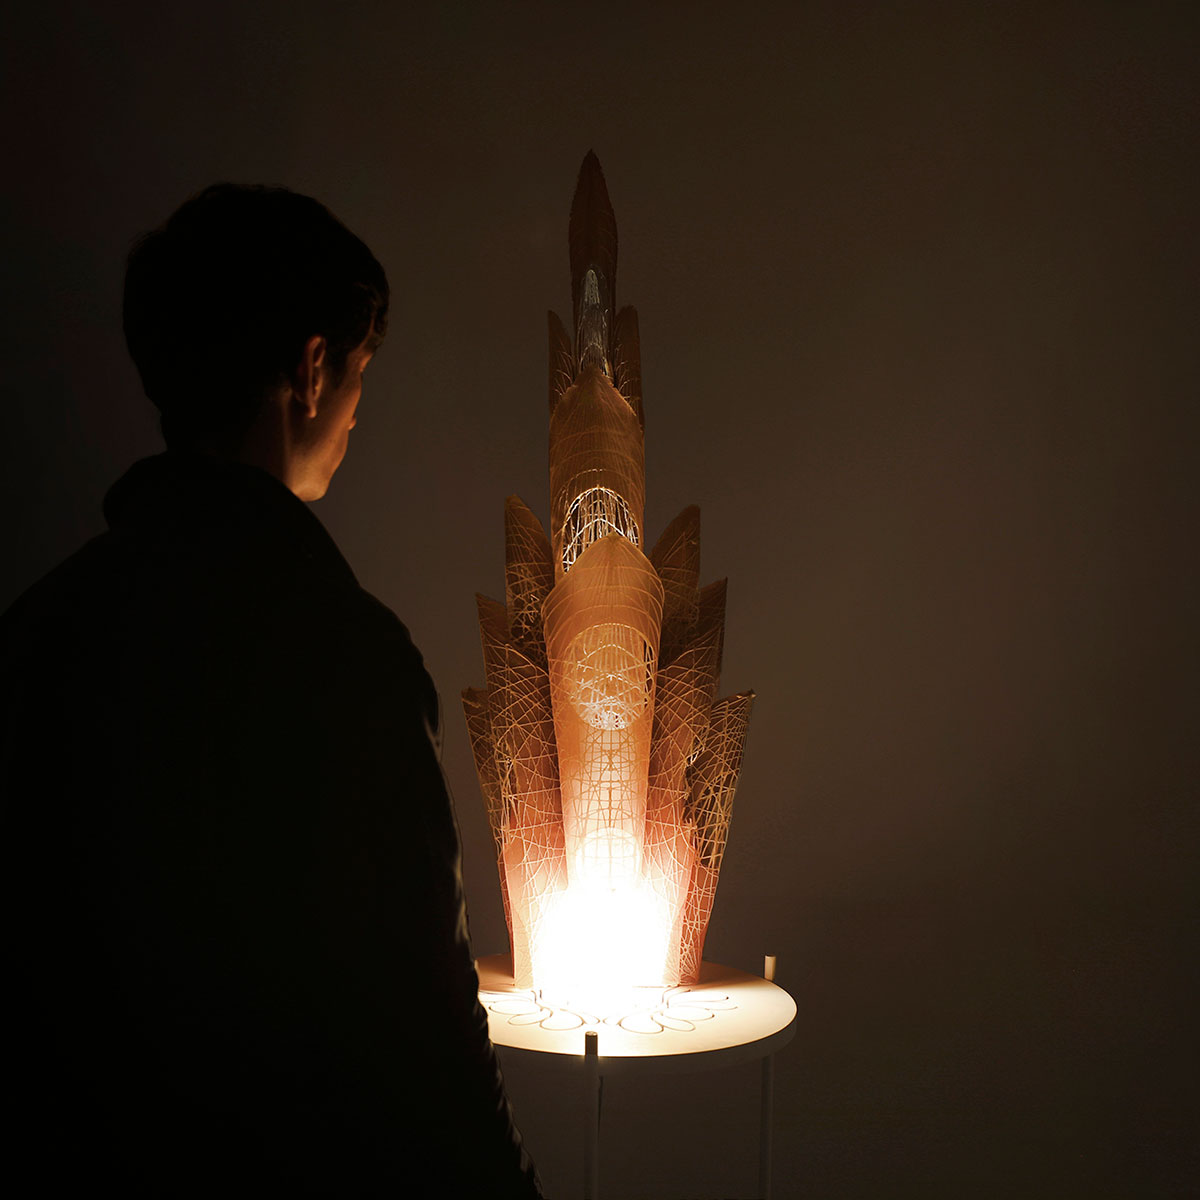
Figure IV: A set of 10 different prints are clamped along the wetted central pectin spine to adhere all surfaces together. The edges of each of these surfaces are exposed to a humidifier and folded into adjacent surfaces.
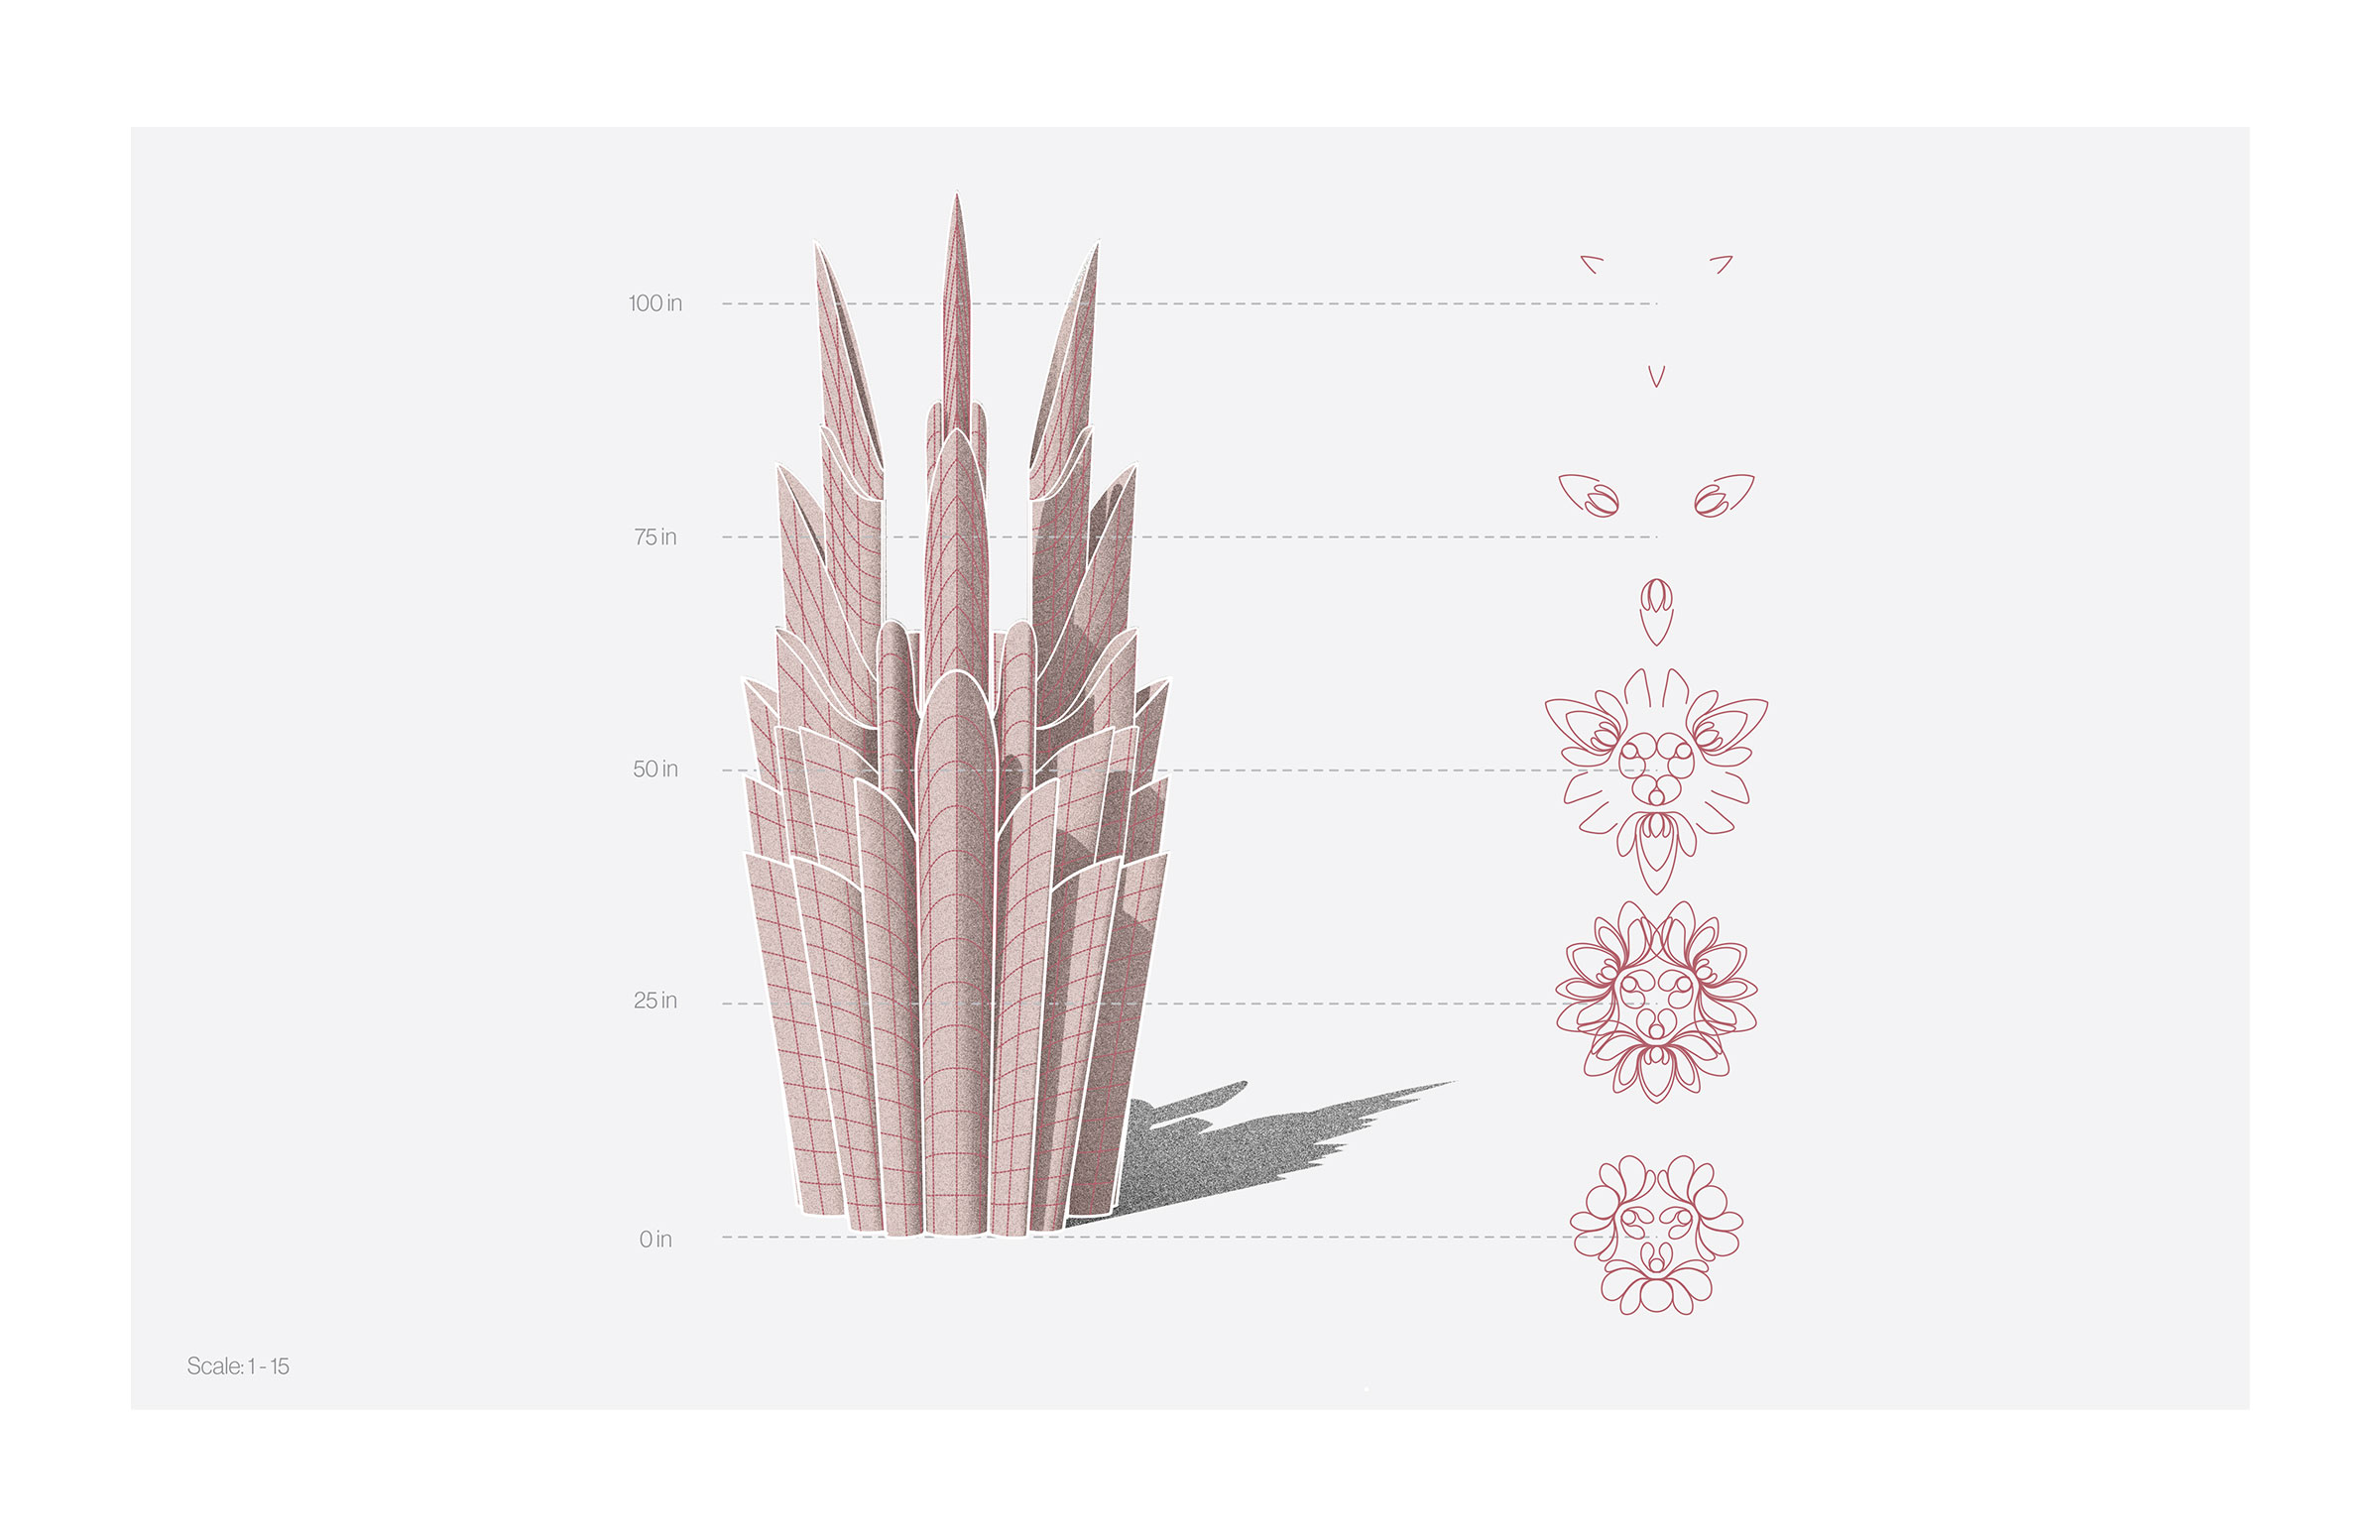
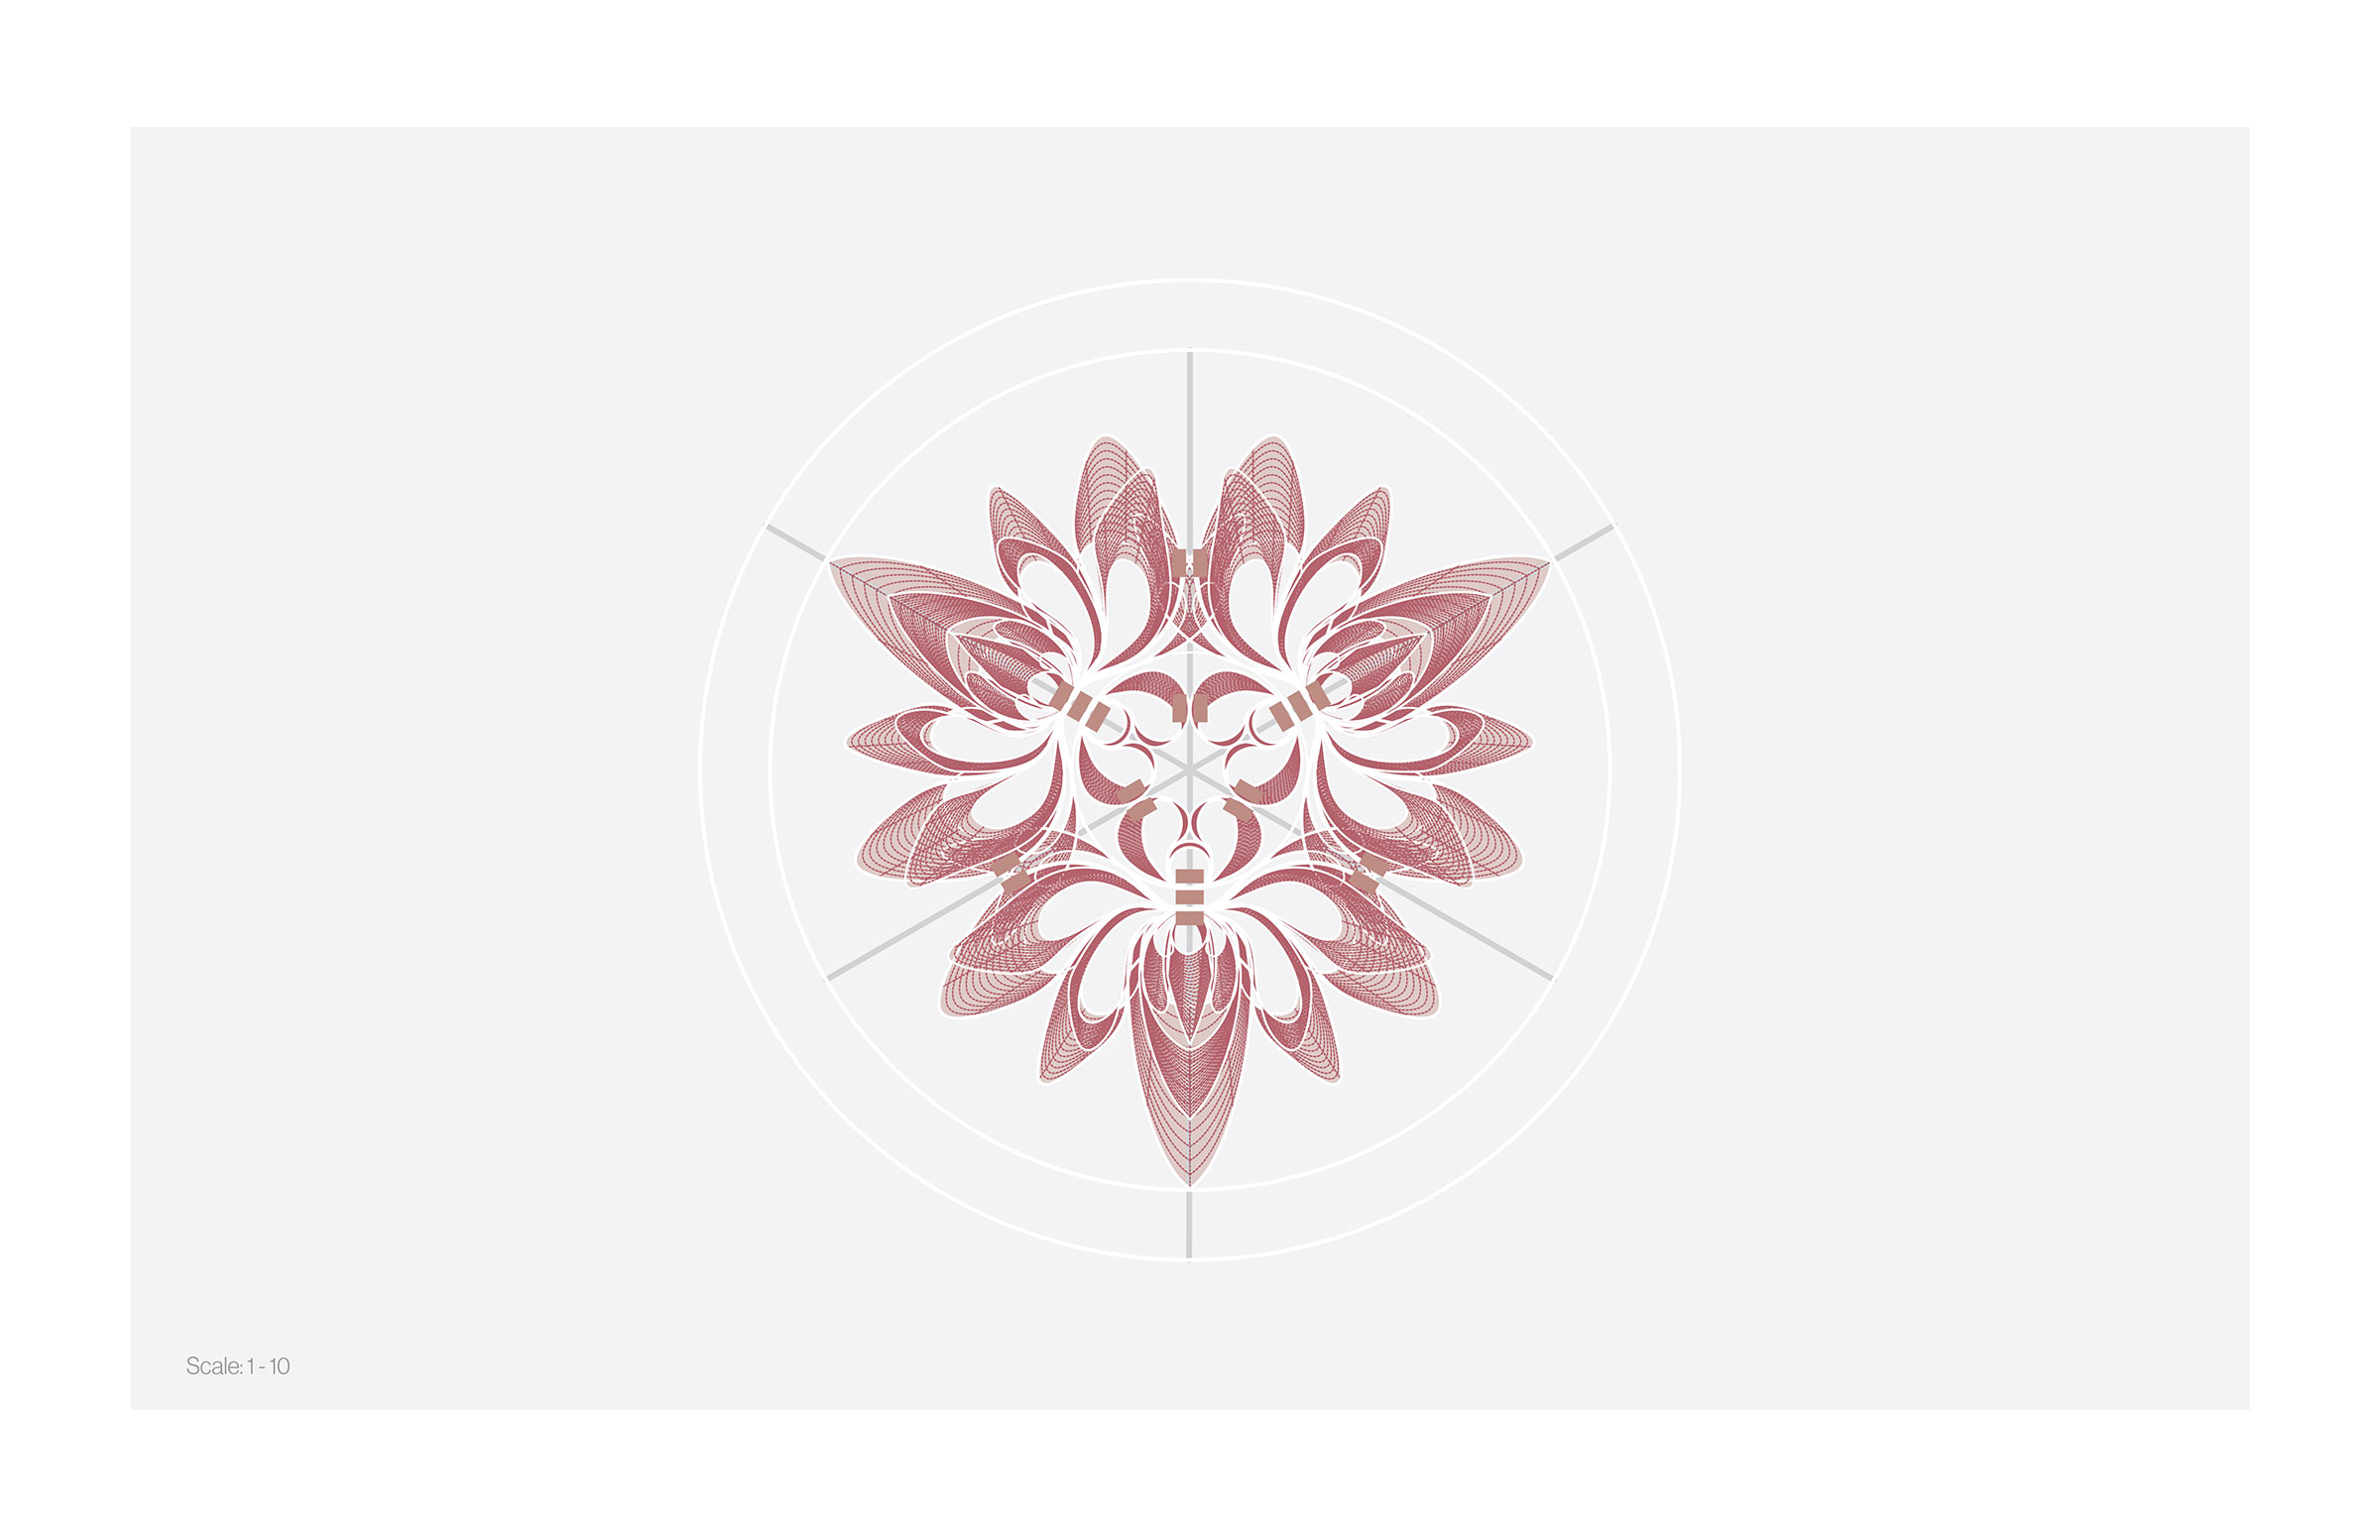
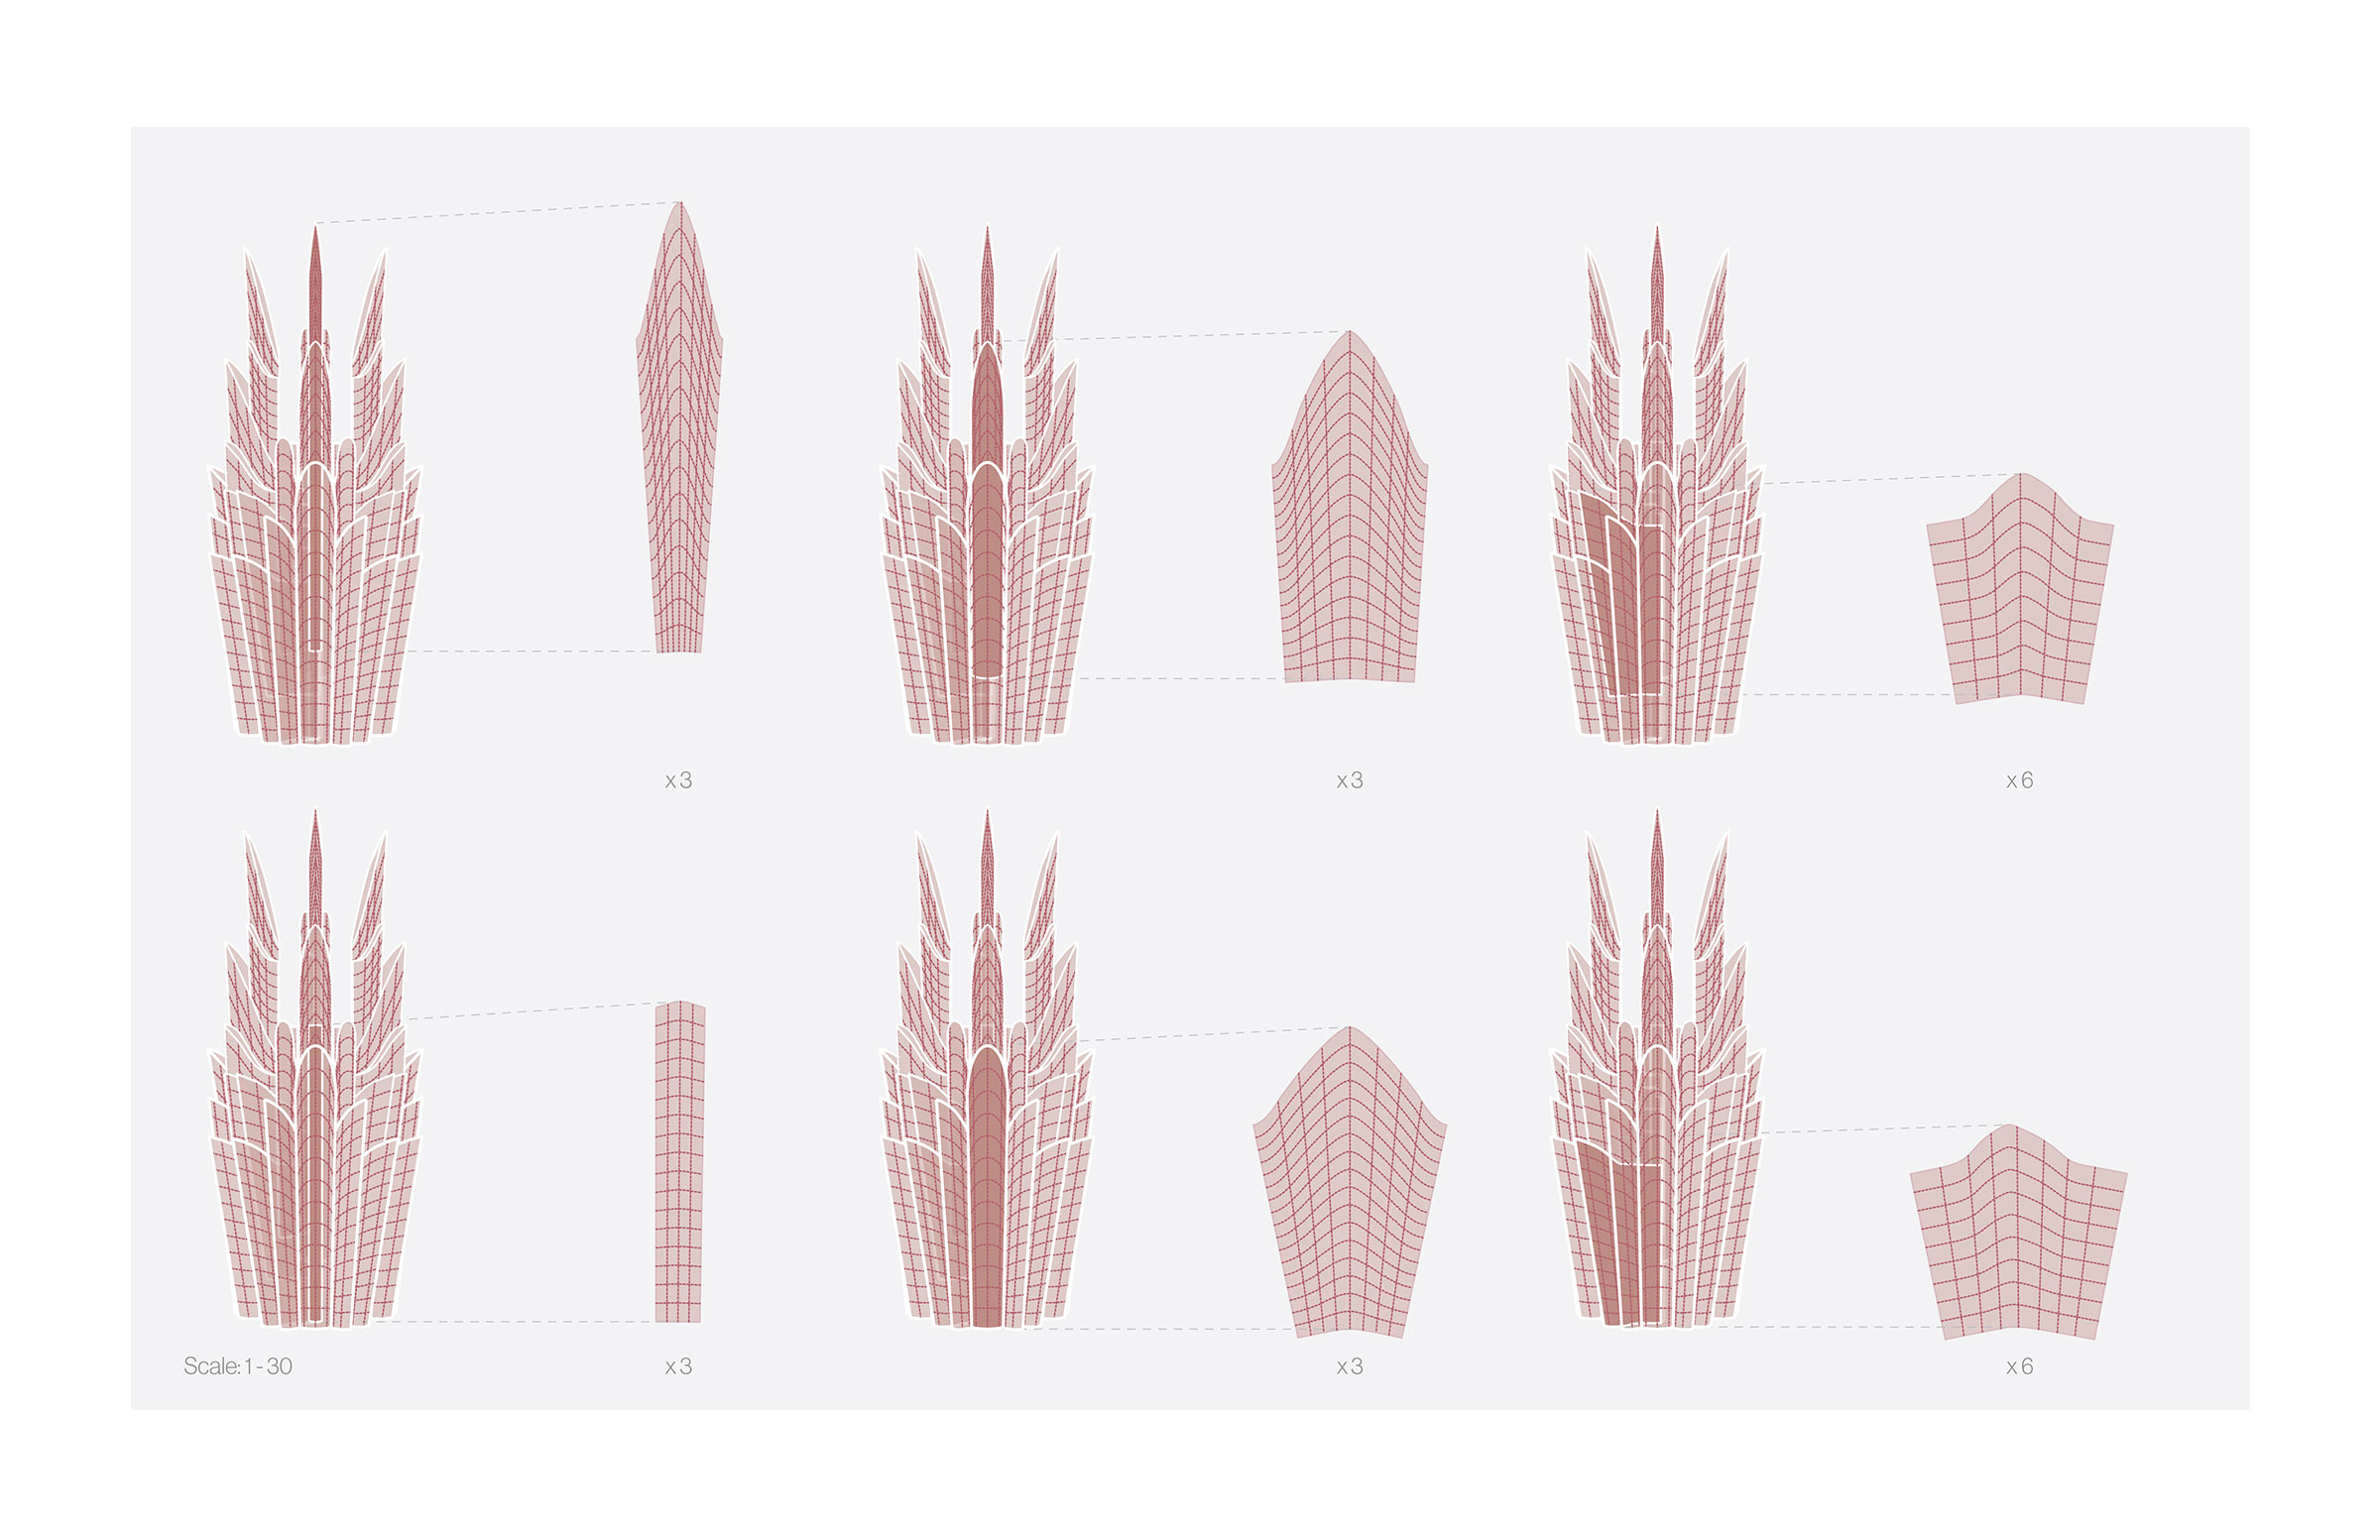
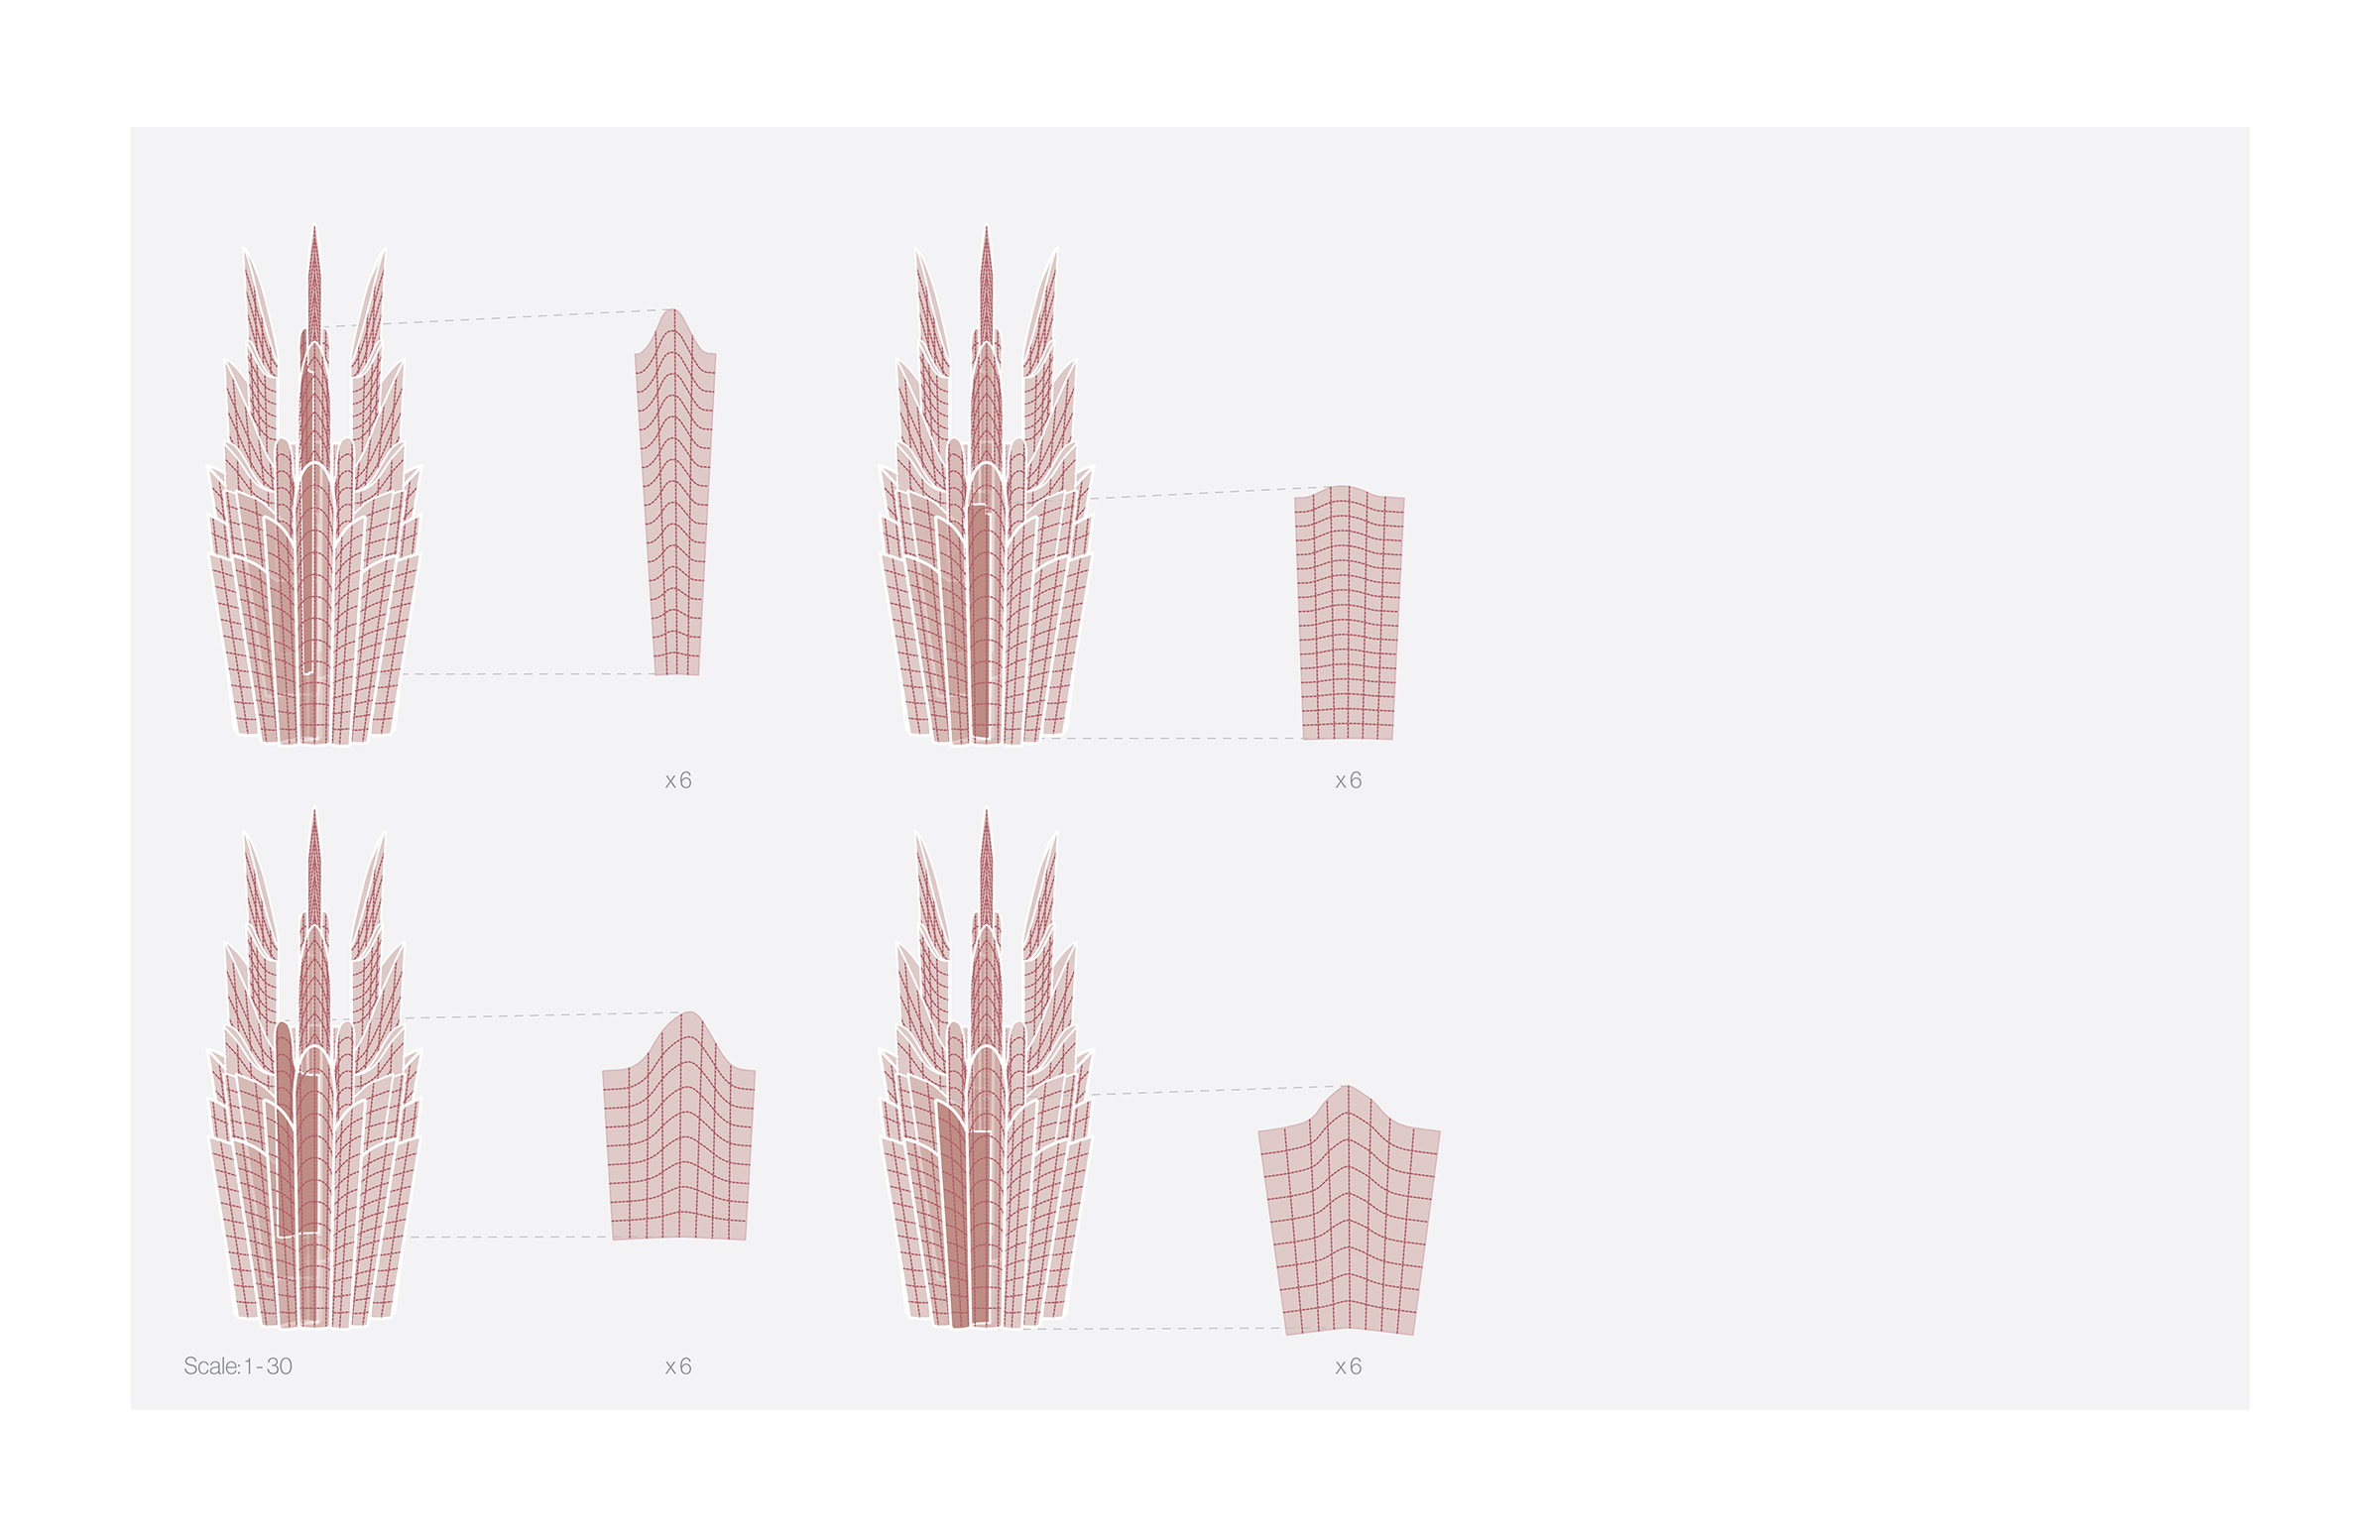
Figure V: Renderings and drawings of folded biopolymer schematic design.
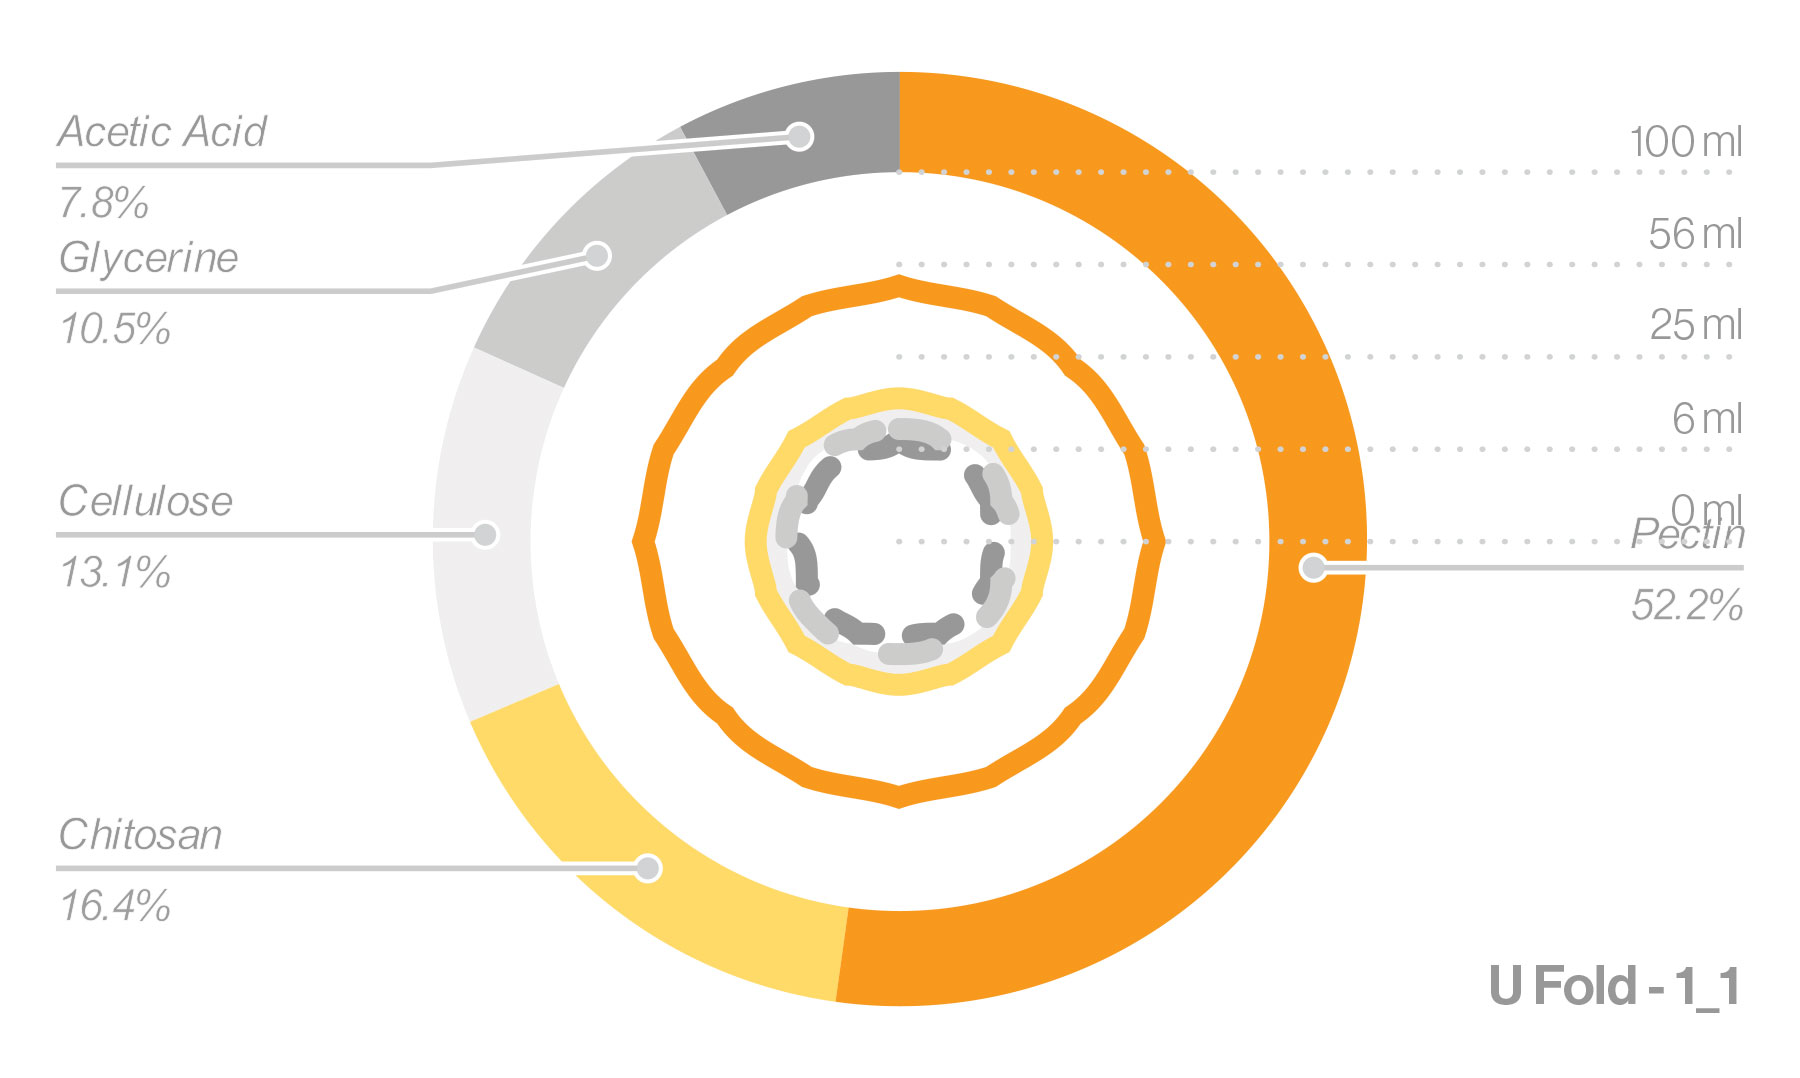
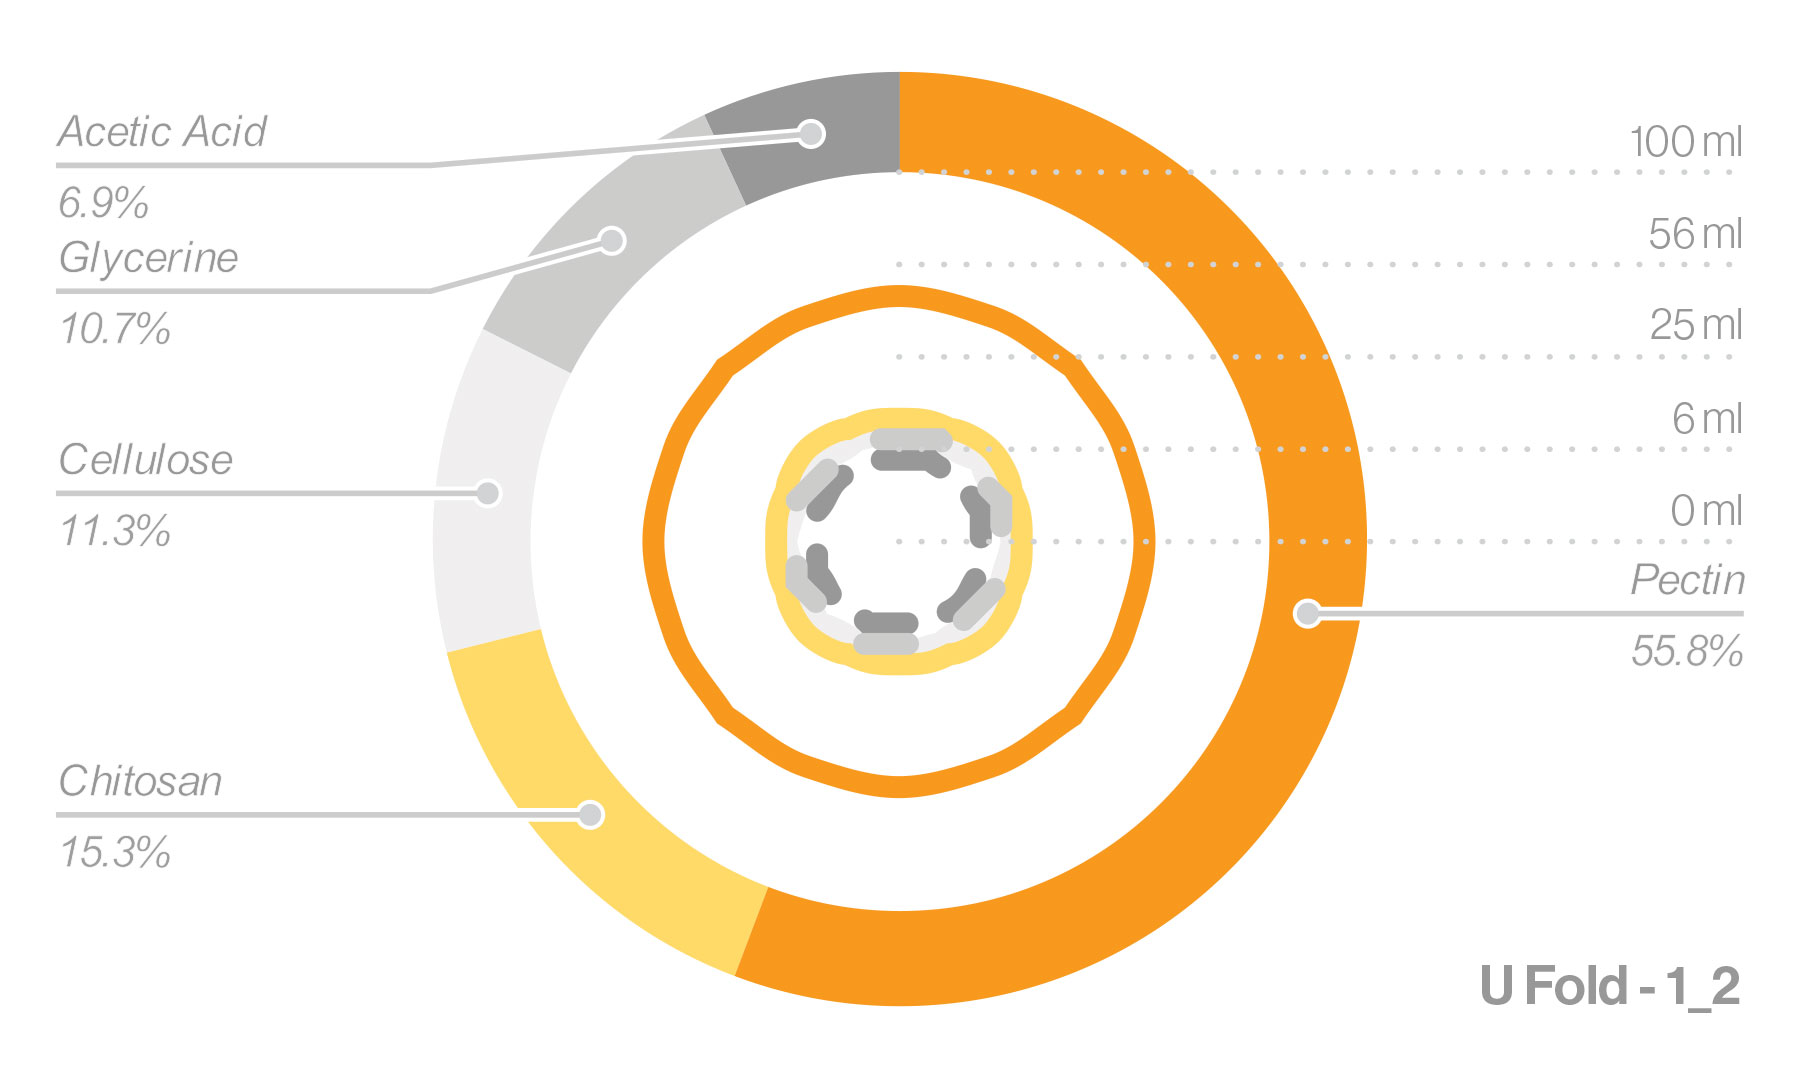

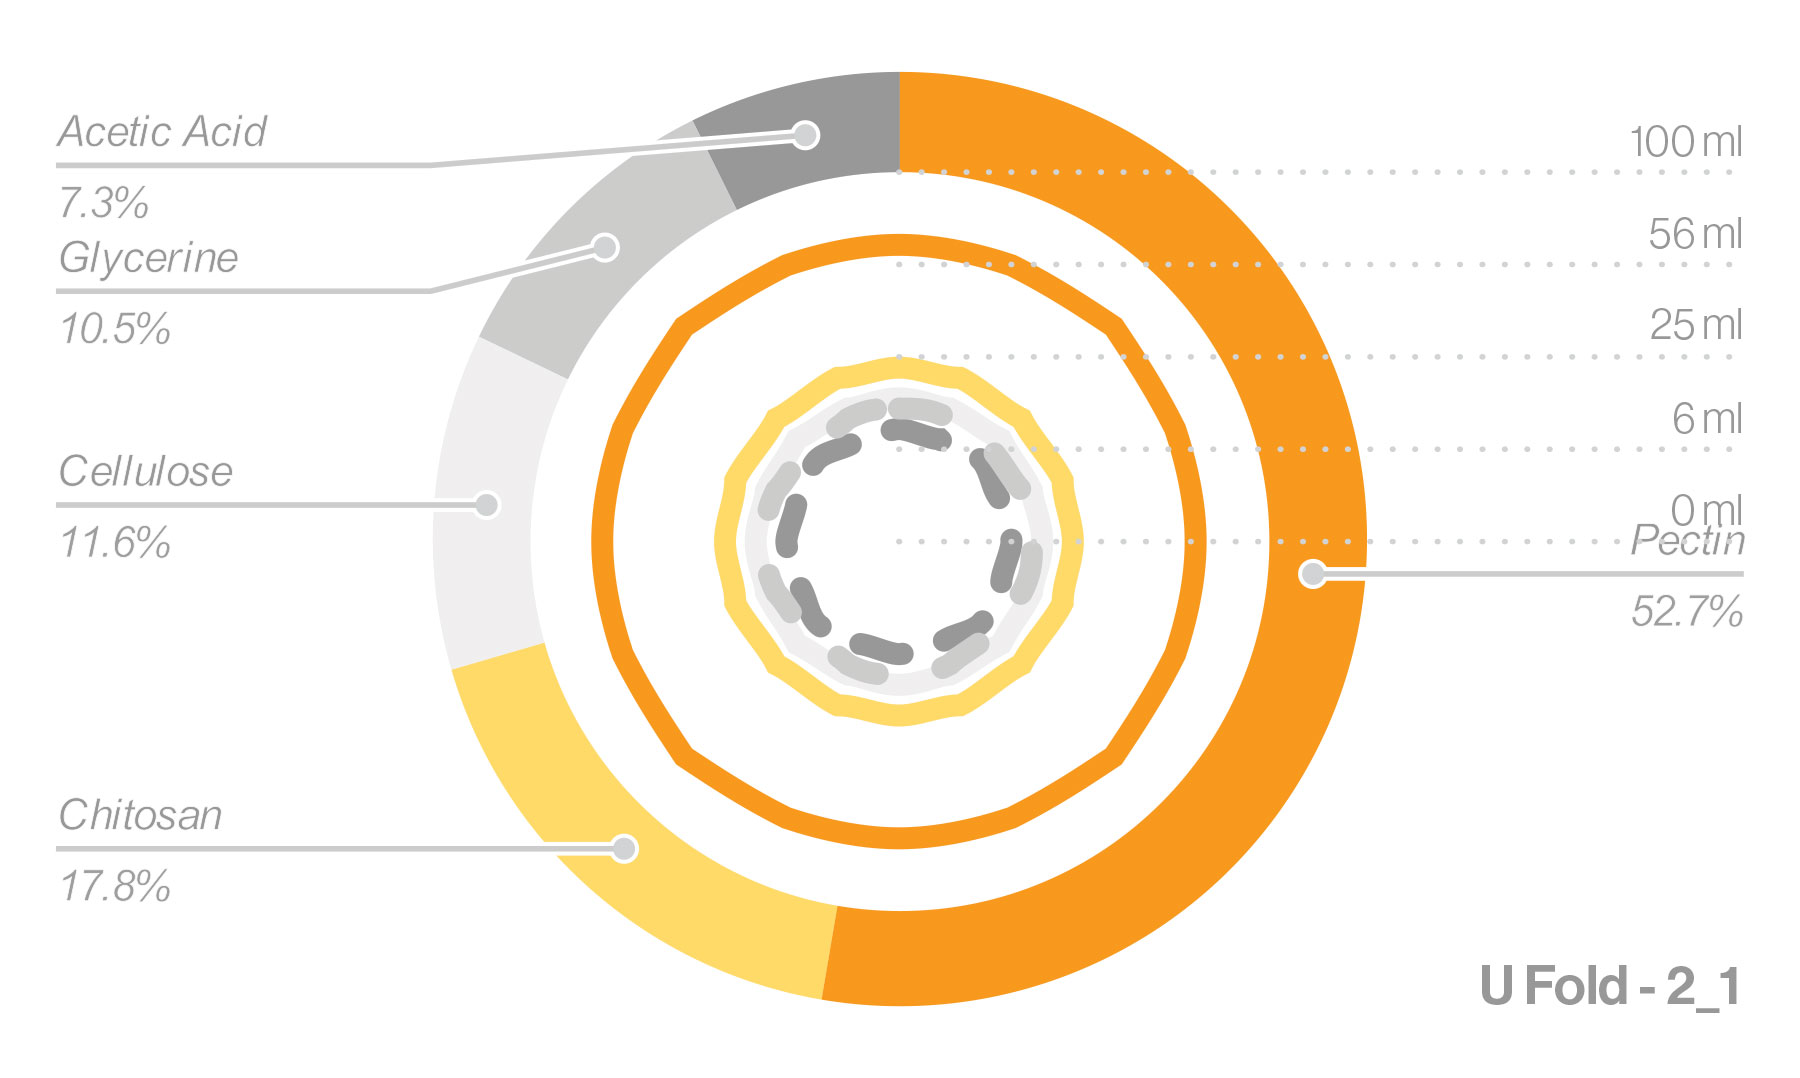
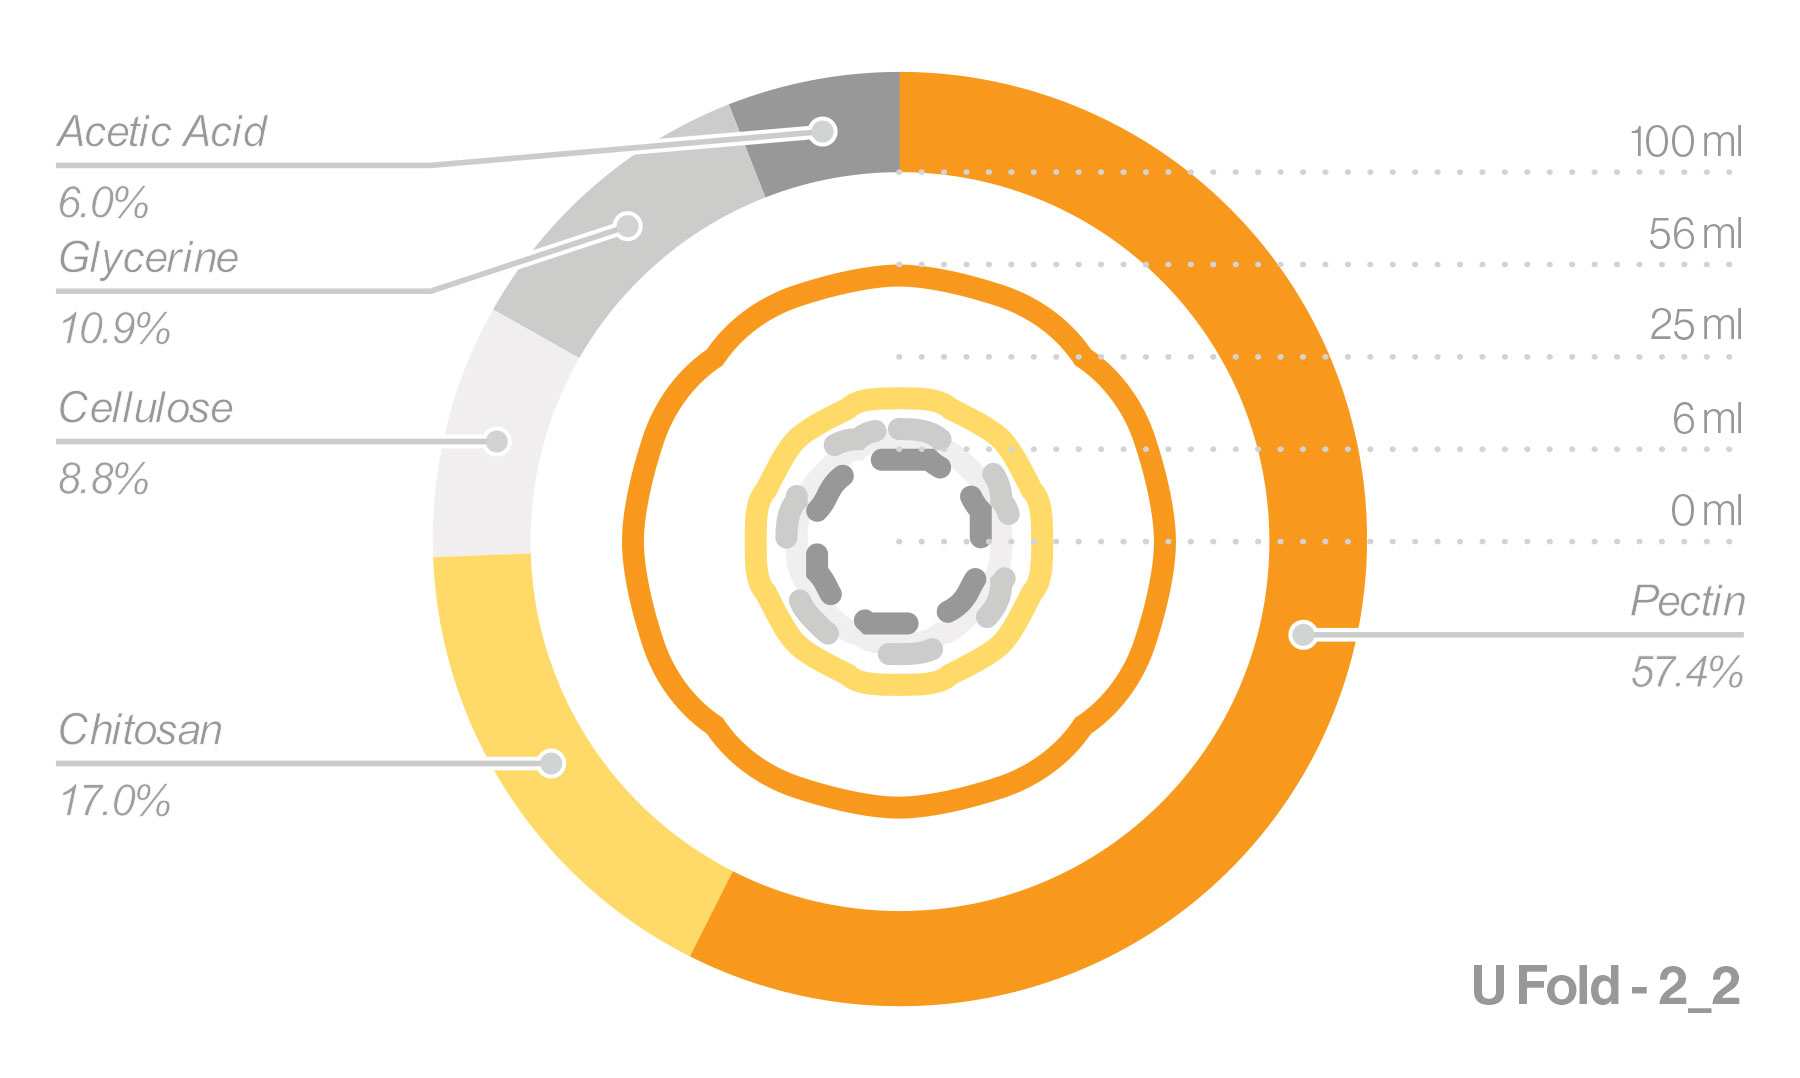

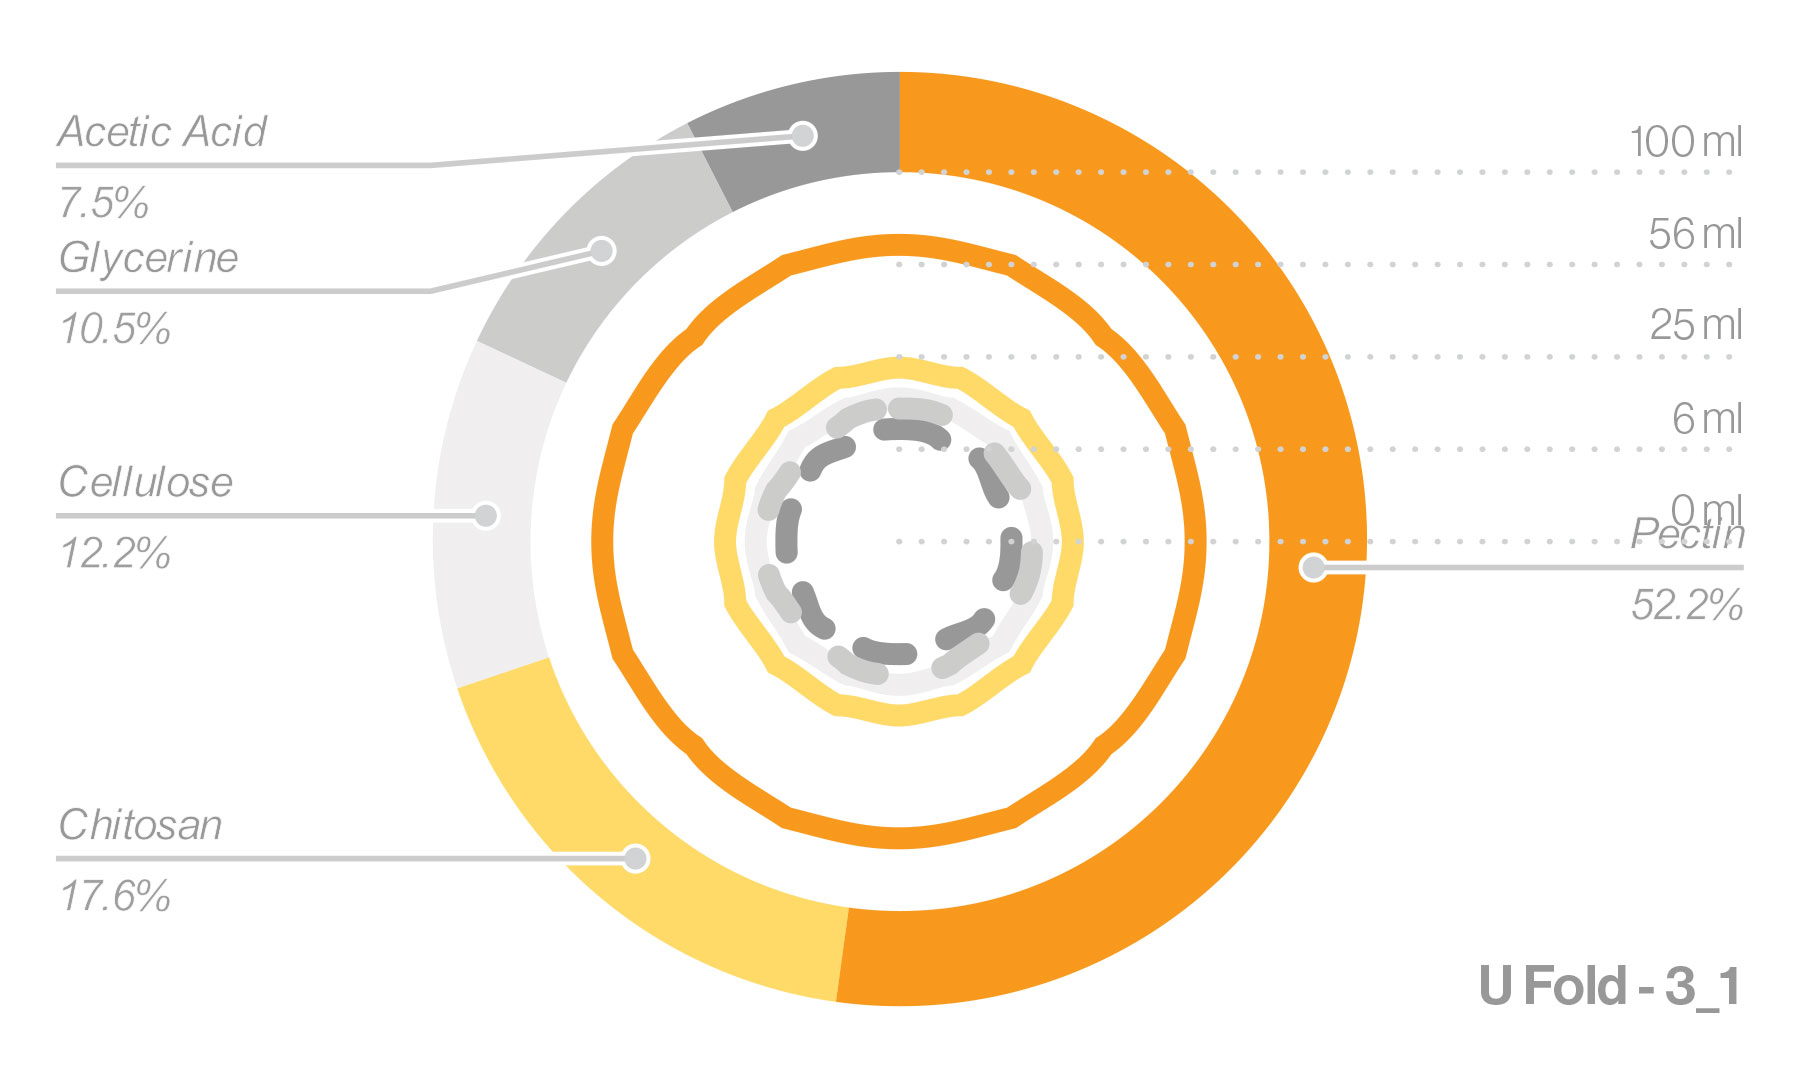
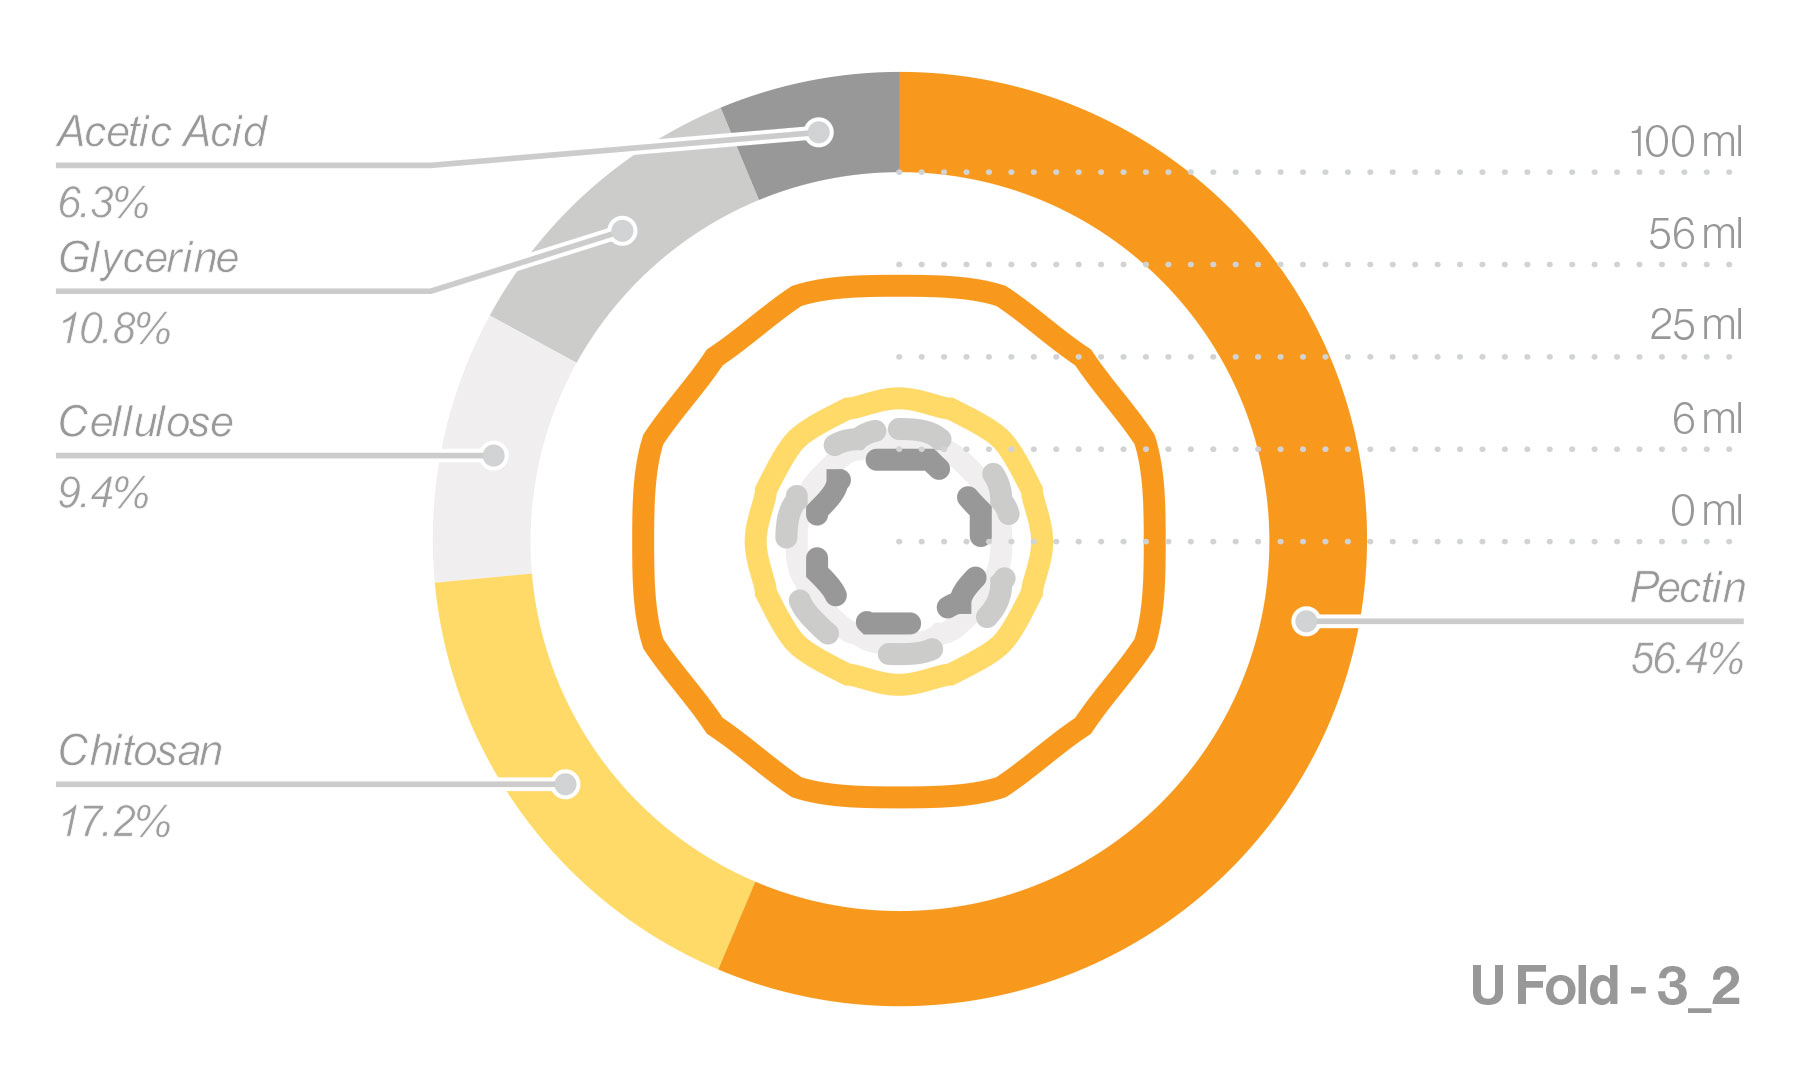

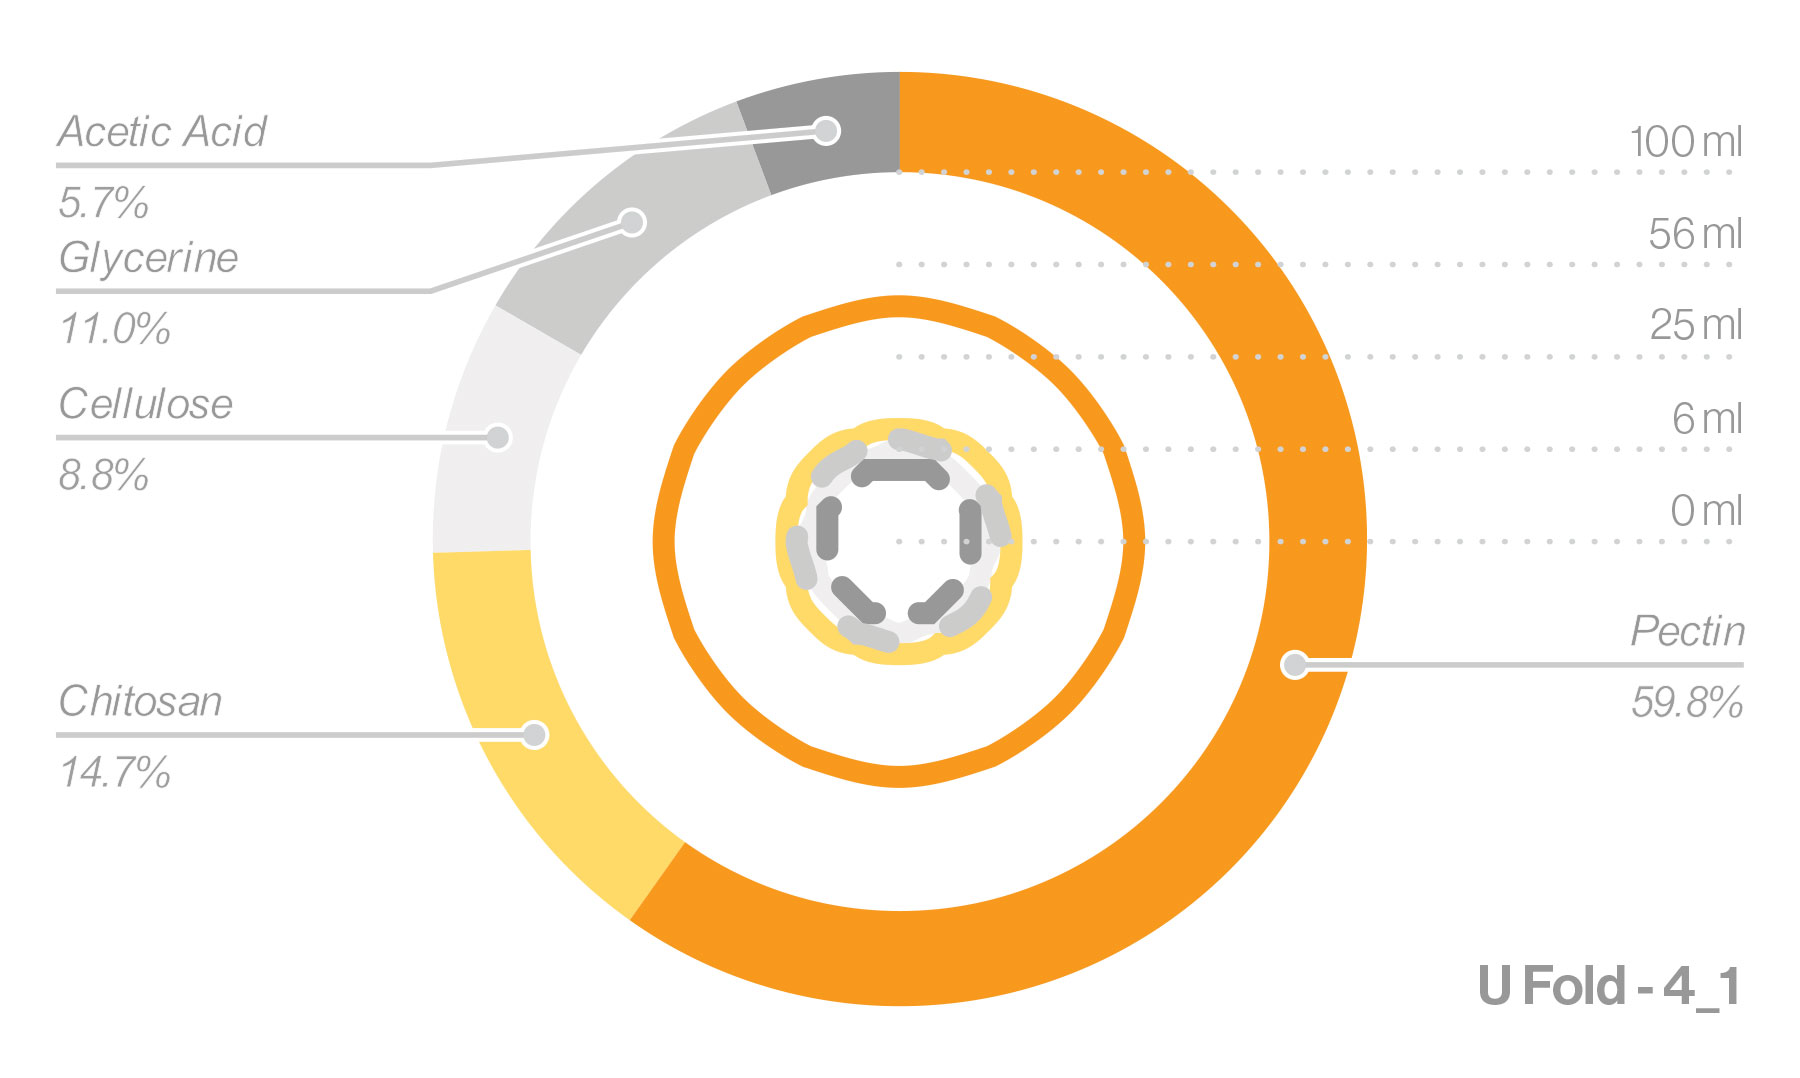
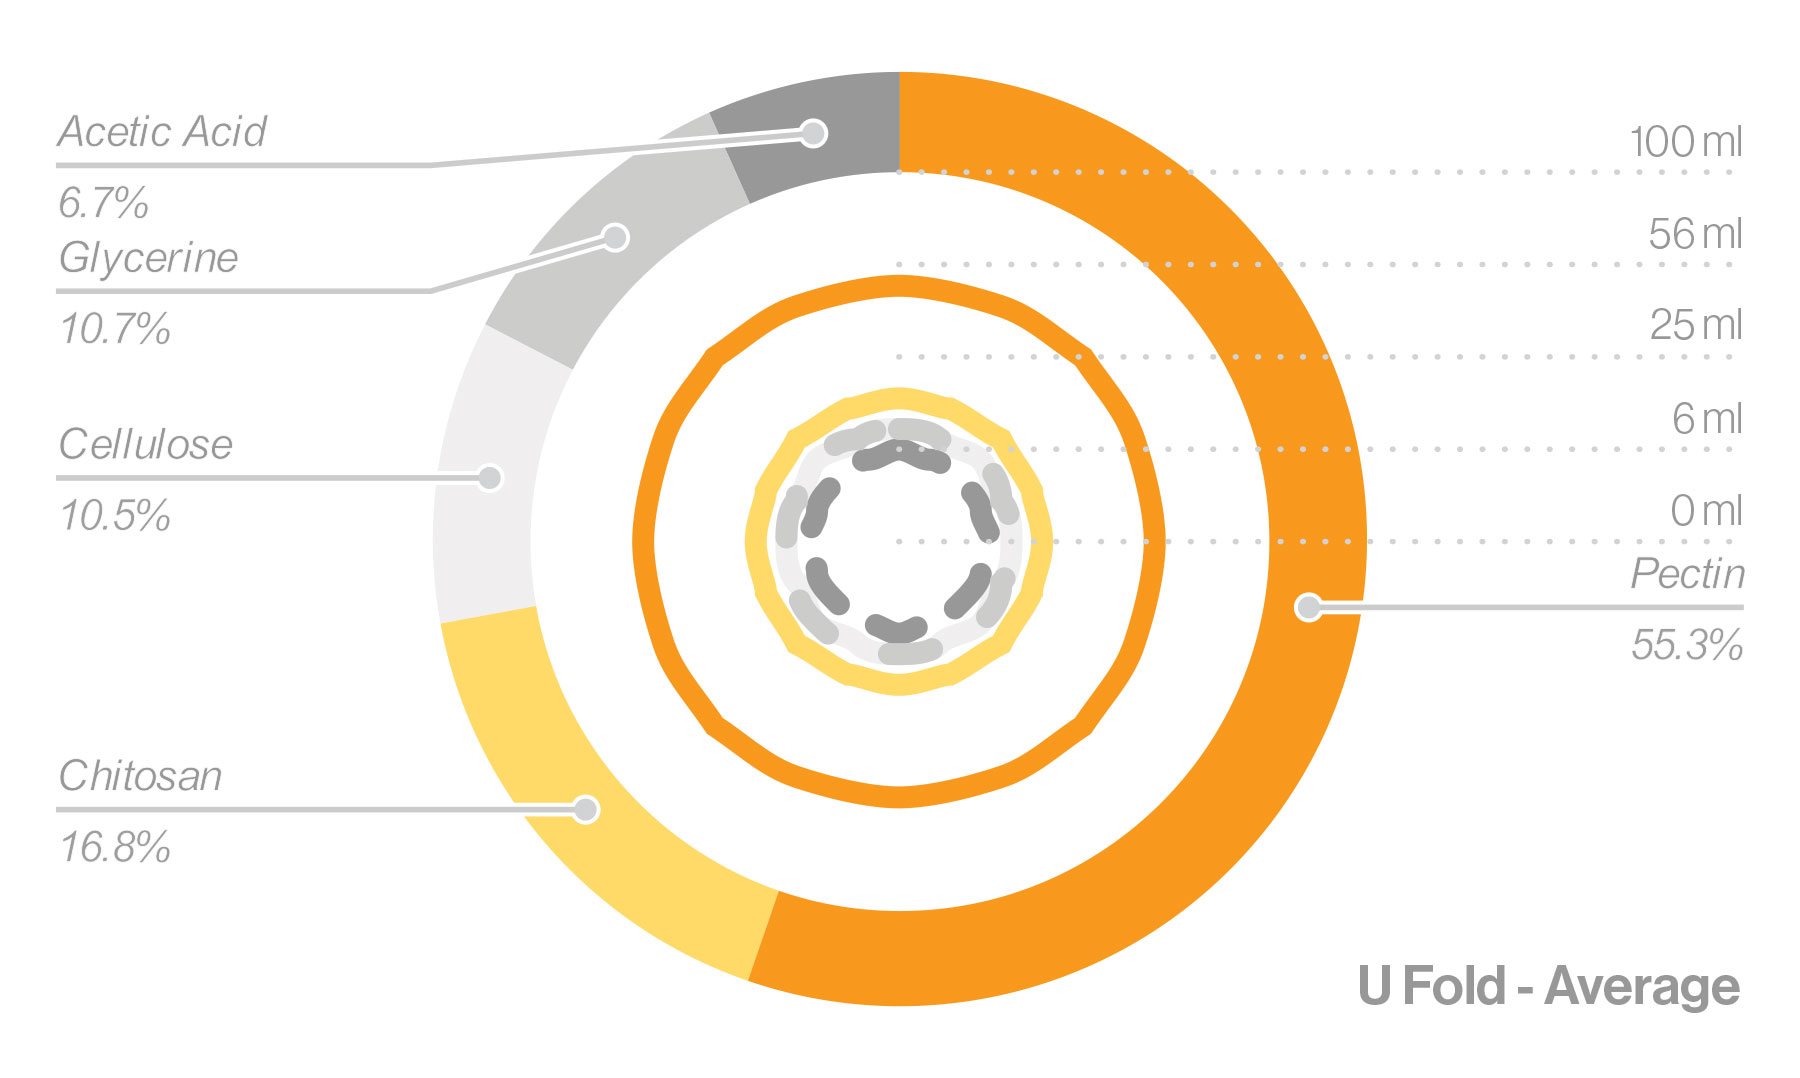
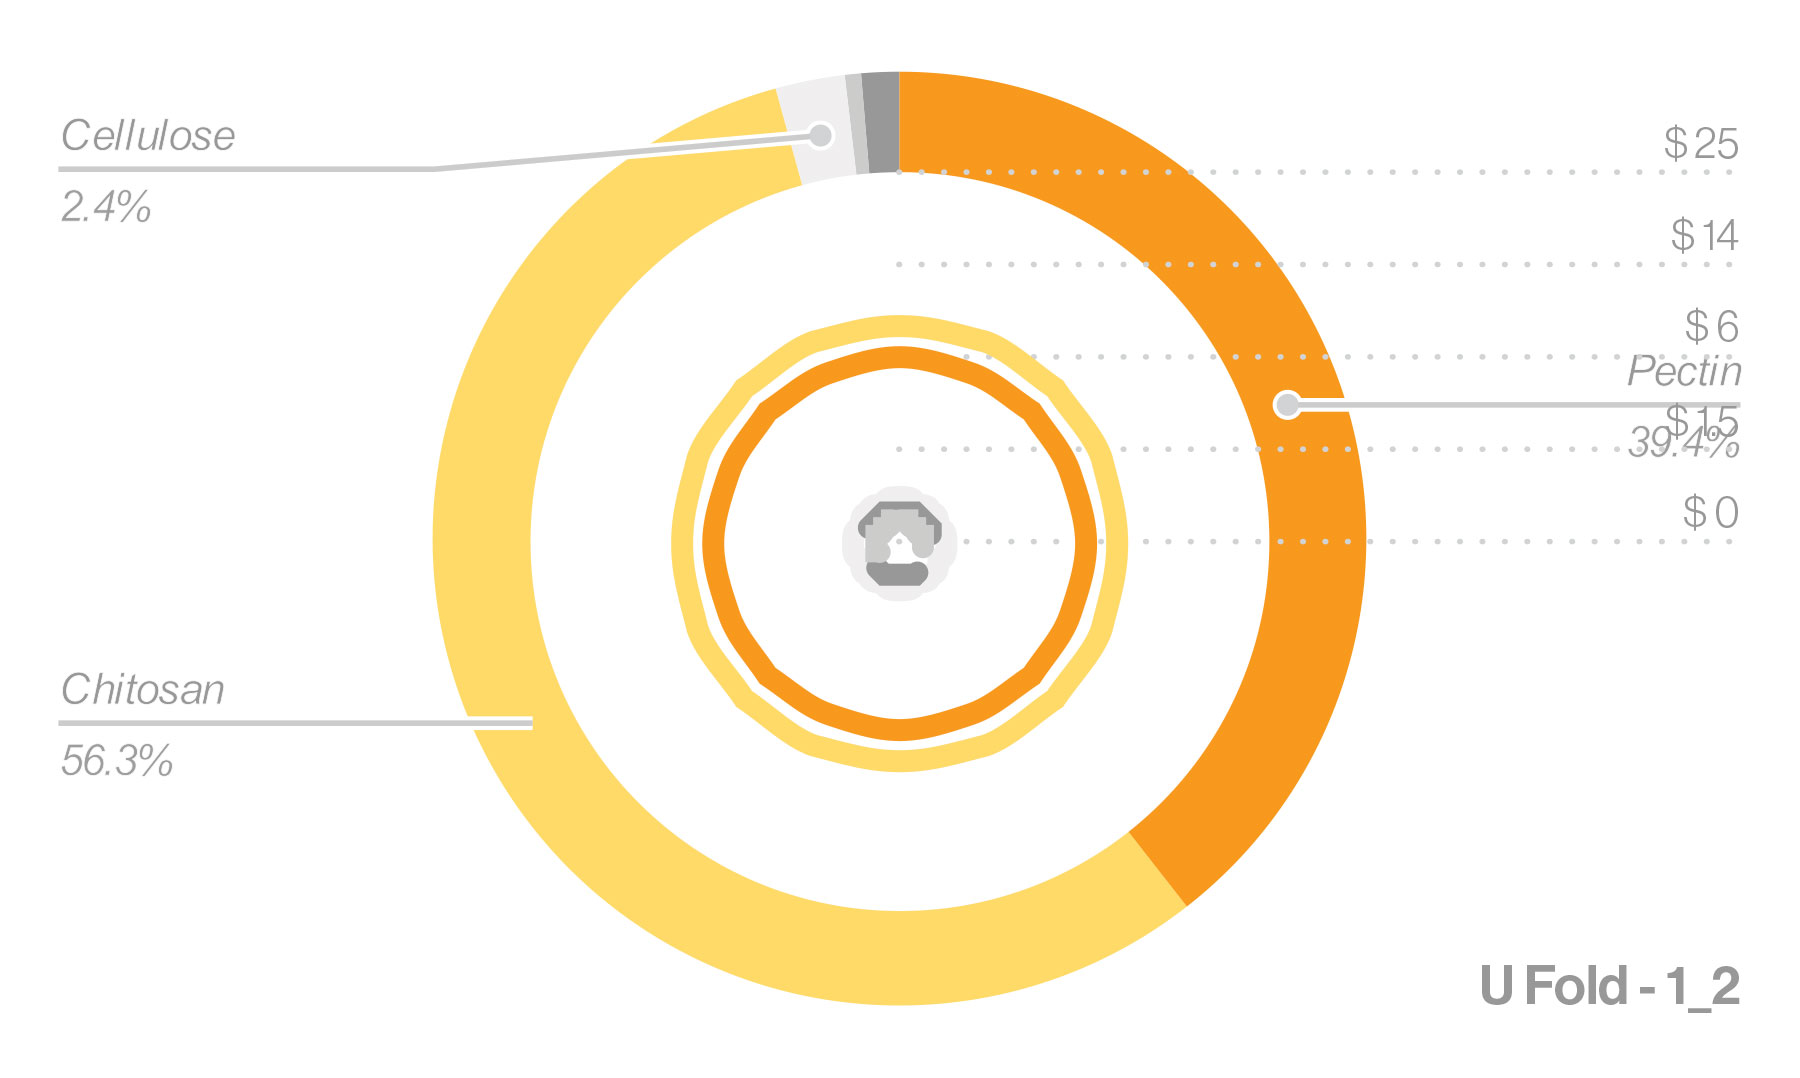
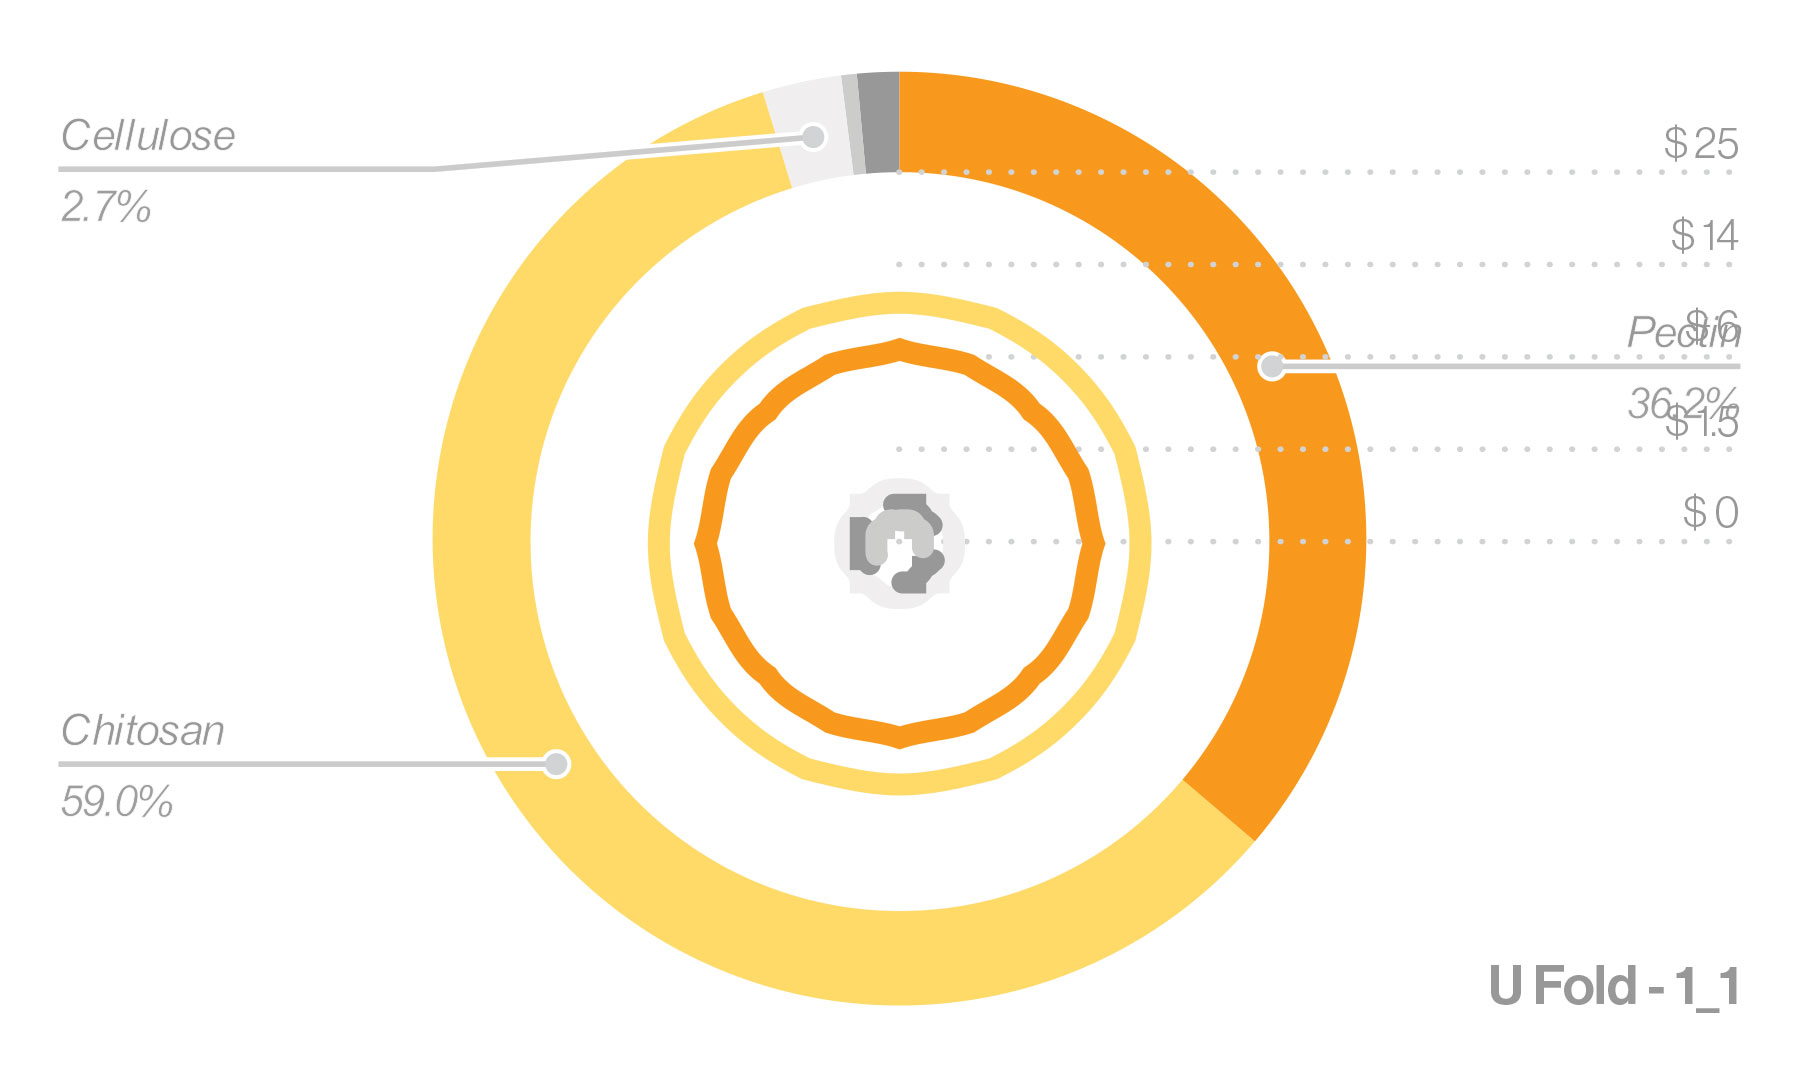


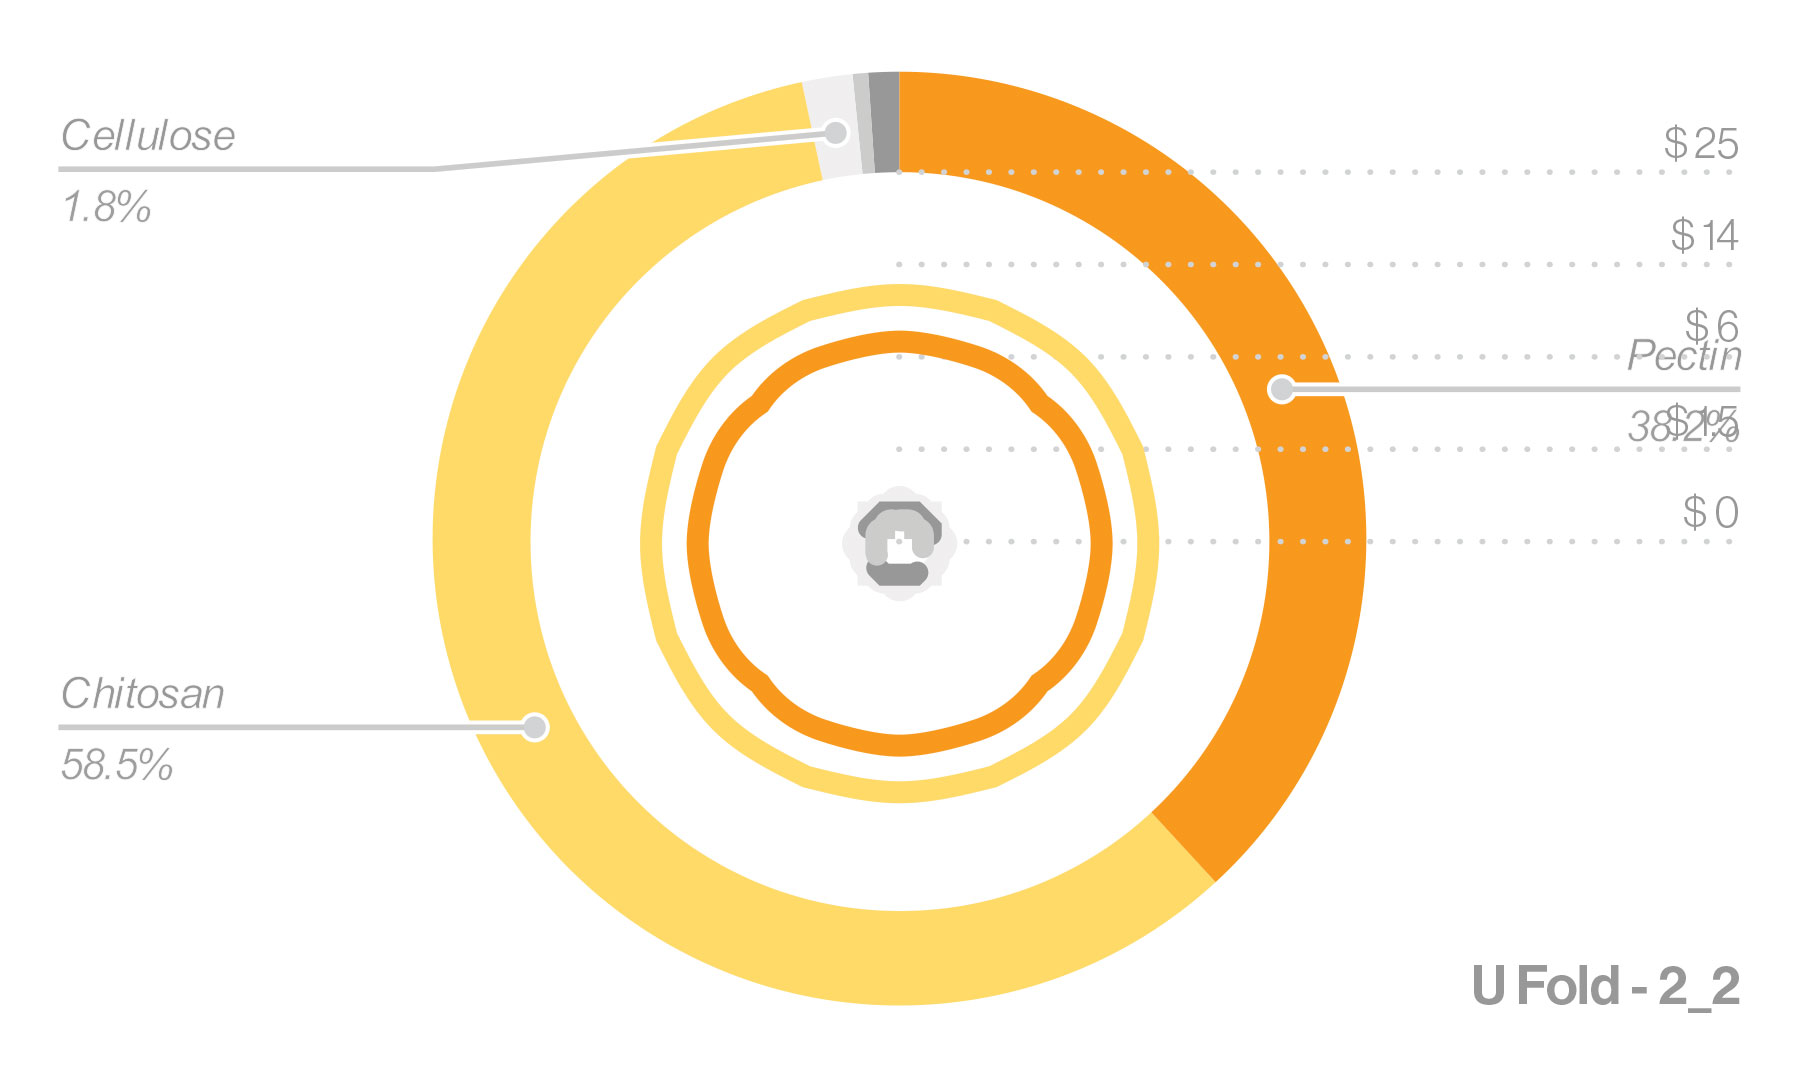
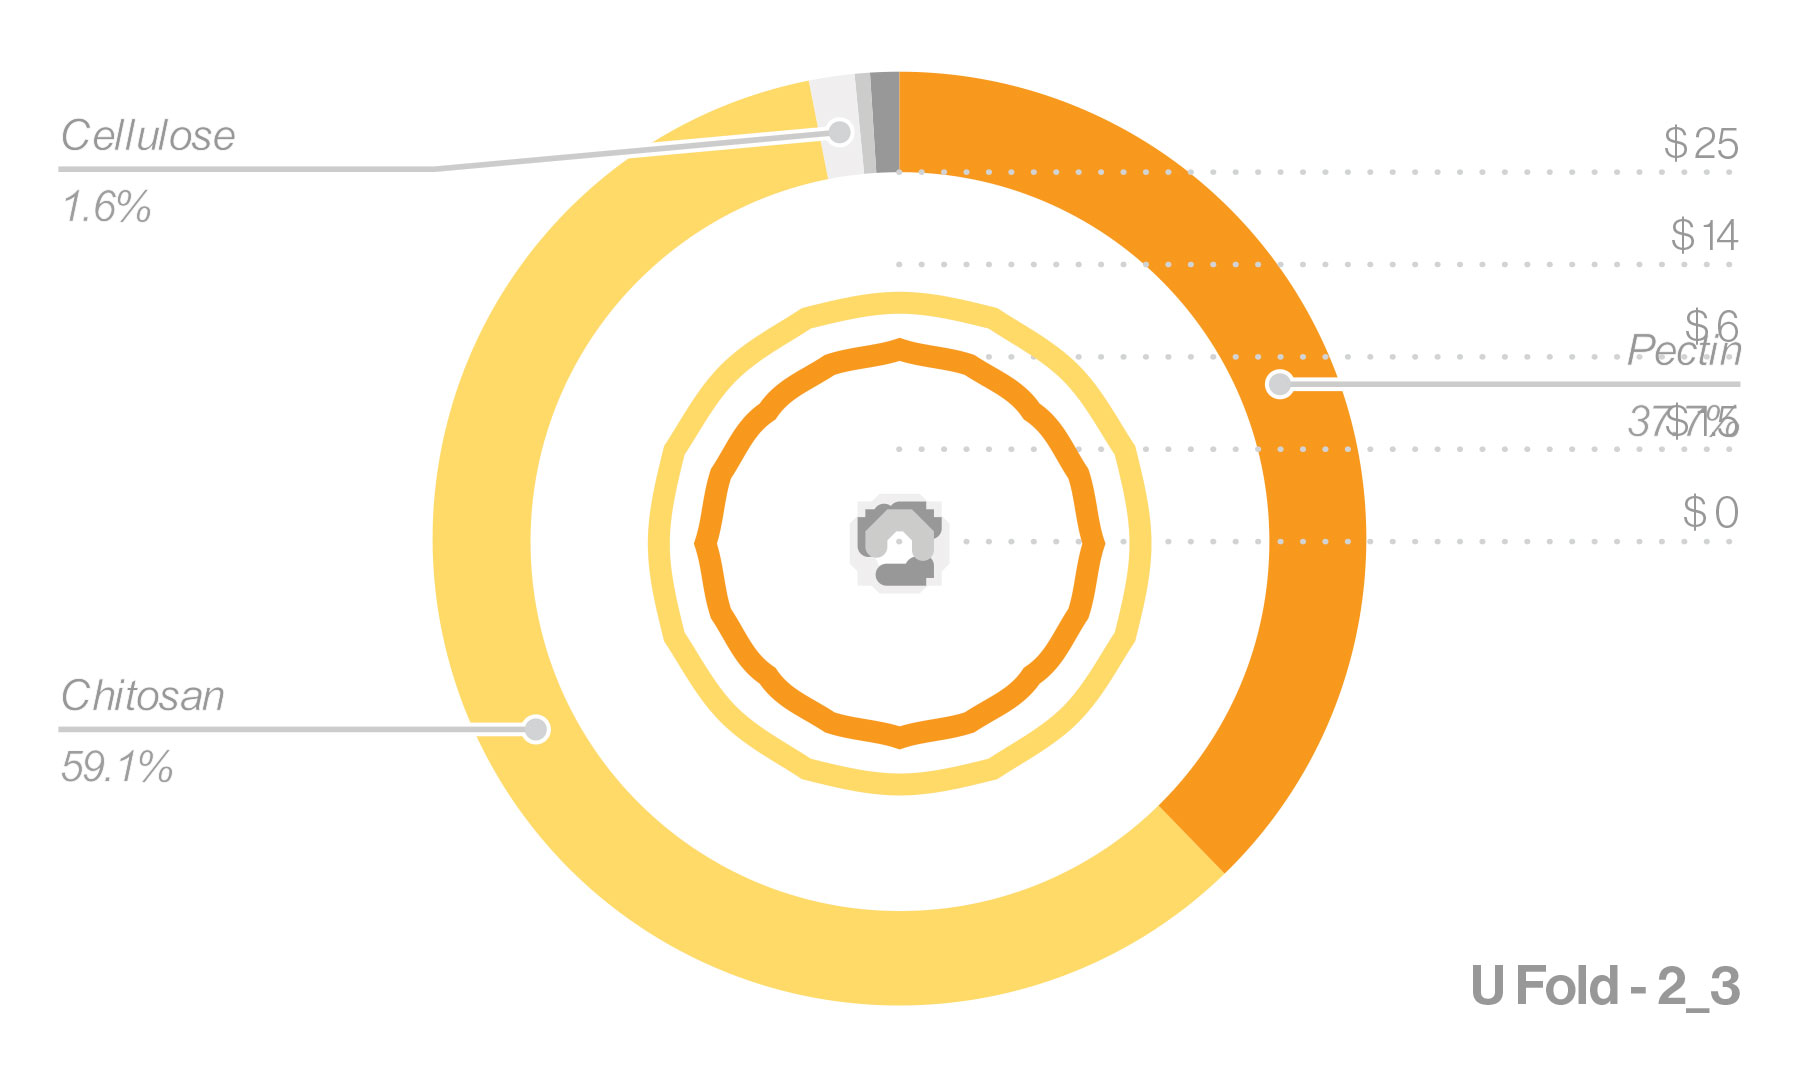
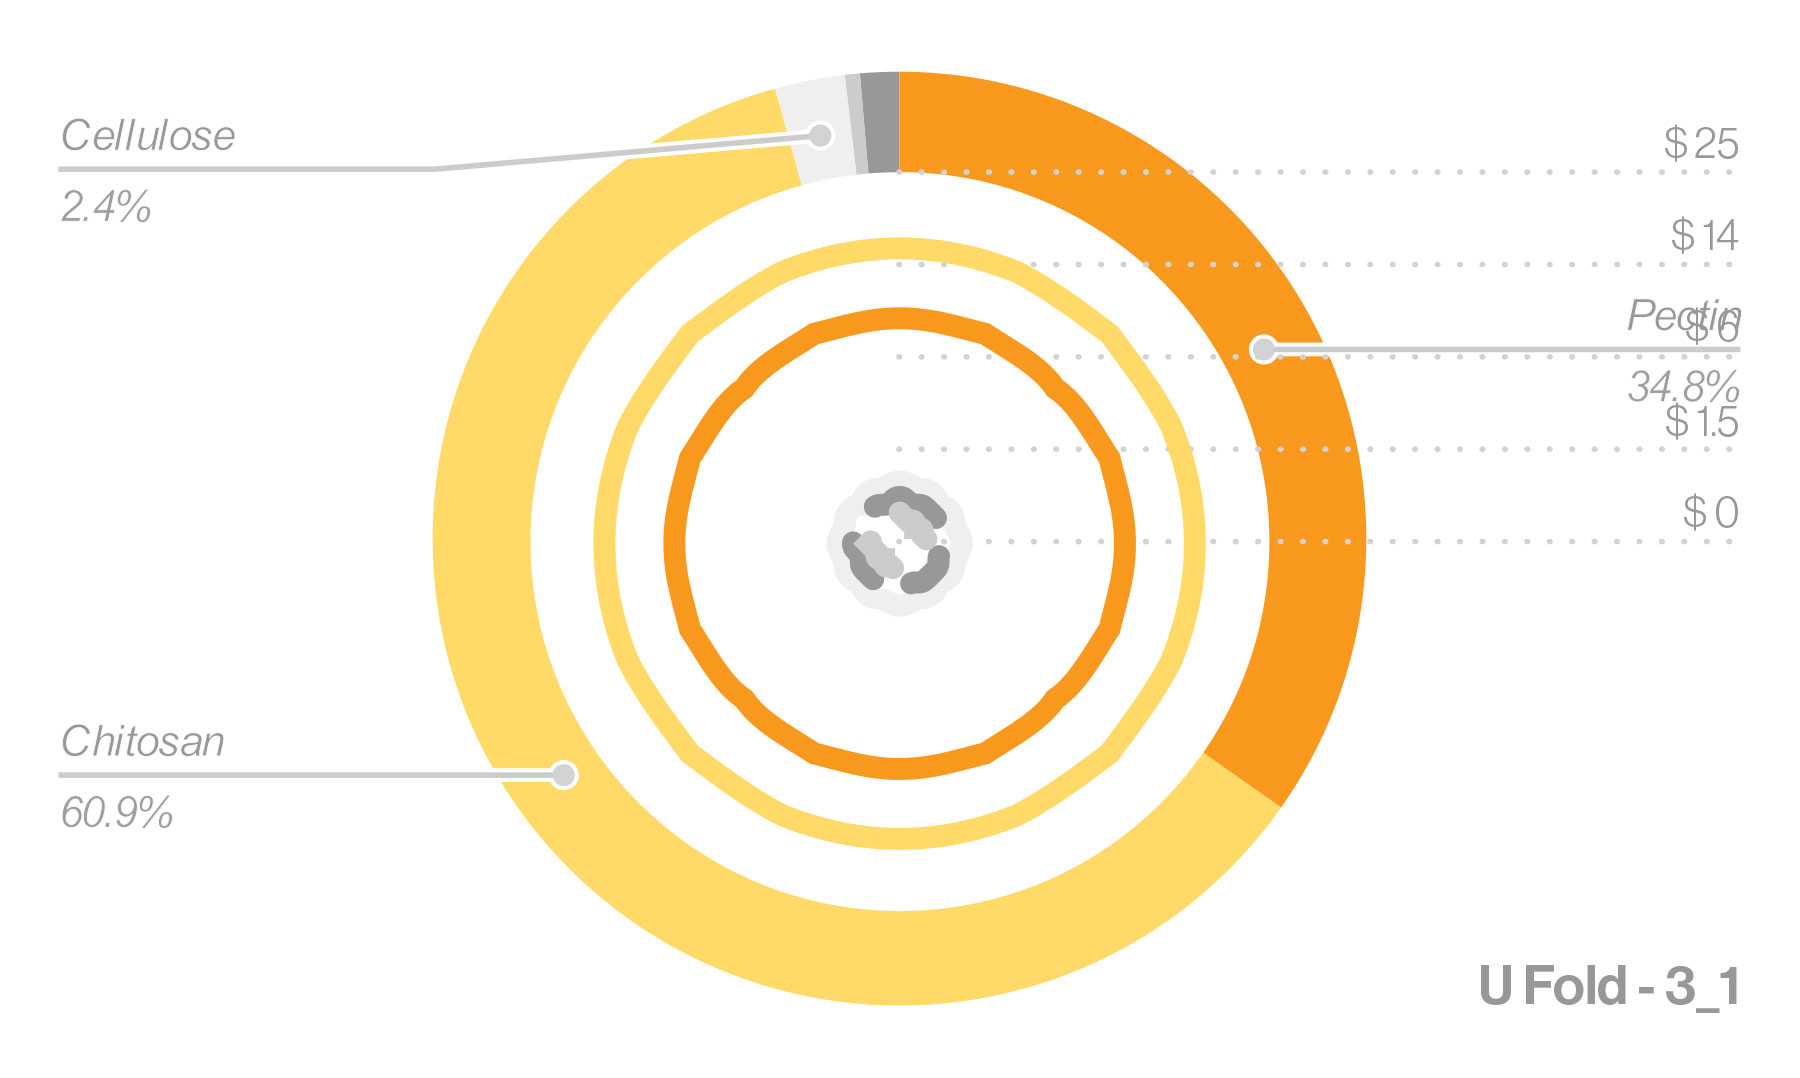
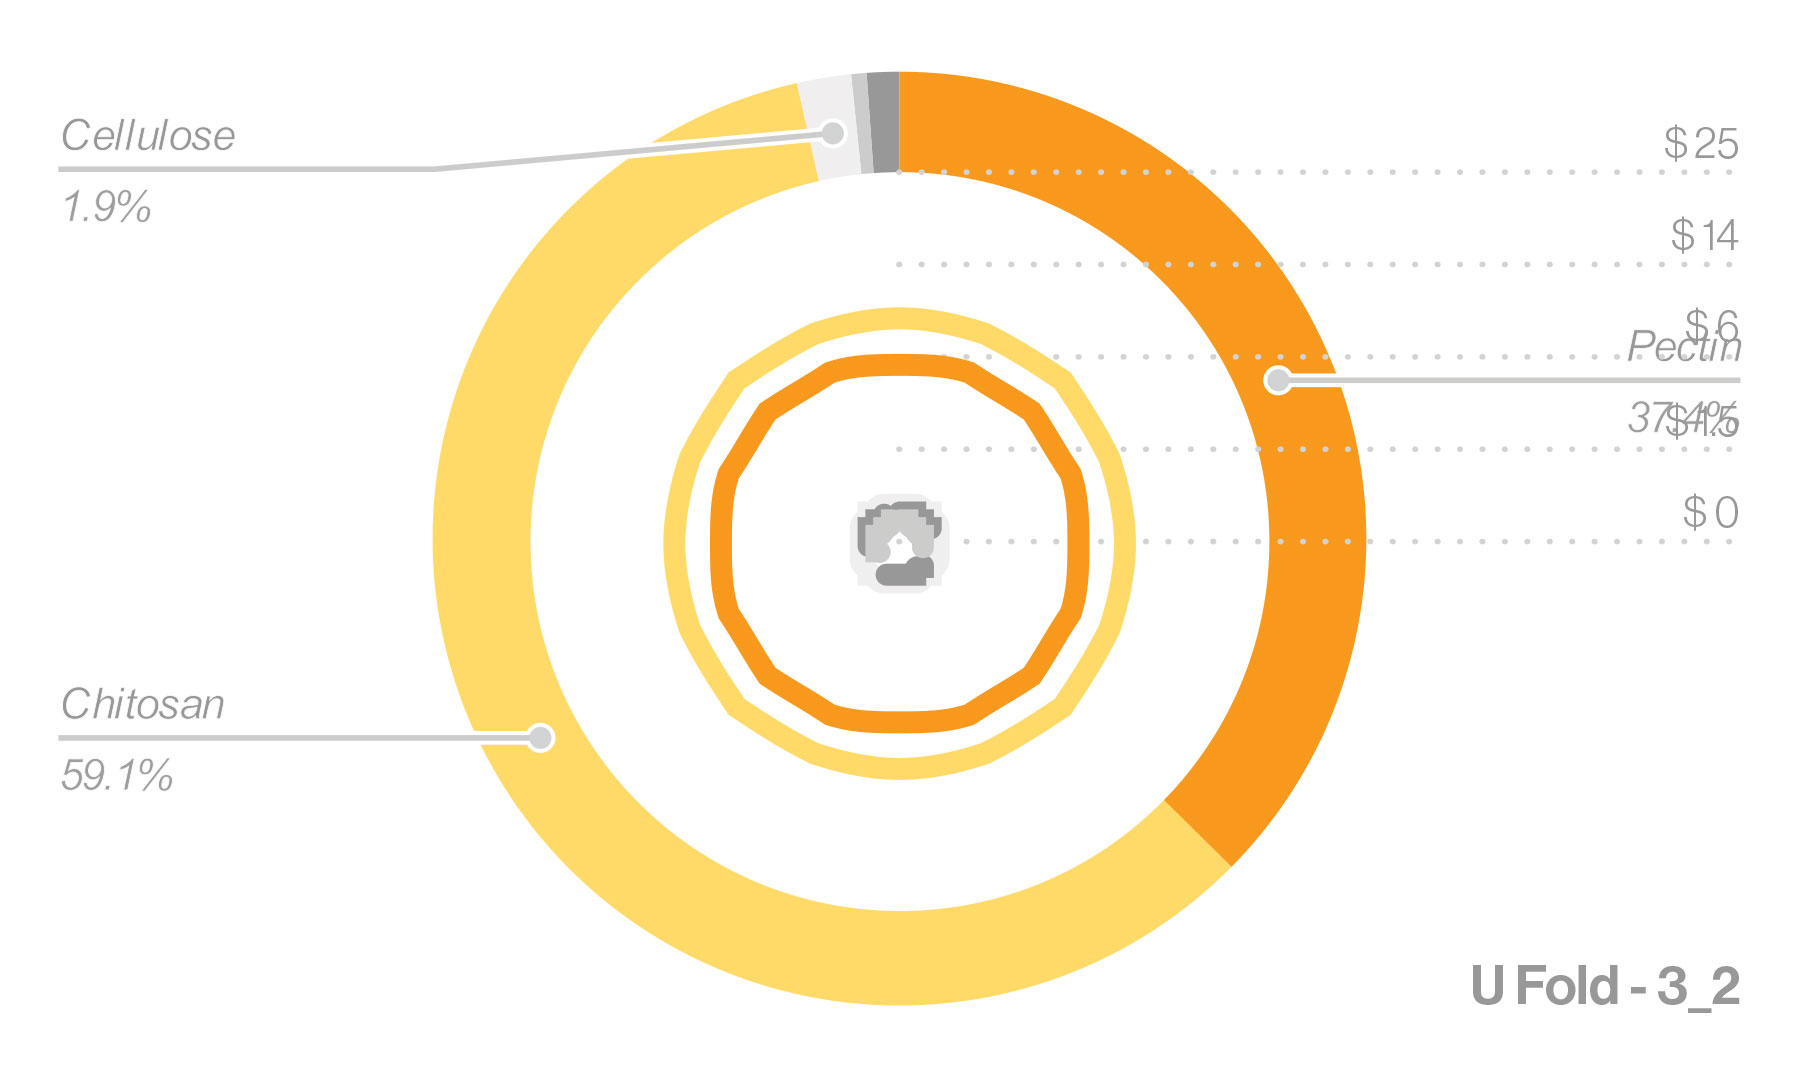
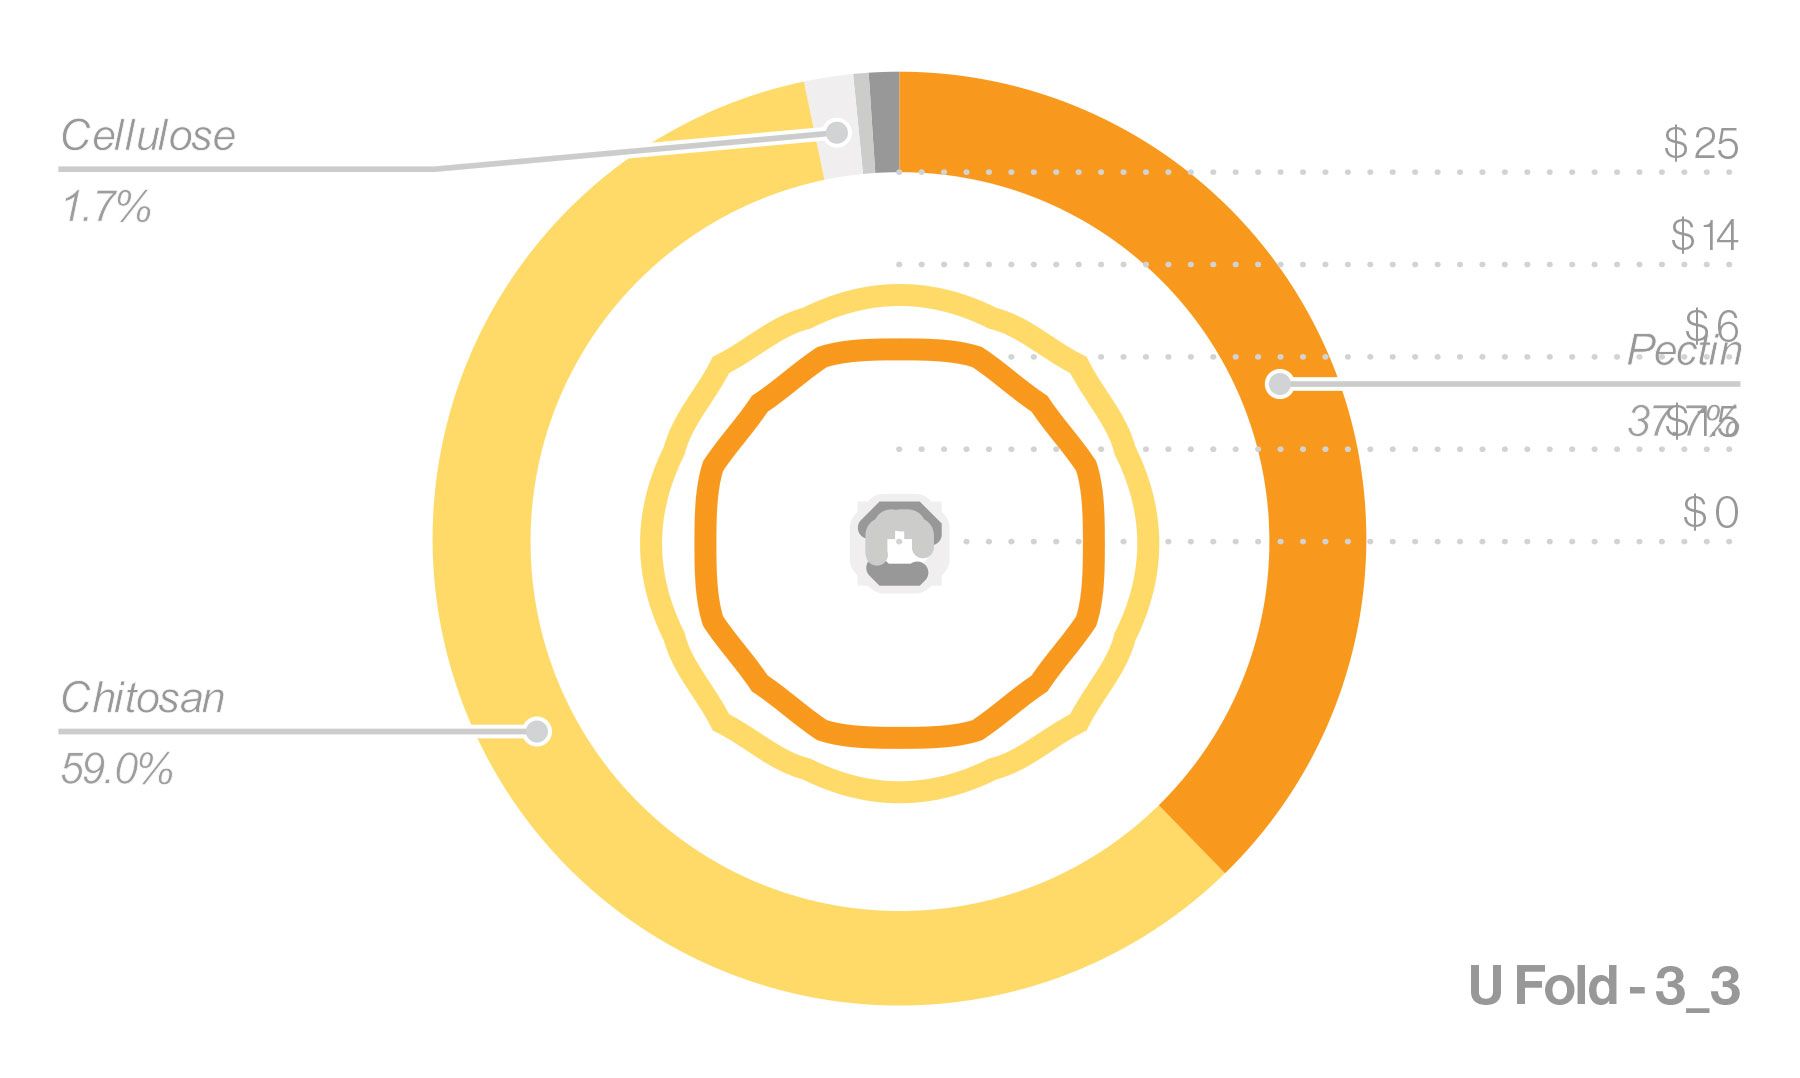
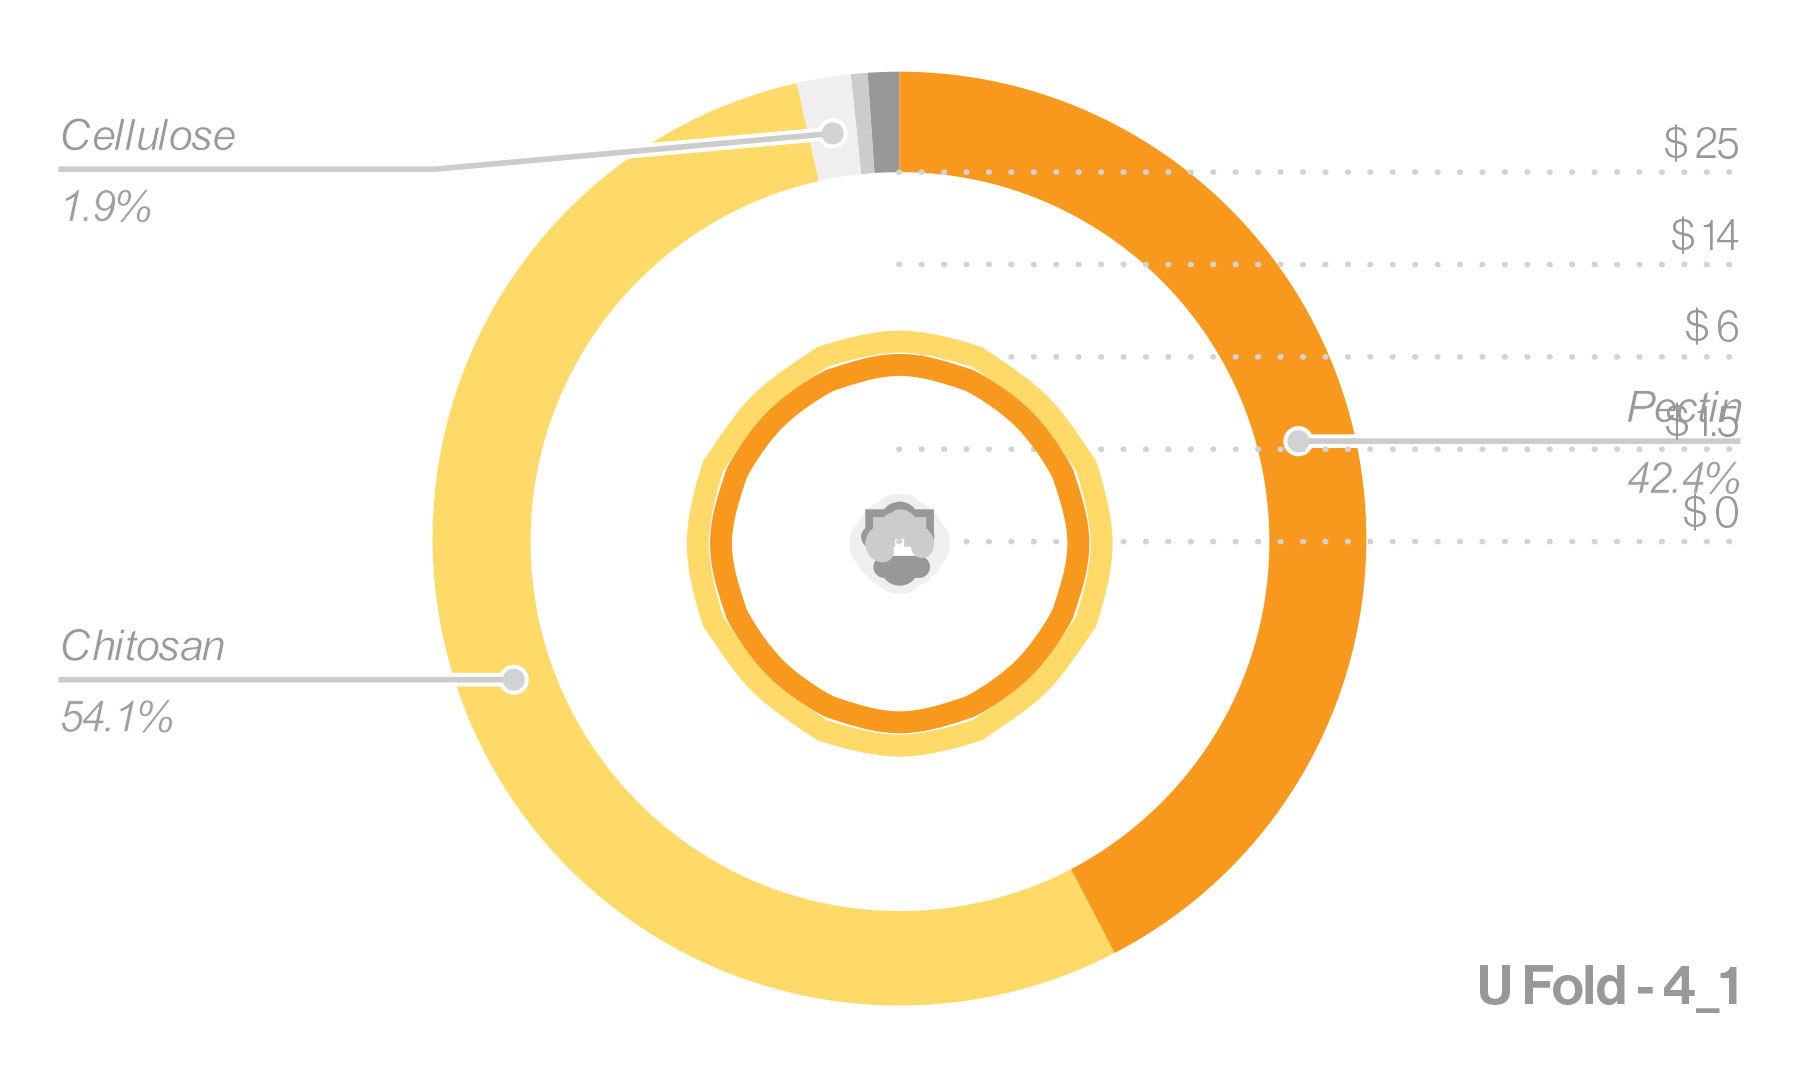
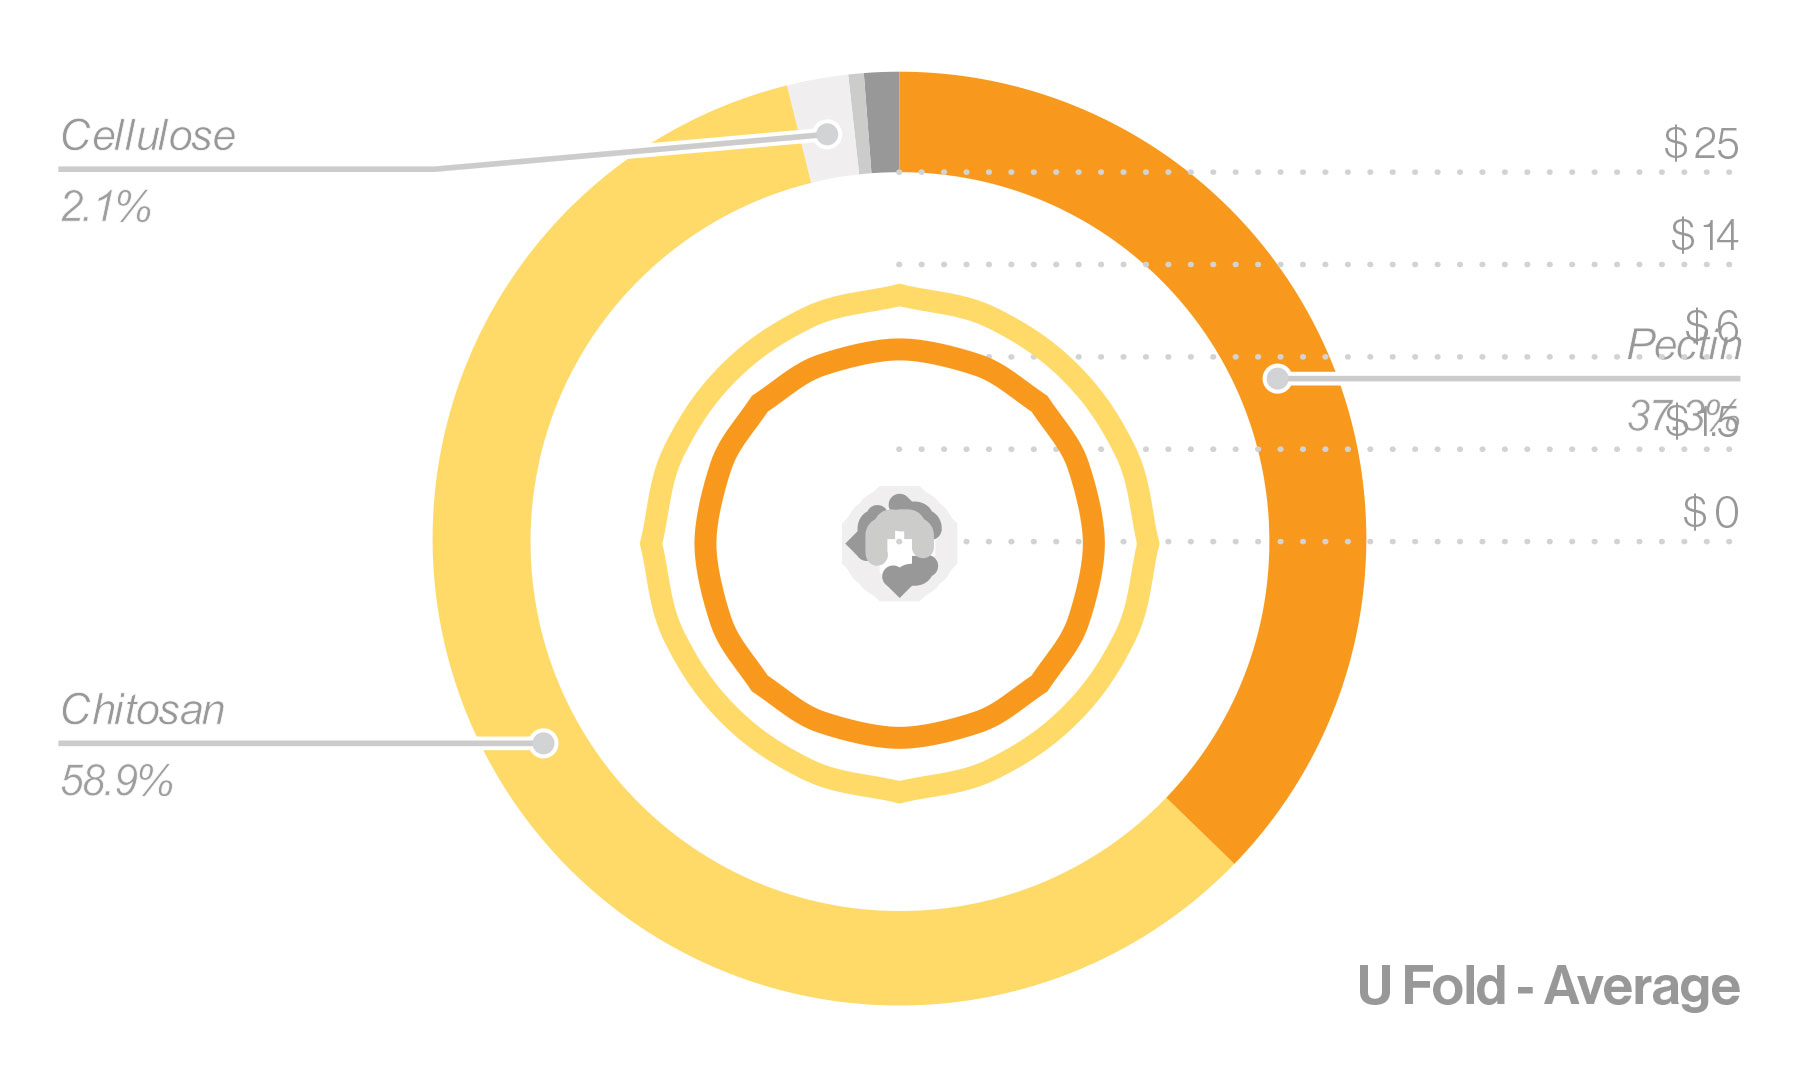
Figure VI: Composite pie chart circle diagram comparing ingredient volum and cost of materials for each single material print (8 swatch types).
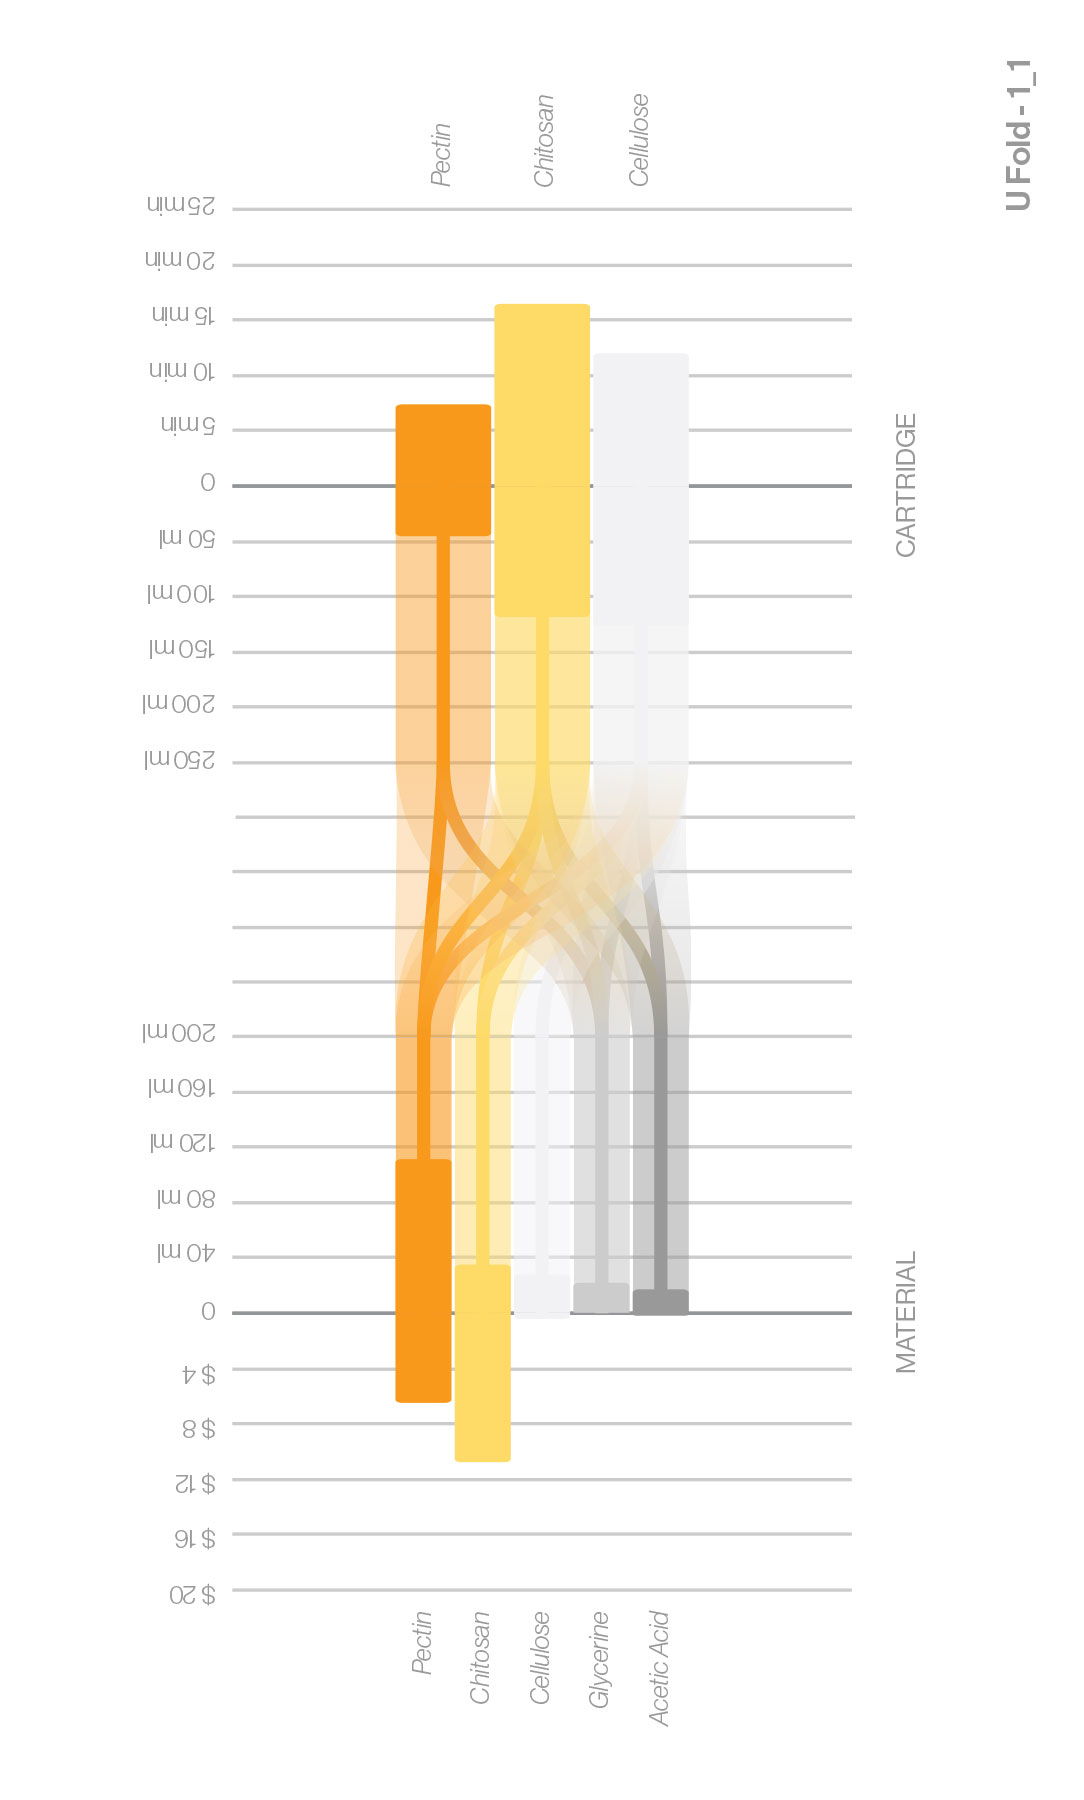
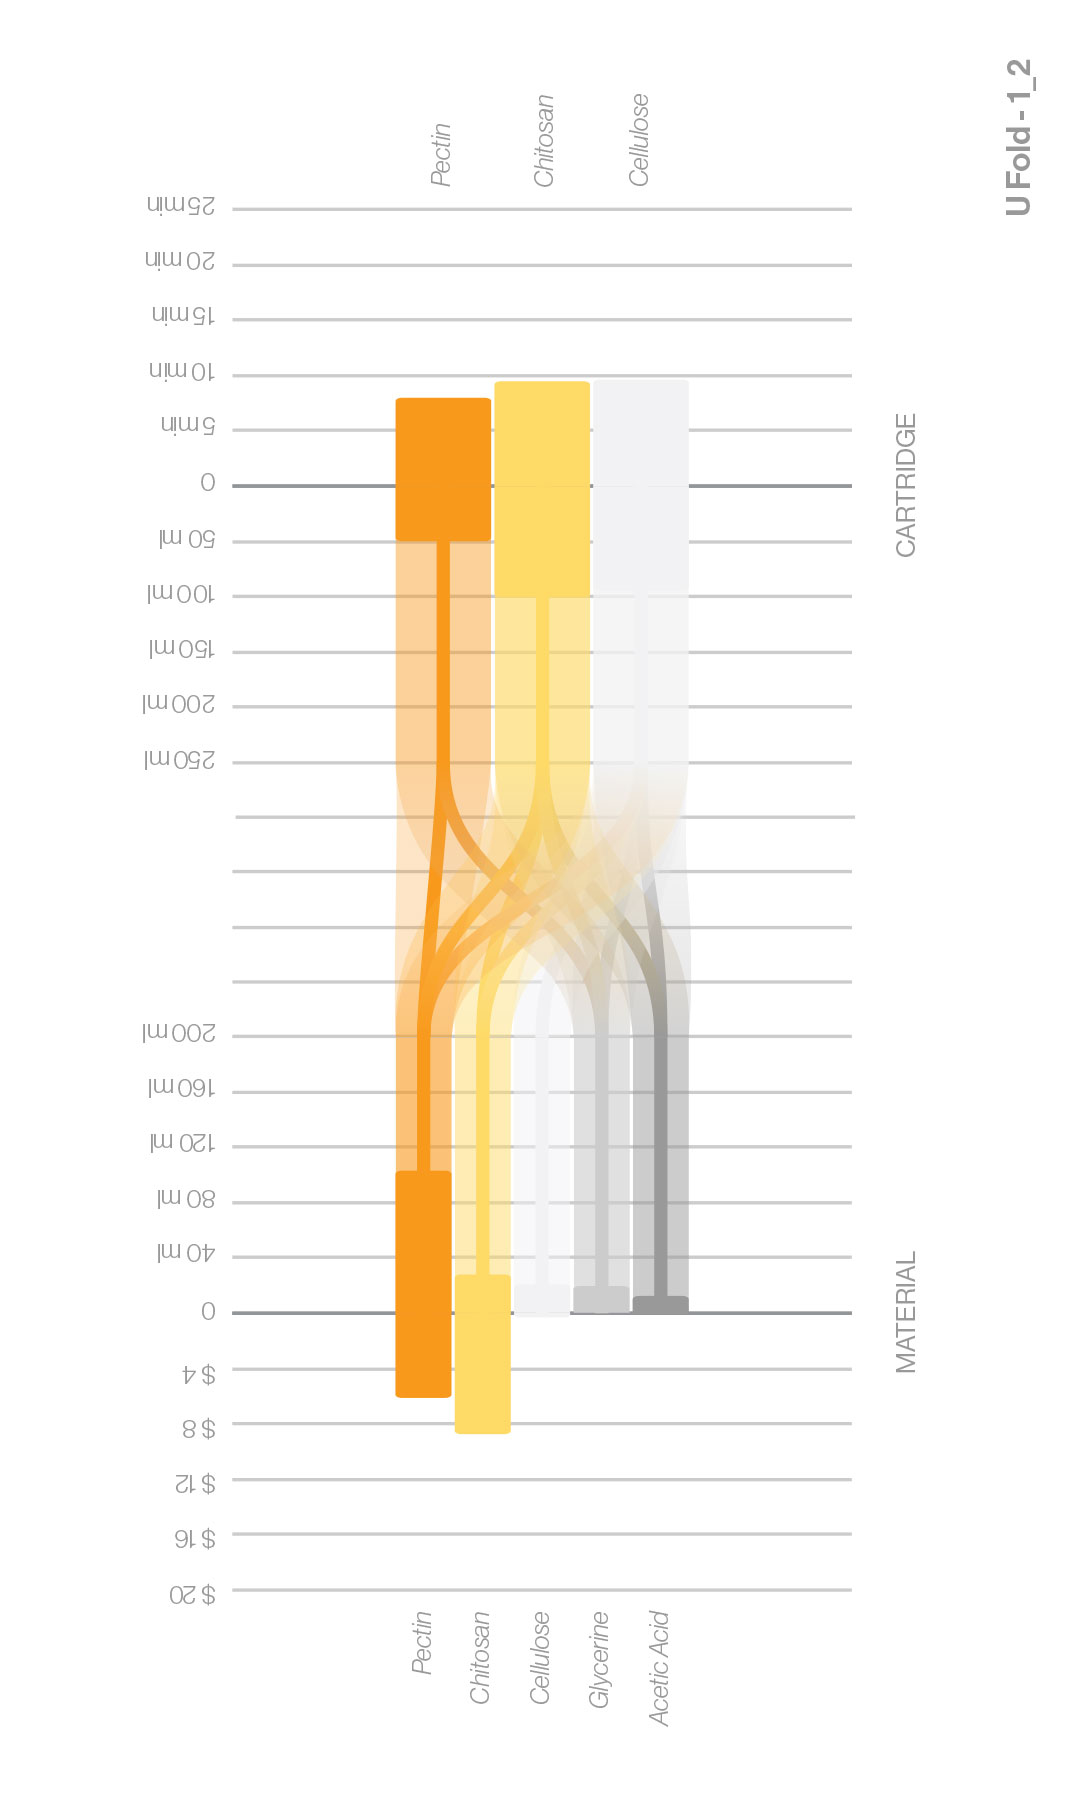
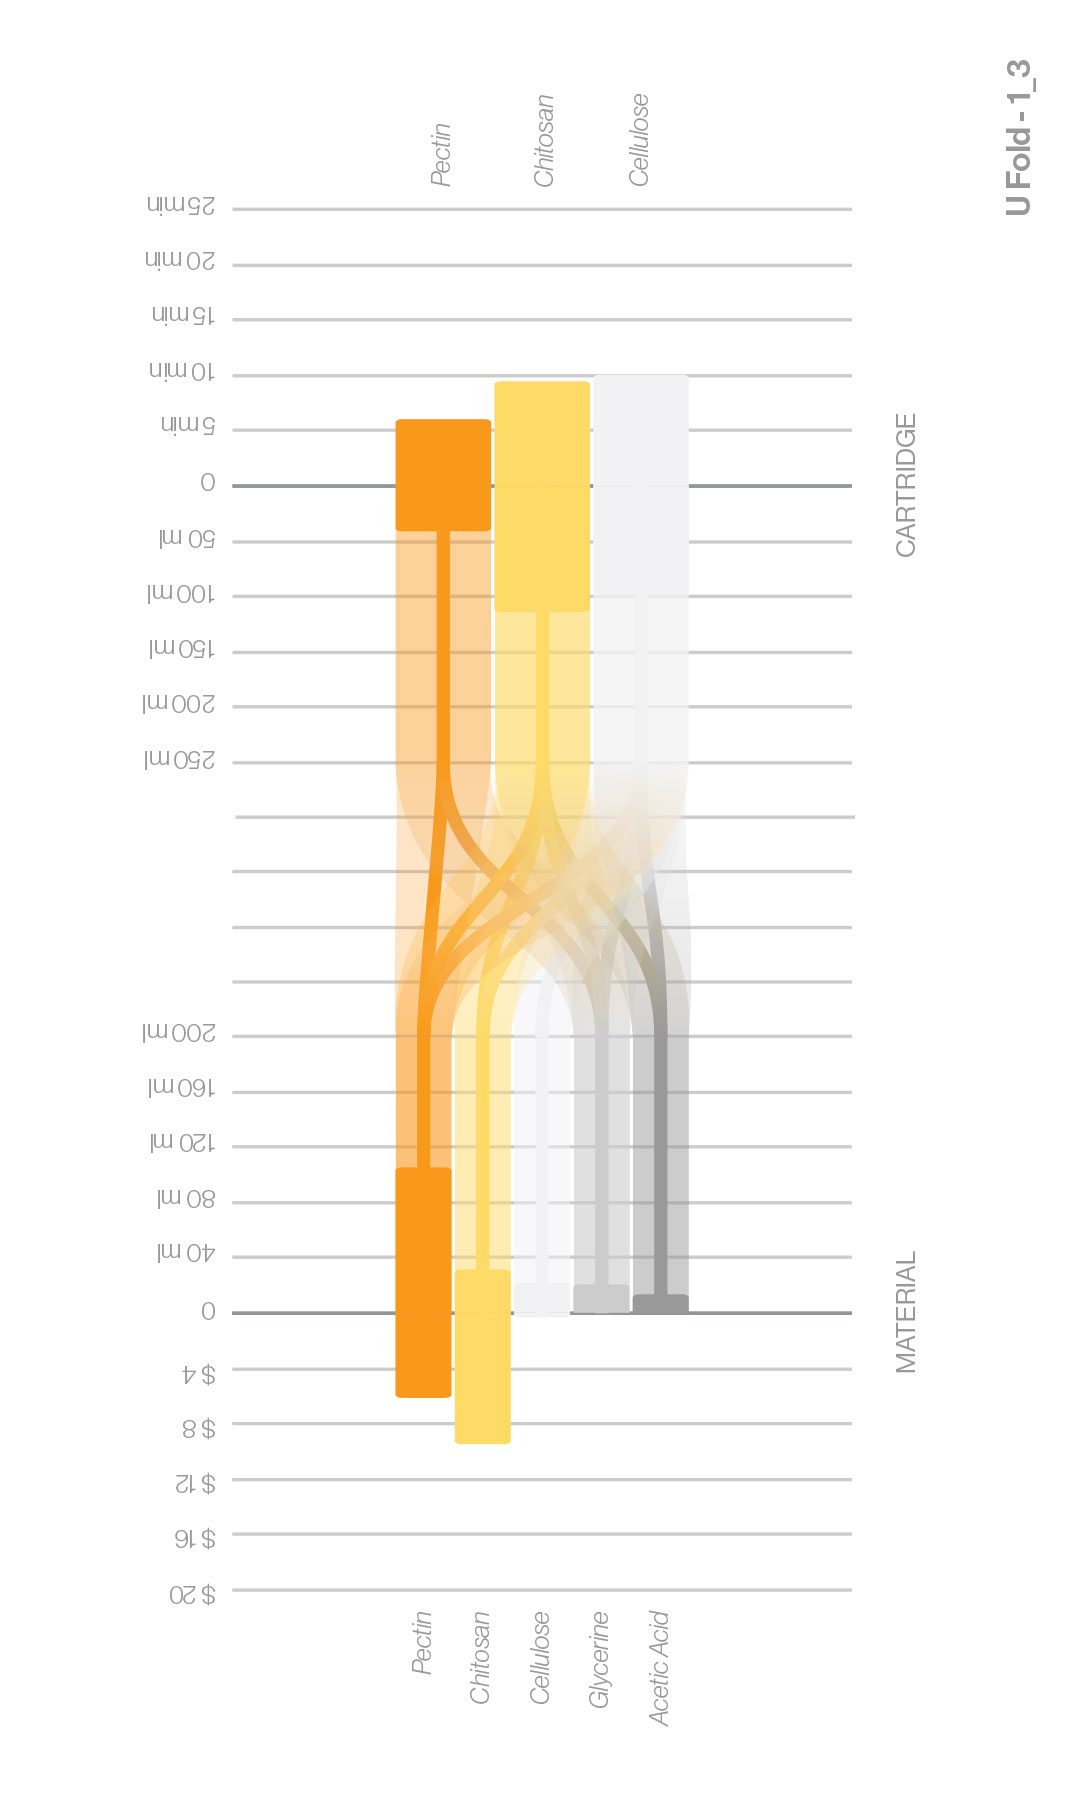
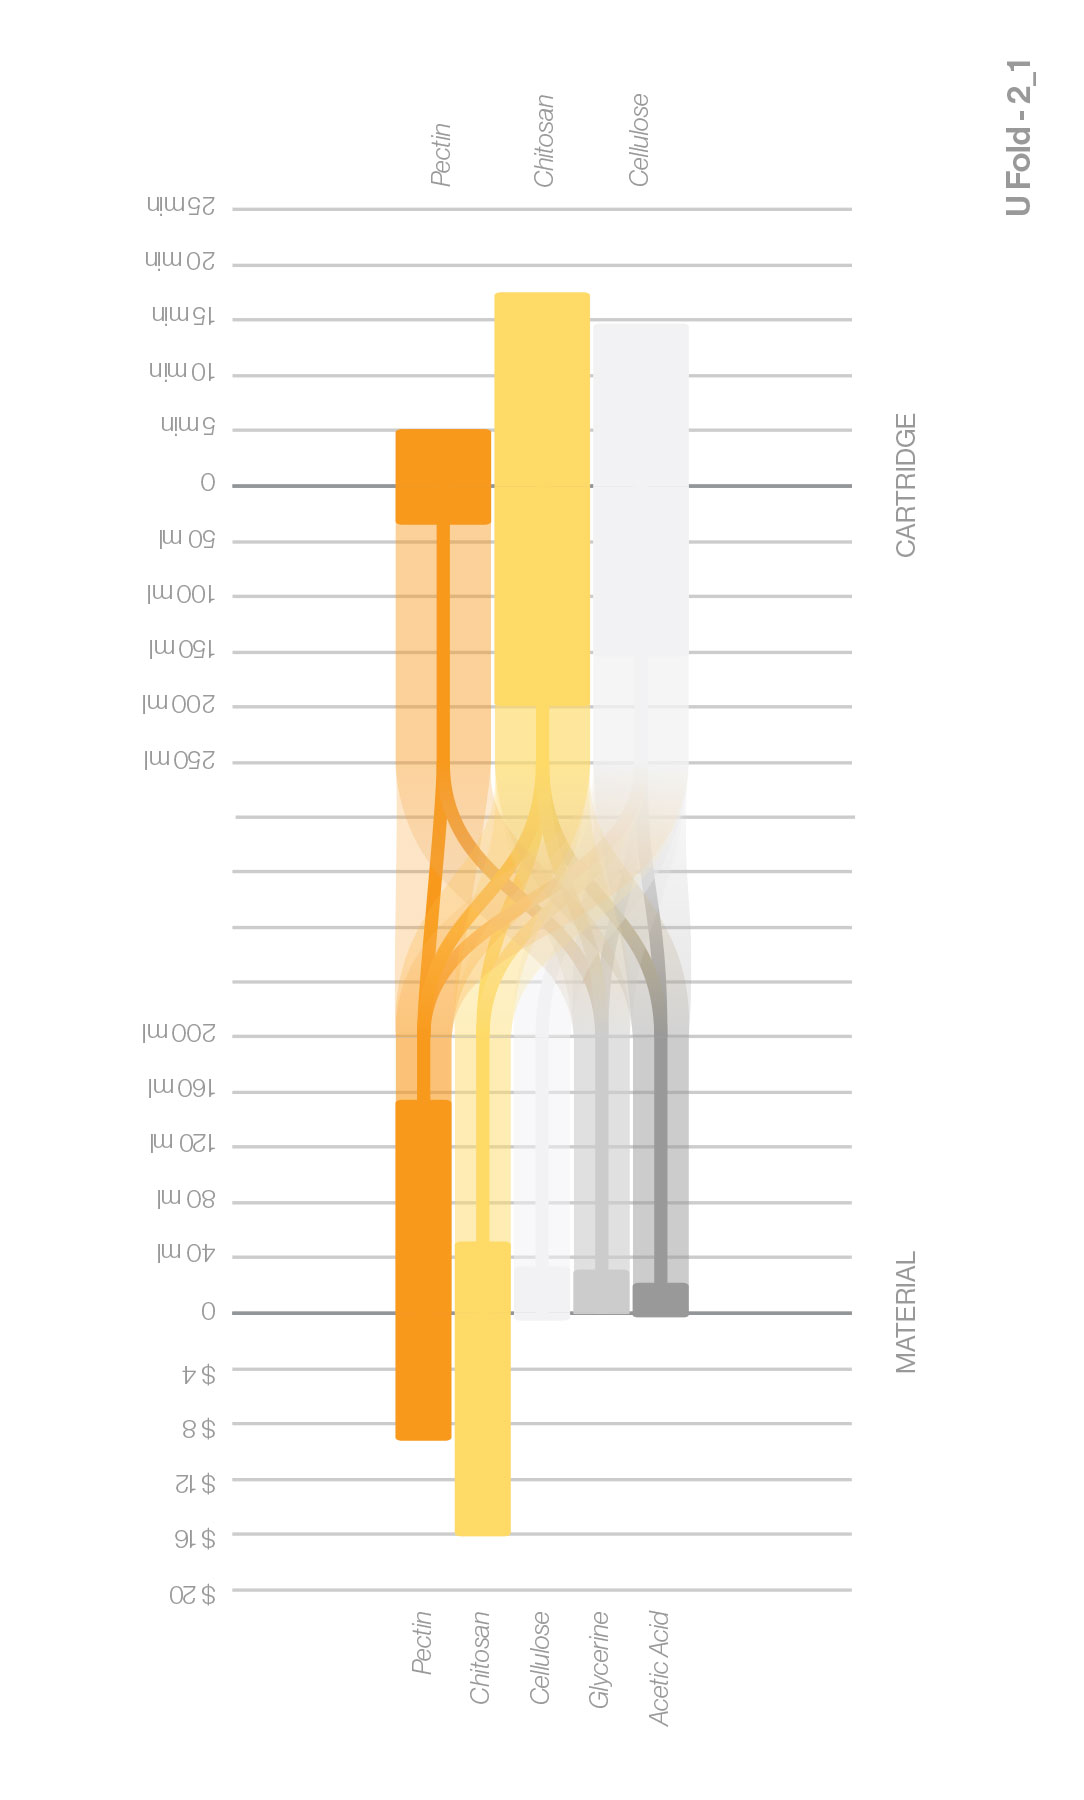


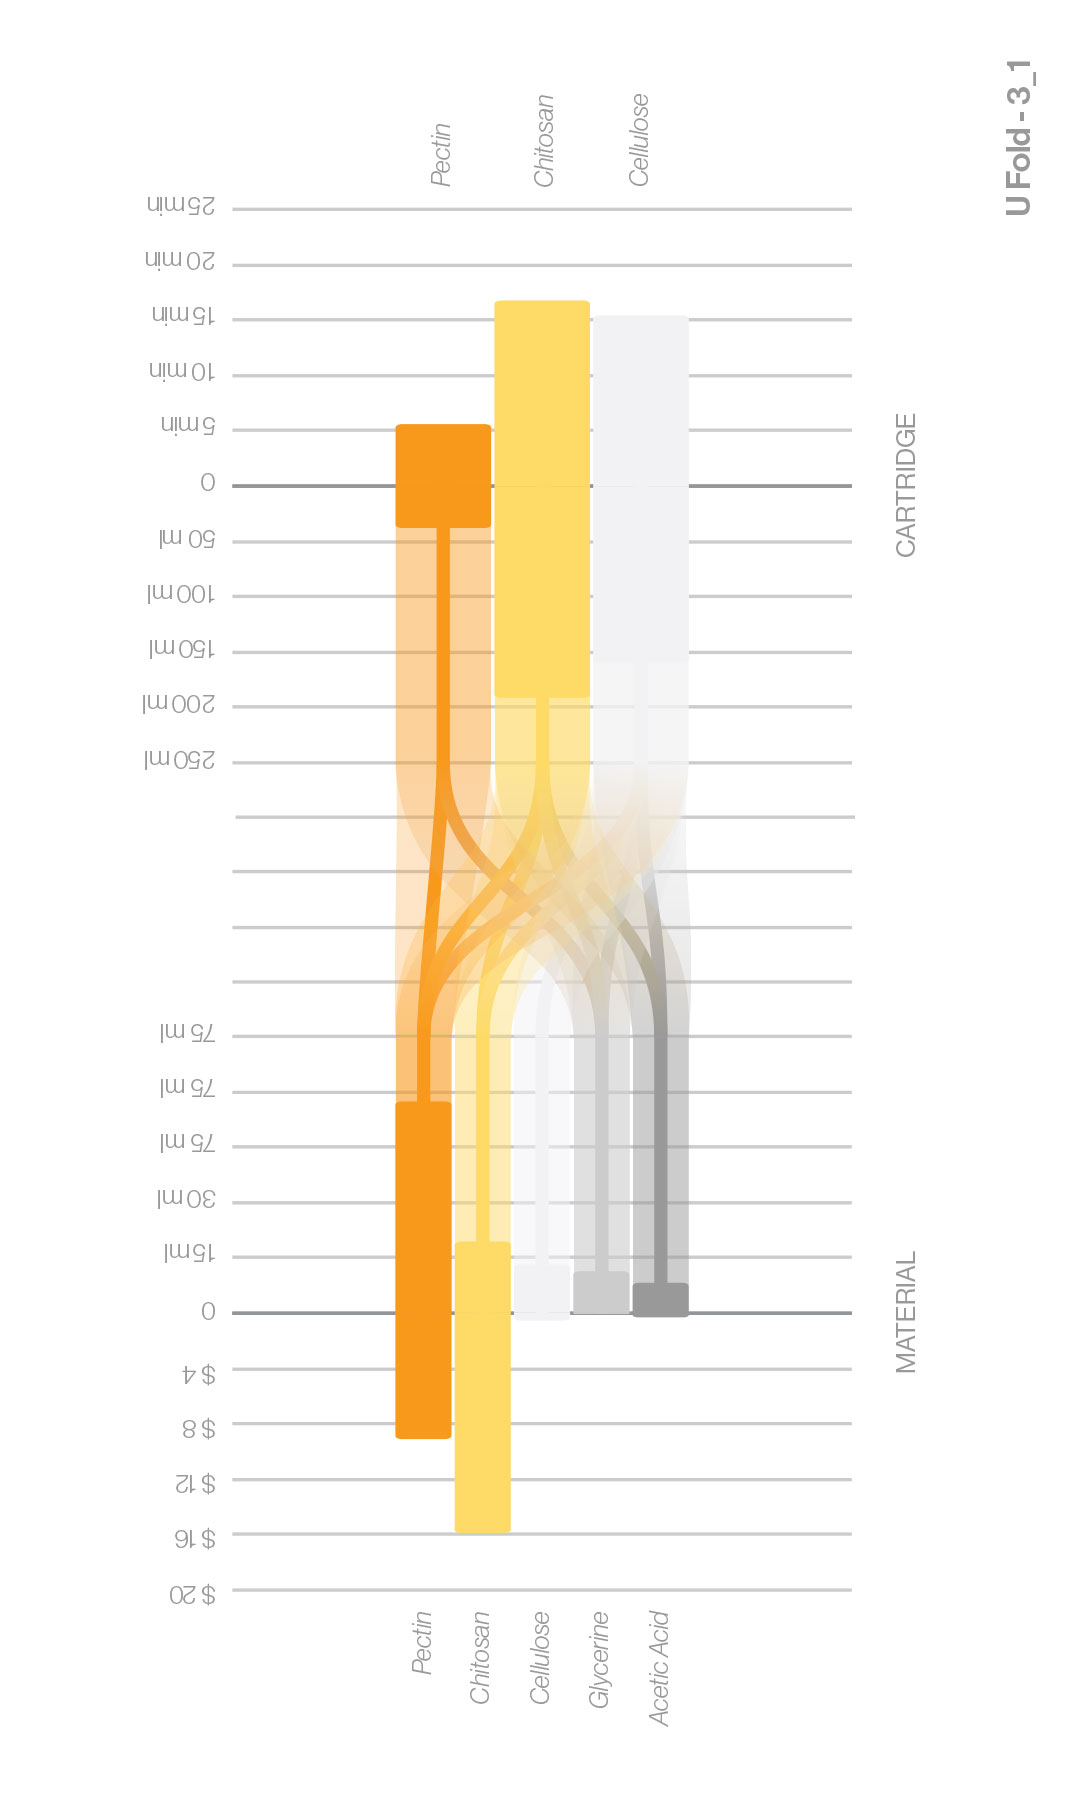
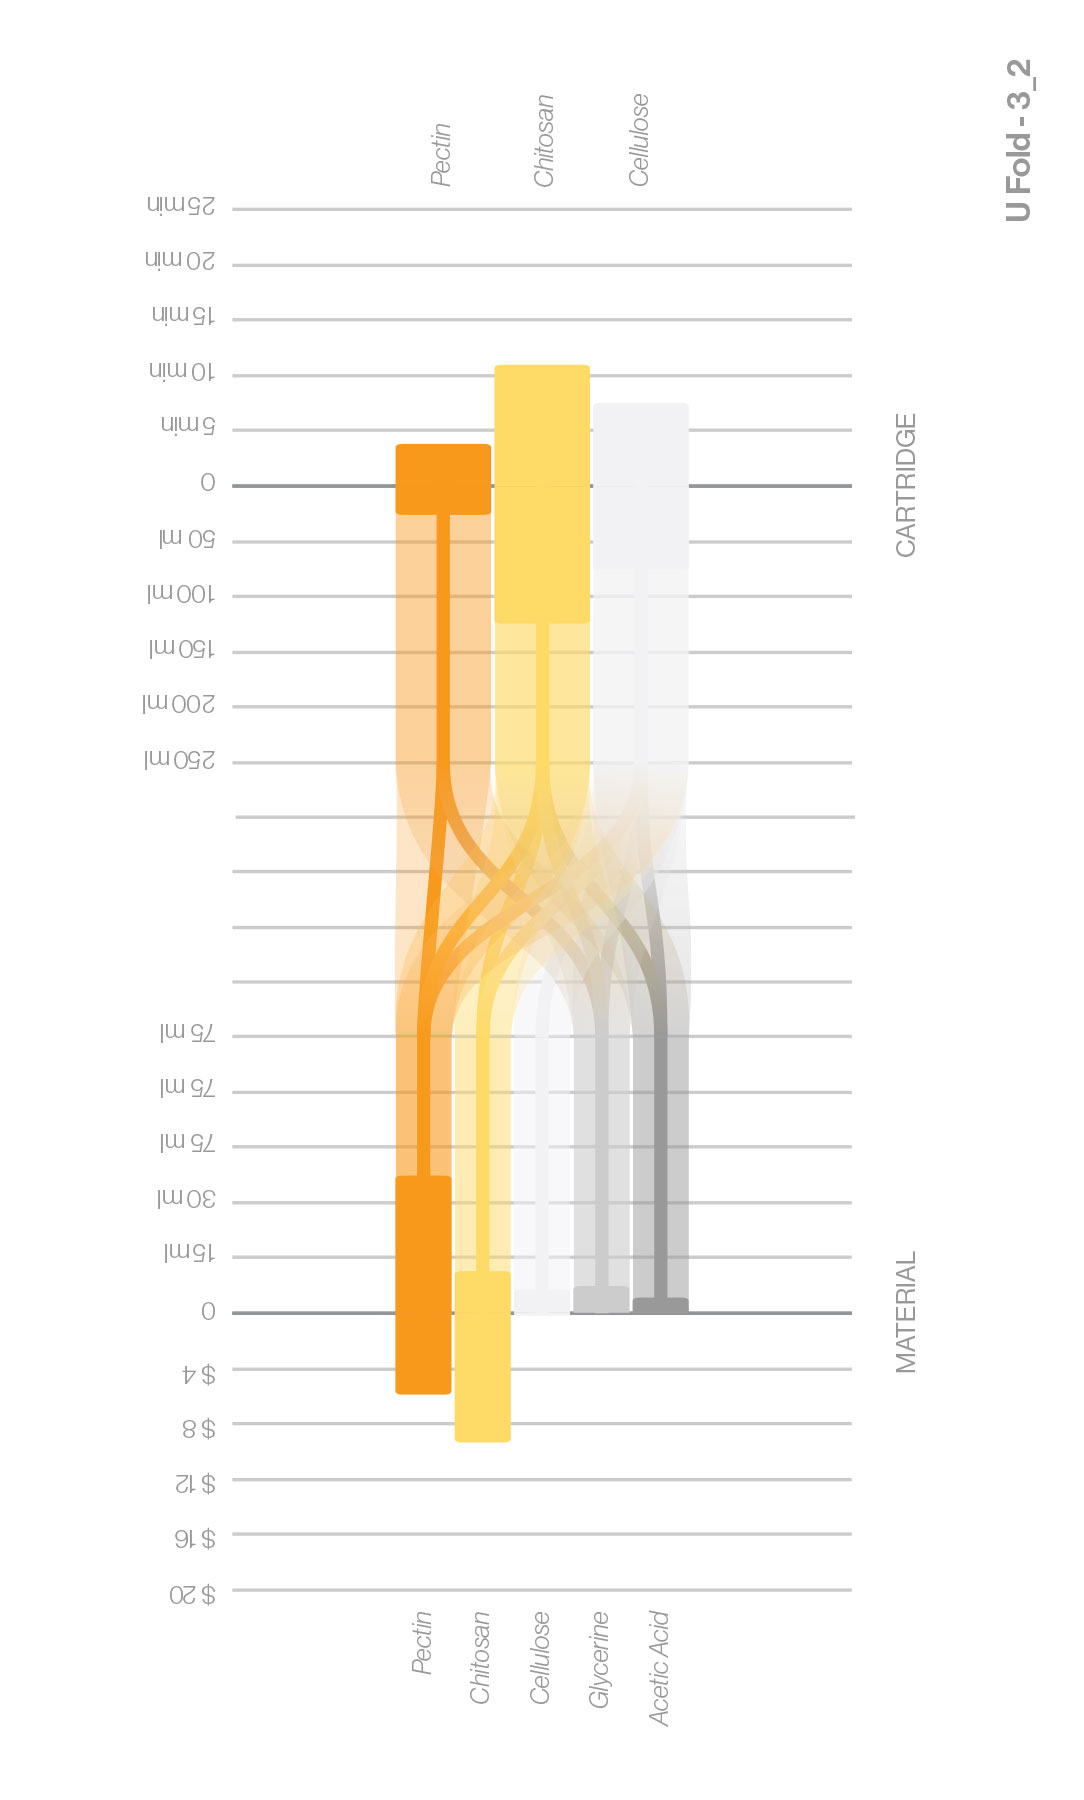
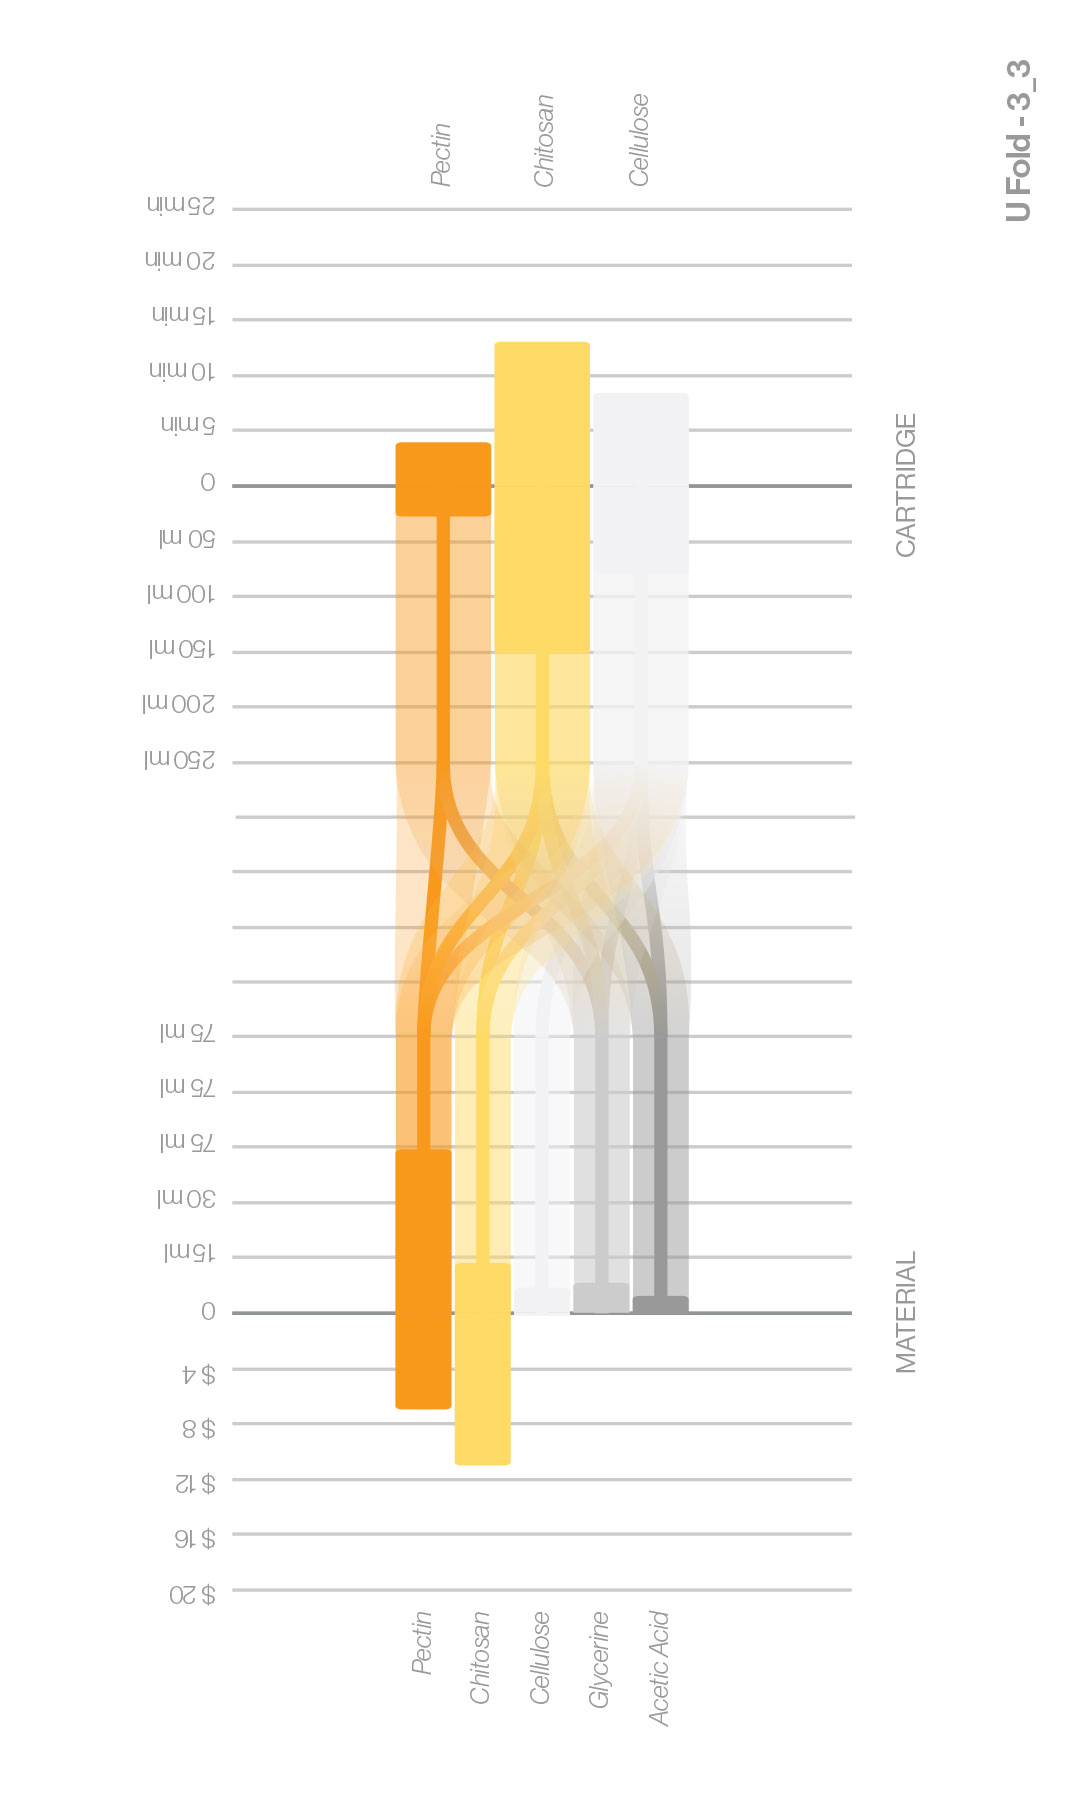

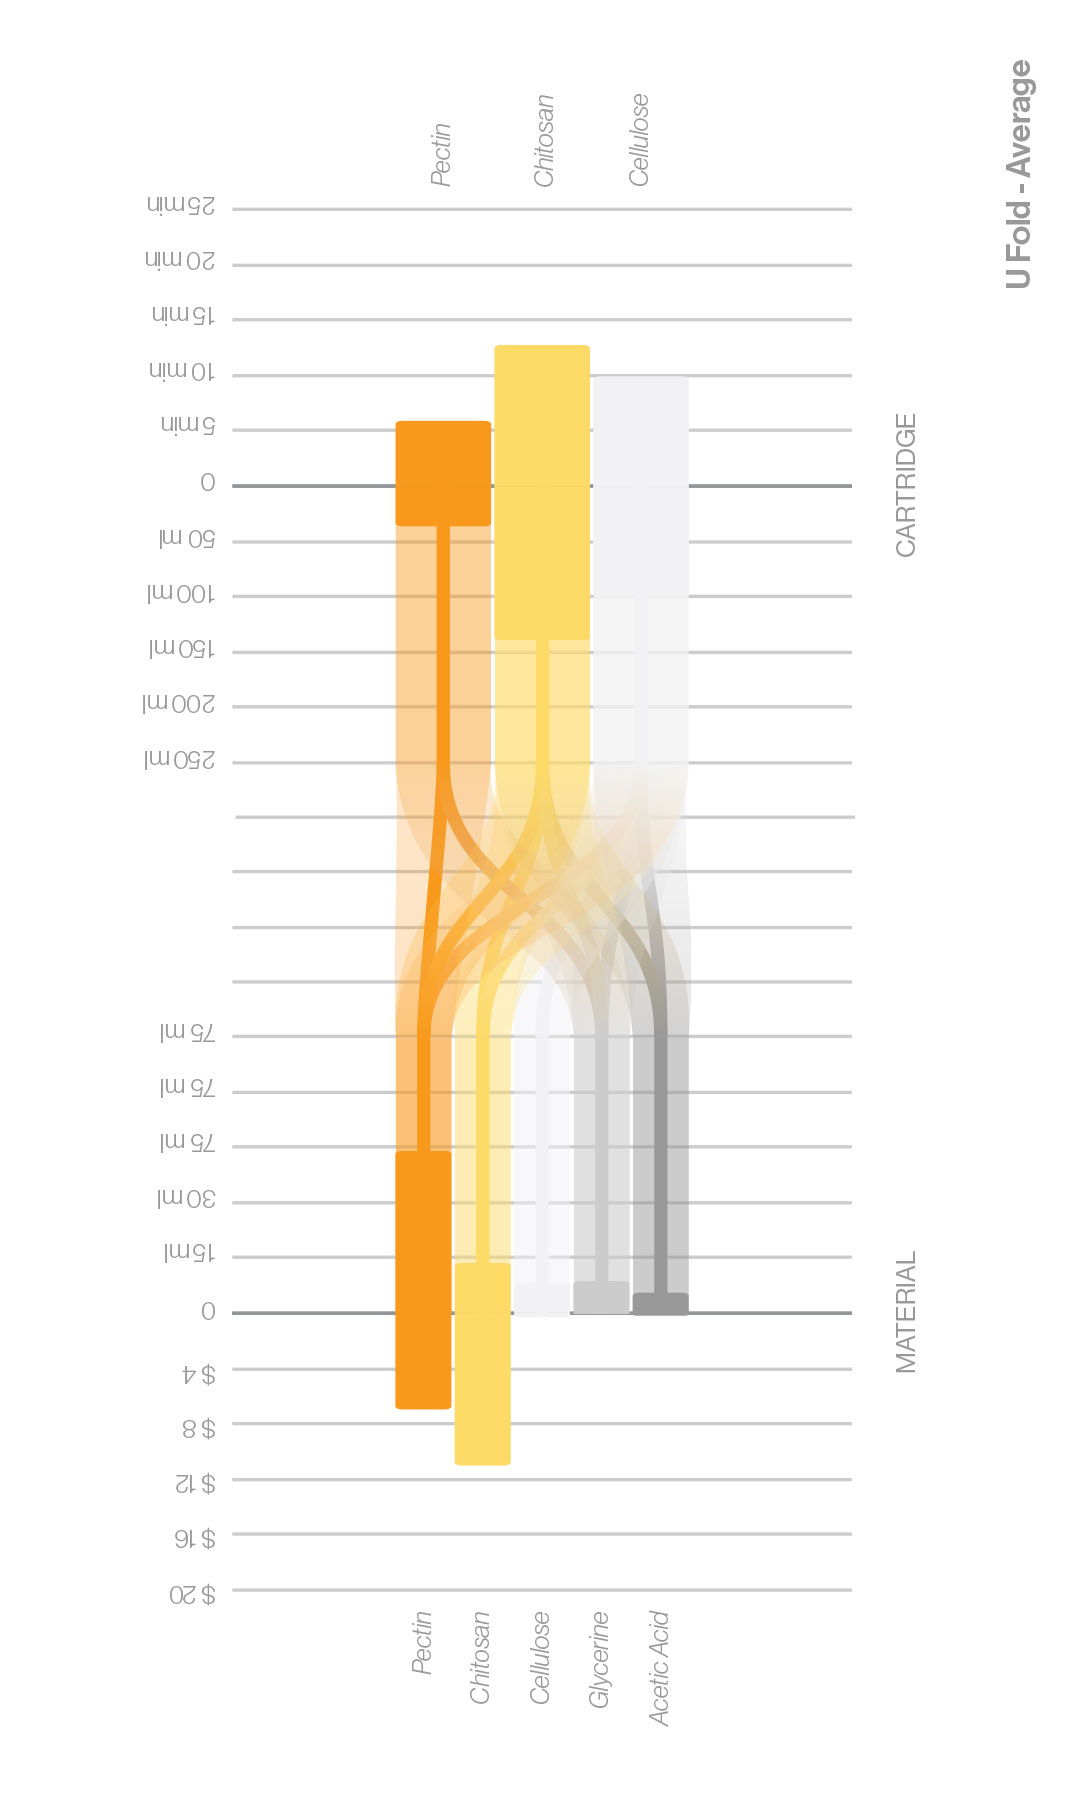
Figure VII: Diagram comparing volume of material, print duration, and cost for differen biopolymer formulas used in each print in the series.
+
U Fold
These experiments examine how centrally aggregated and nested biopolymer surfaces may deform over time. A series of bilaterally symmetric prints are composed of a pectin chitosan infill base layer with a cellulose lattice surface layer. The center lines of each print have a region of pectin infill printed above the cellulose lattice. A set of 10 different prints are clamped along the wetted central pectin spine to adhere all surfaces together. The edges of each of these surfaces are exposed to a humidifier and folded into adjacent surfaces.
- Exposure to air is recorded during the first month and at 18 months.
- Folded shapes are imaged with and without backlighting in plan view.
- Changes in color are visible.
1 nested aggregate of 16 biopolymer surfaces are tested that control for the same materials and print orders but vary the 3-dimensional geometries: https://designedecologies.com/U-Fold
Although the symmetrical aggregate does not experience major deformation, portions have cracked due to internal pressures. There is significant color change