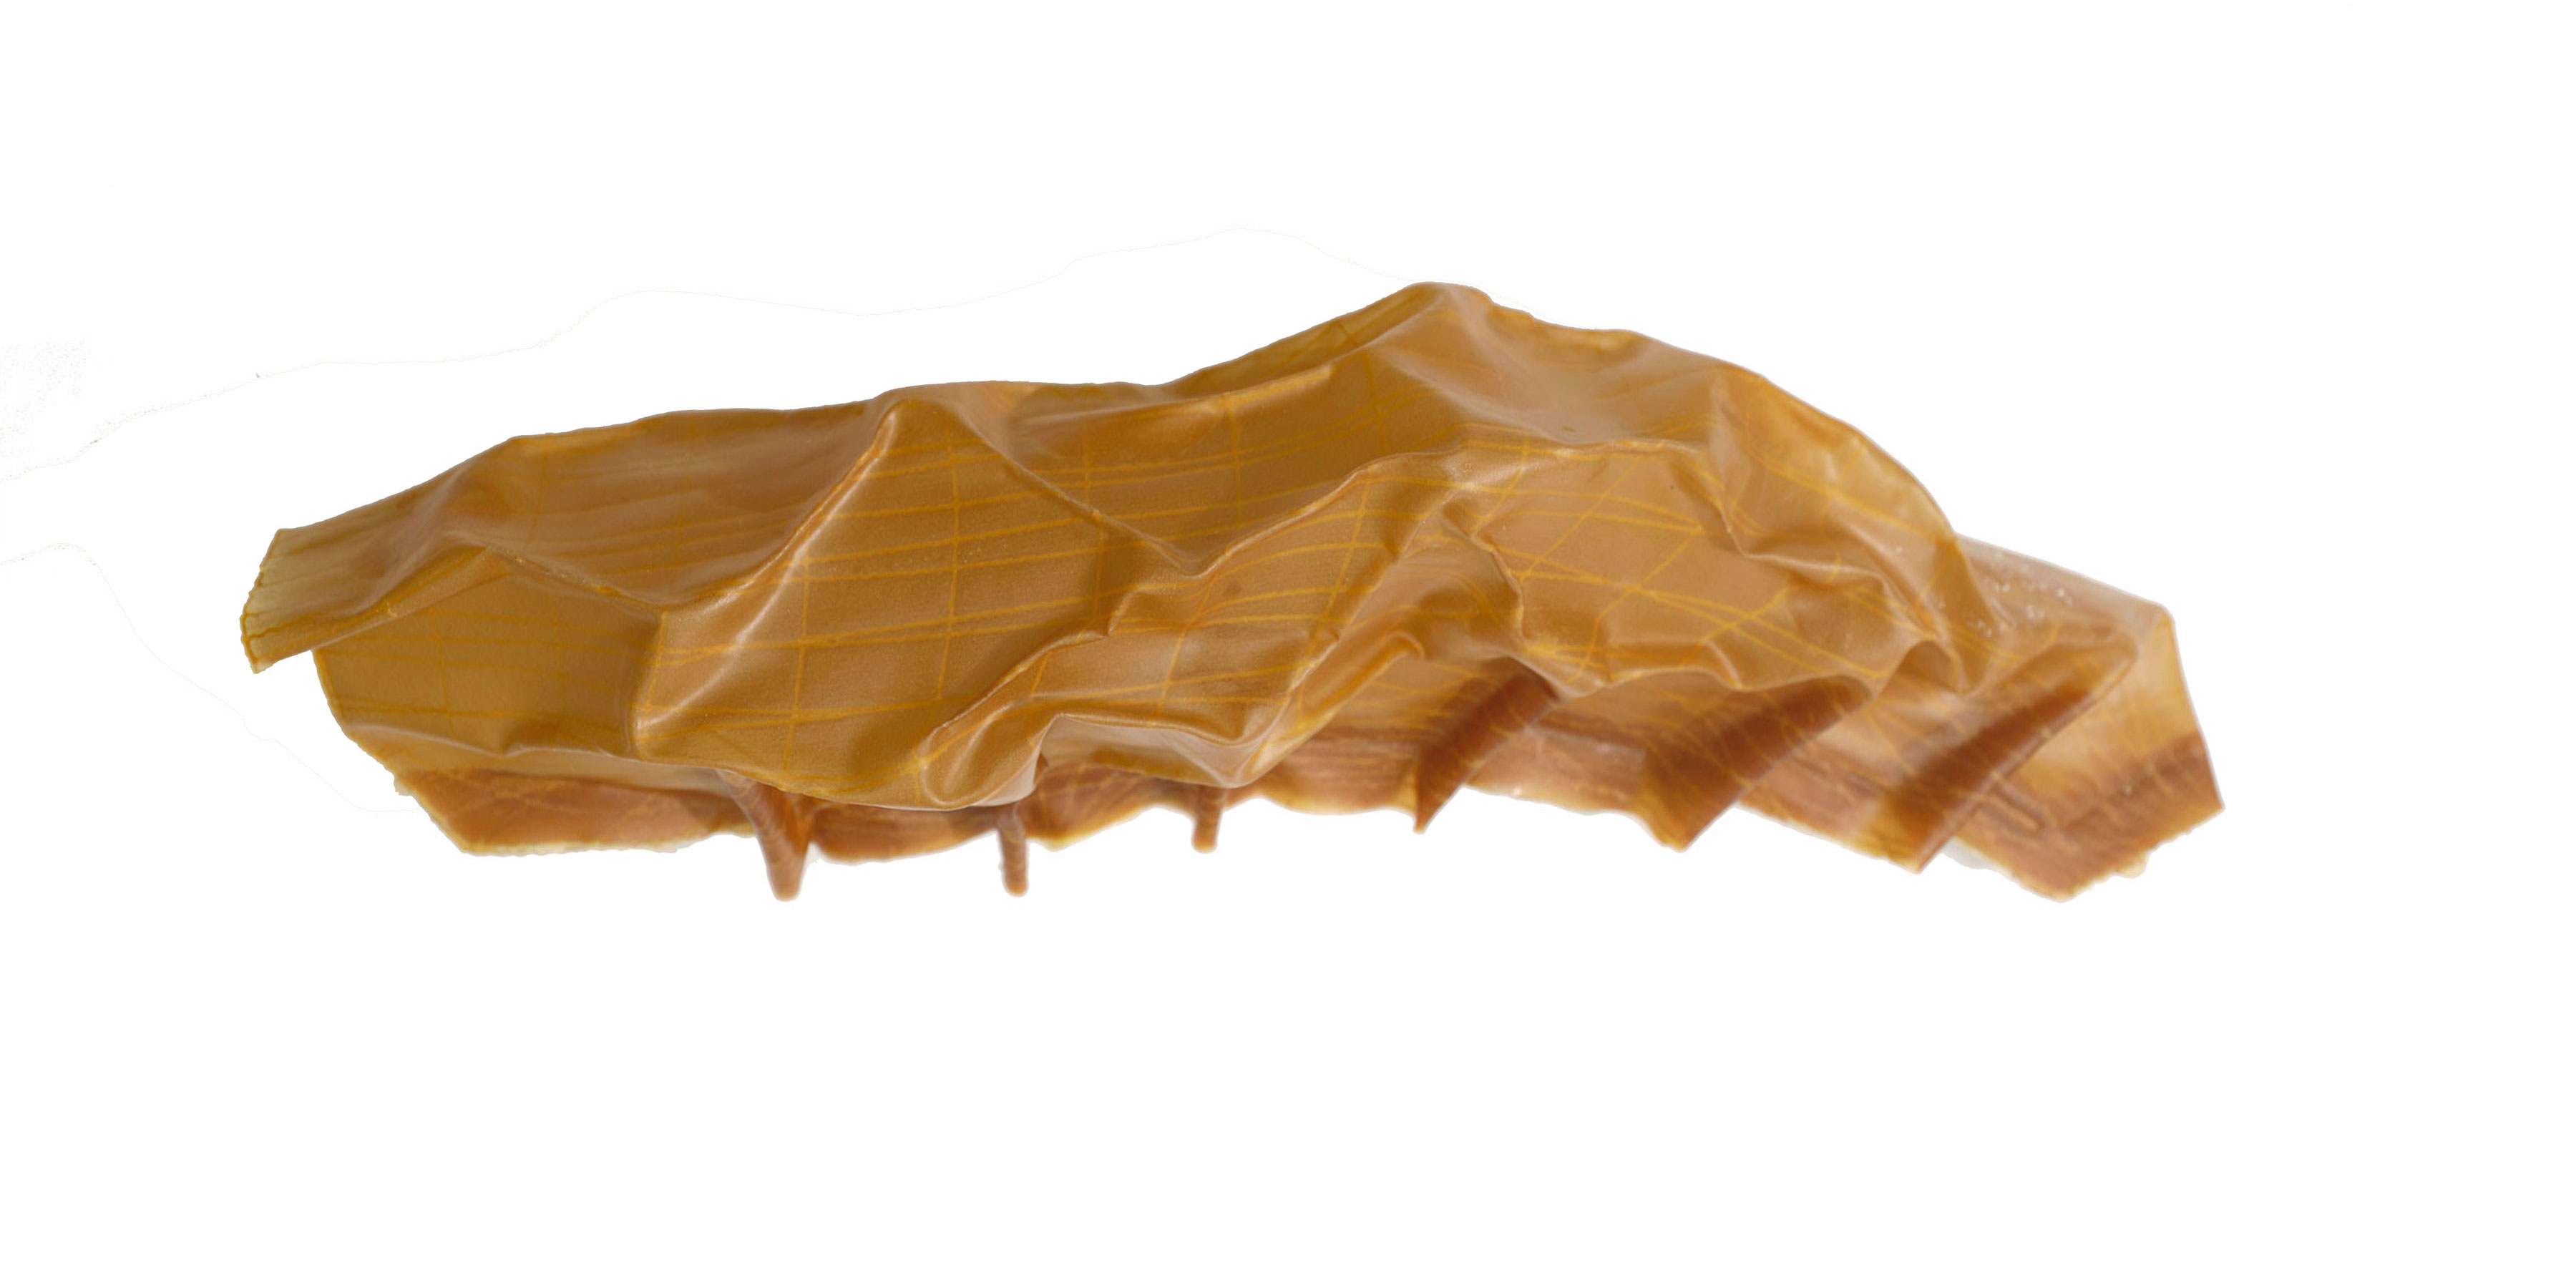
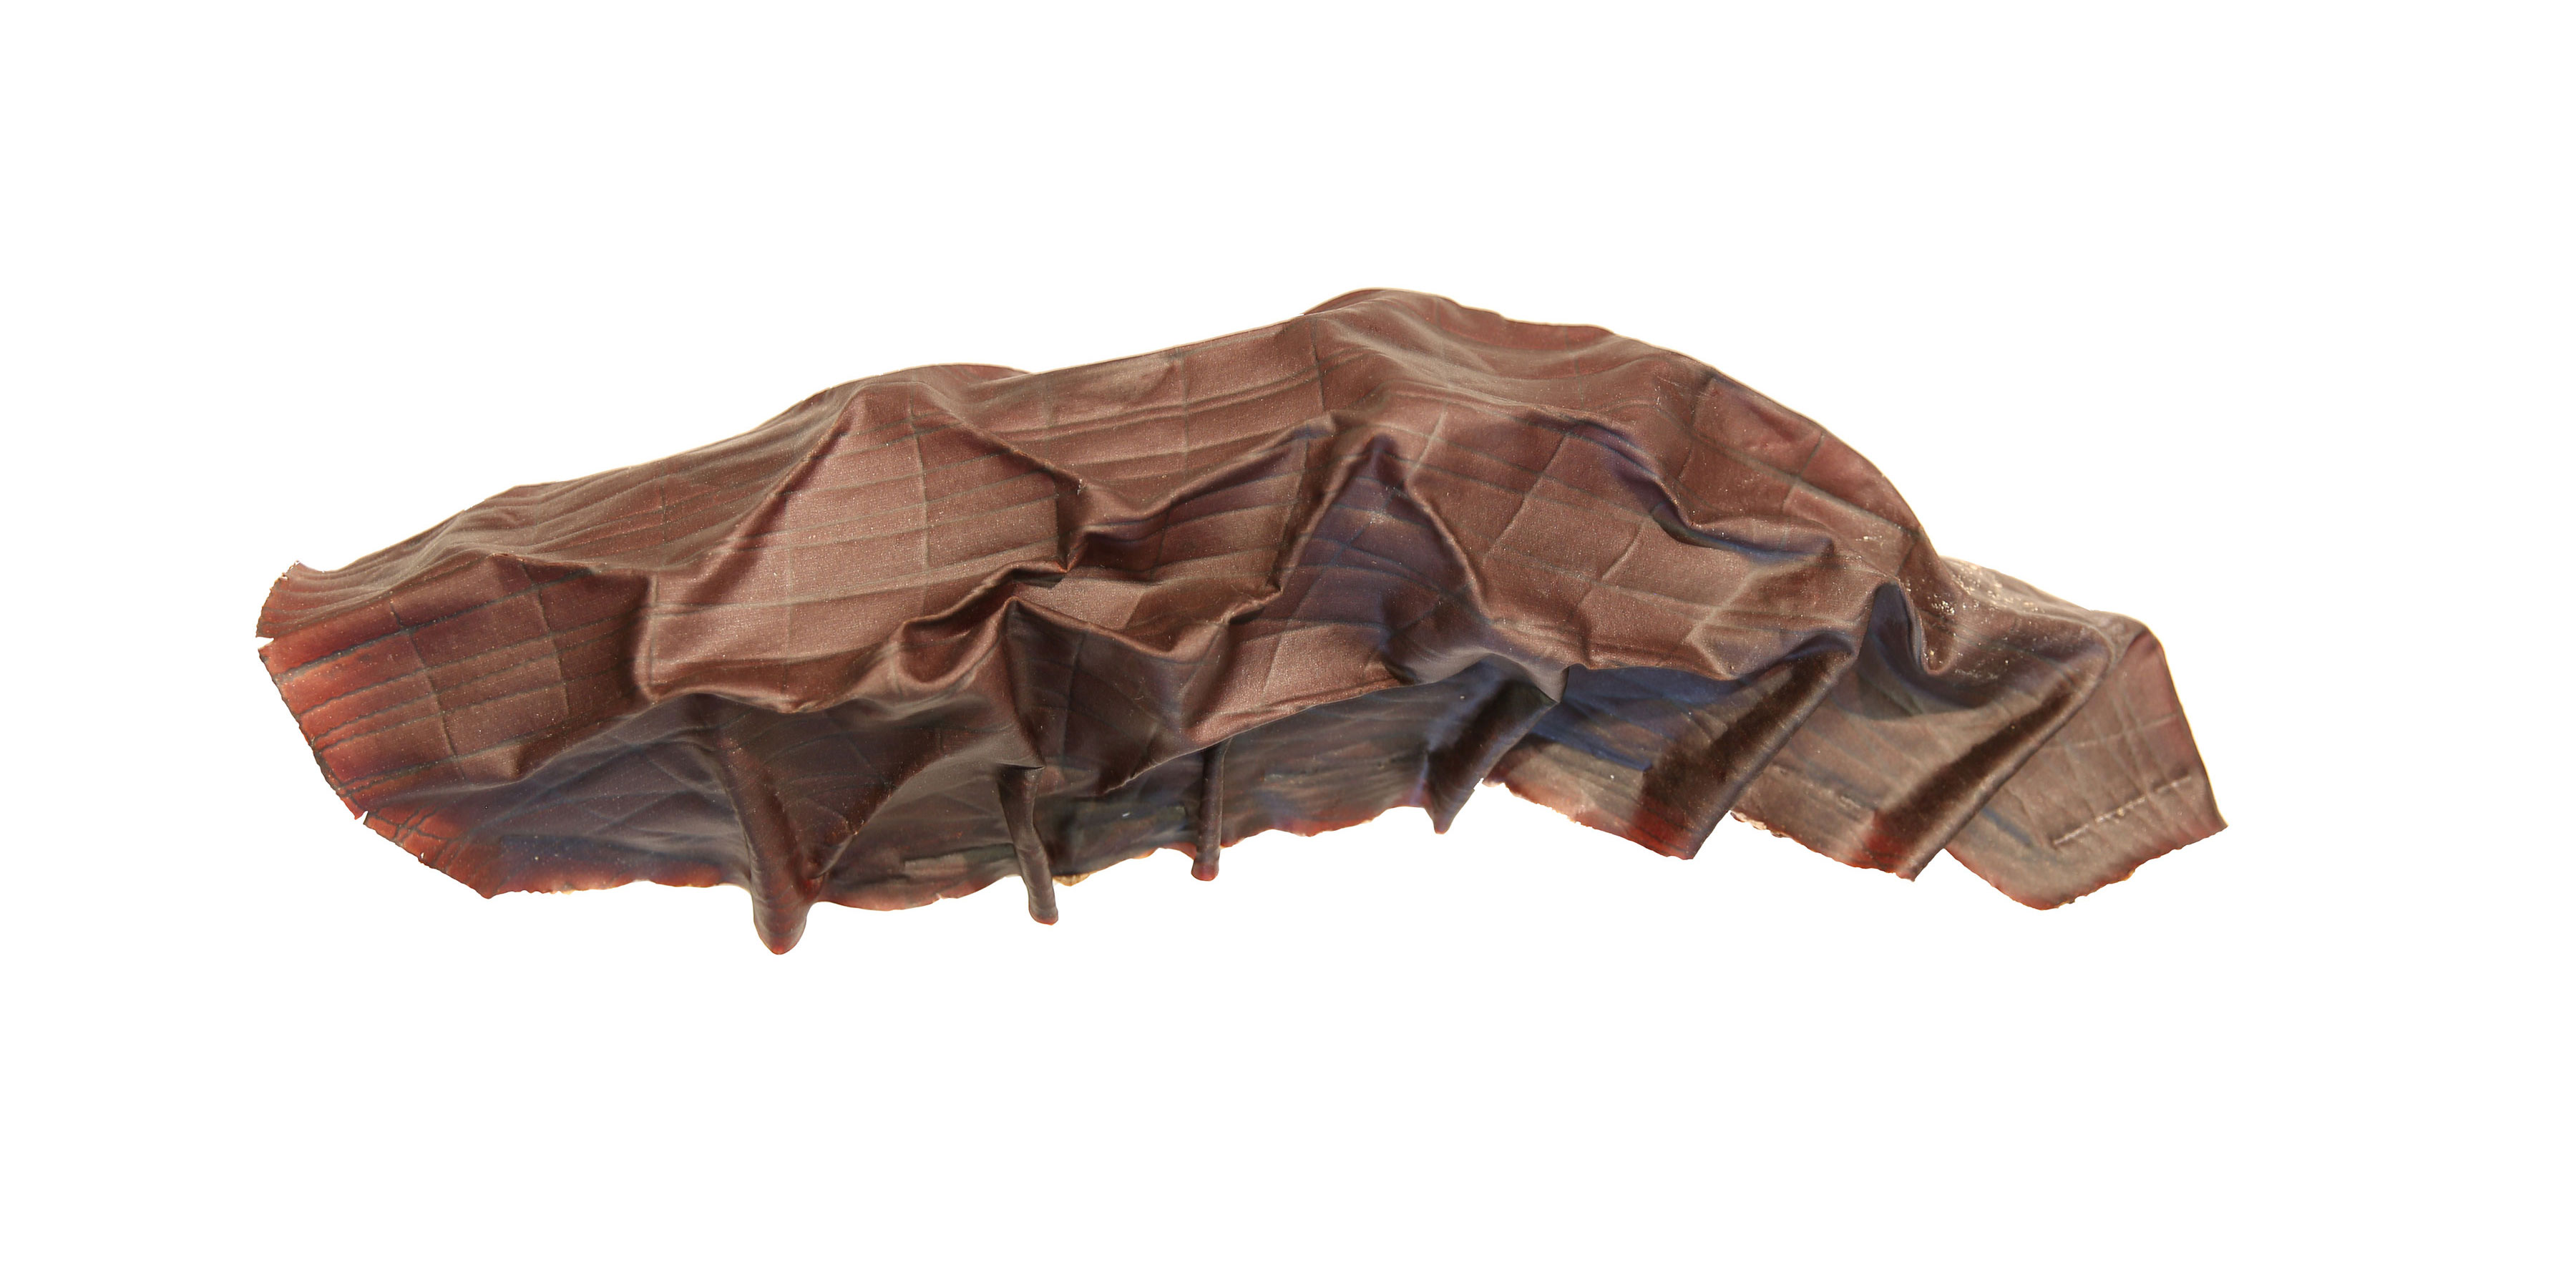
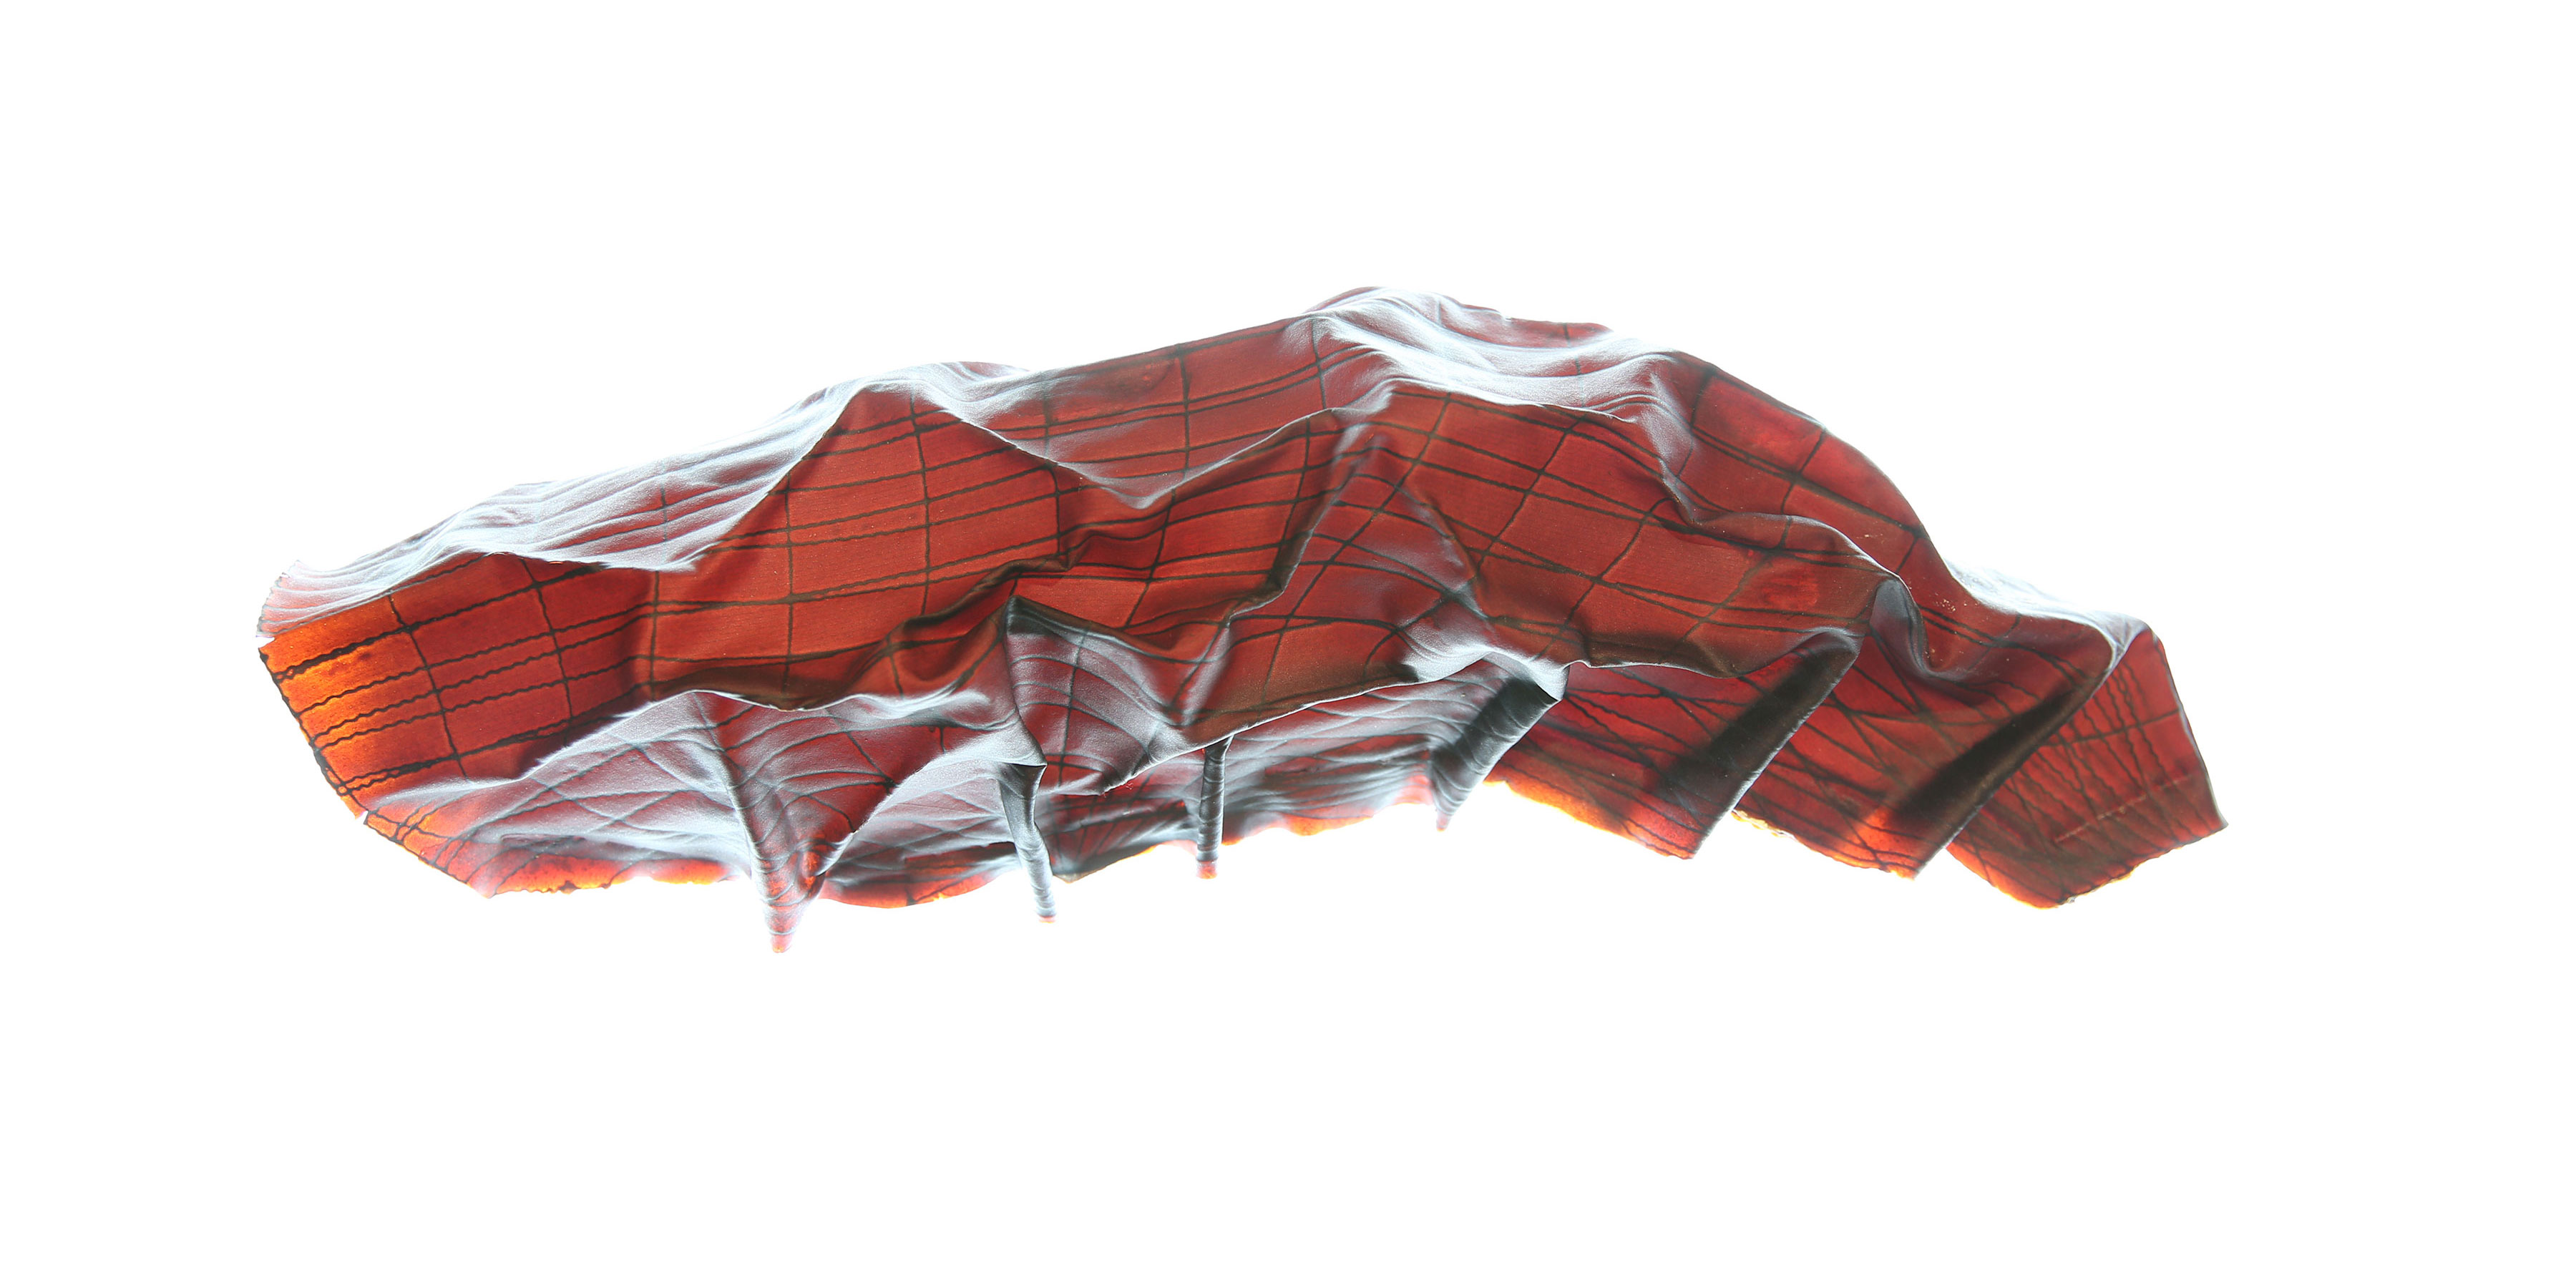
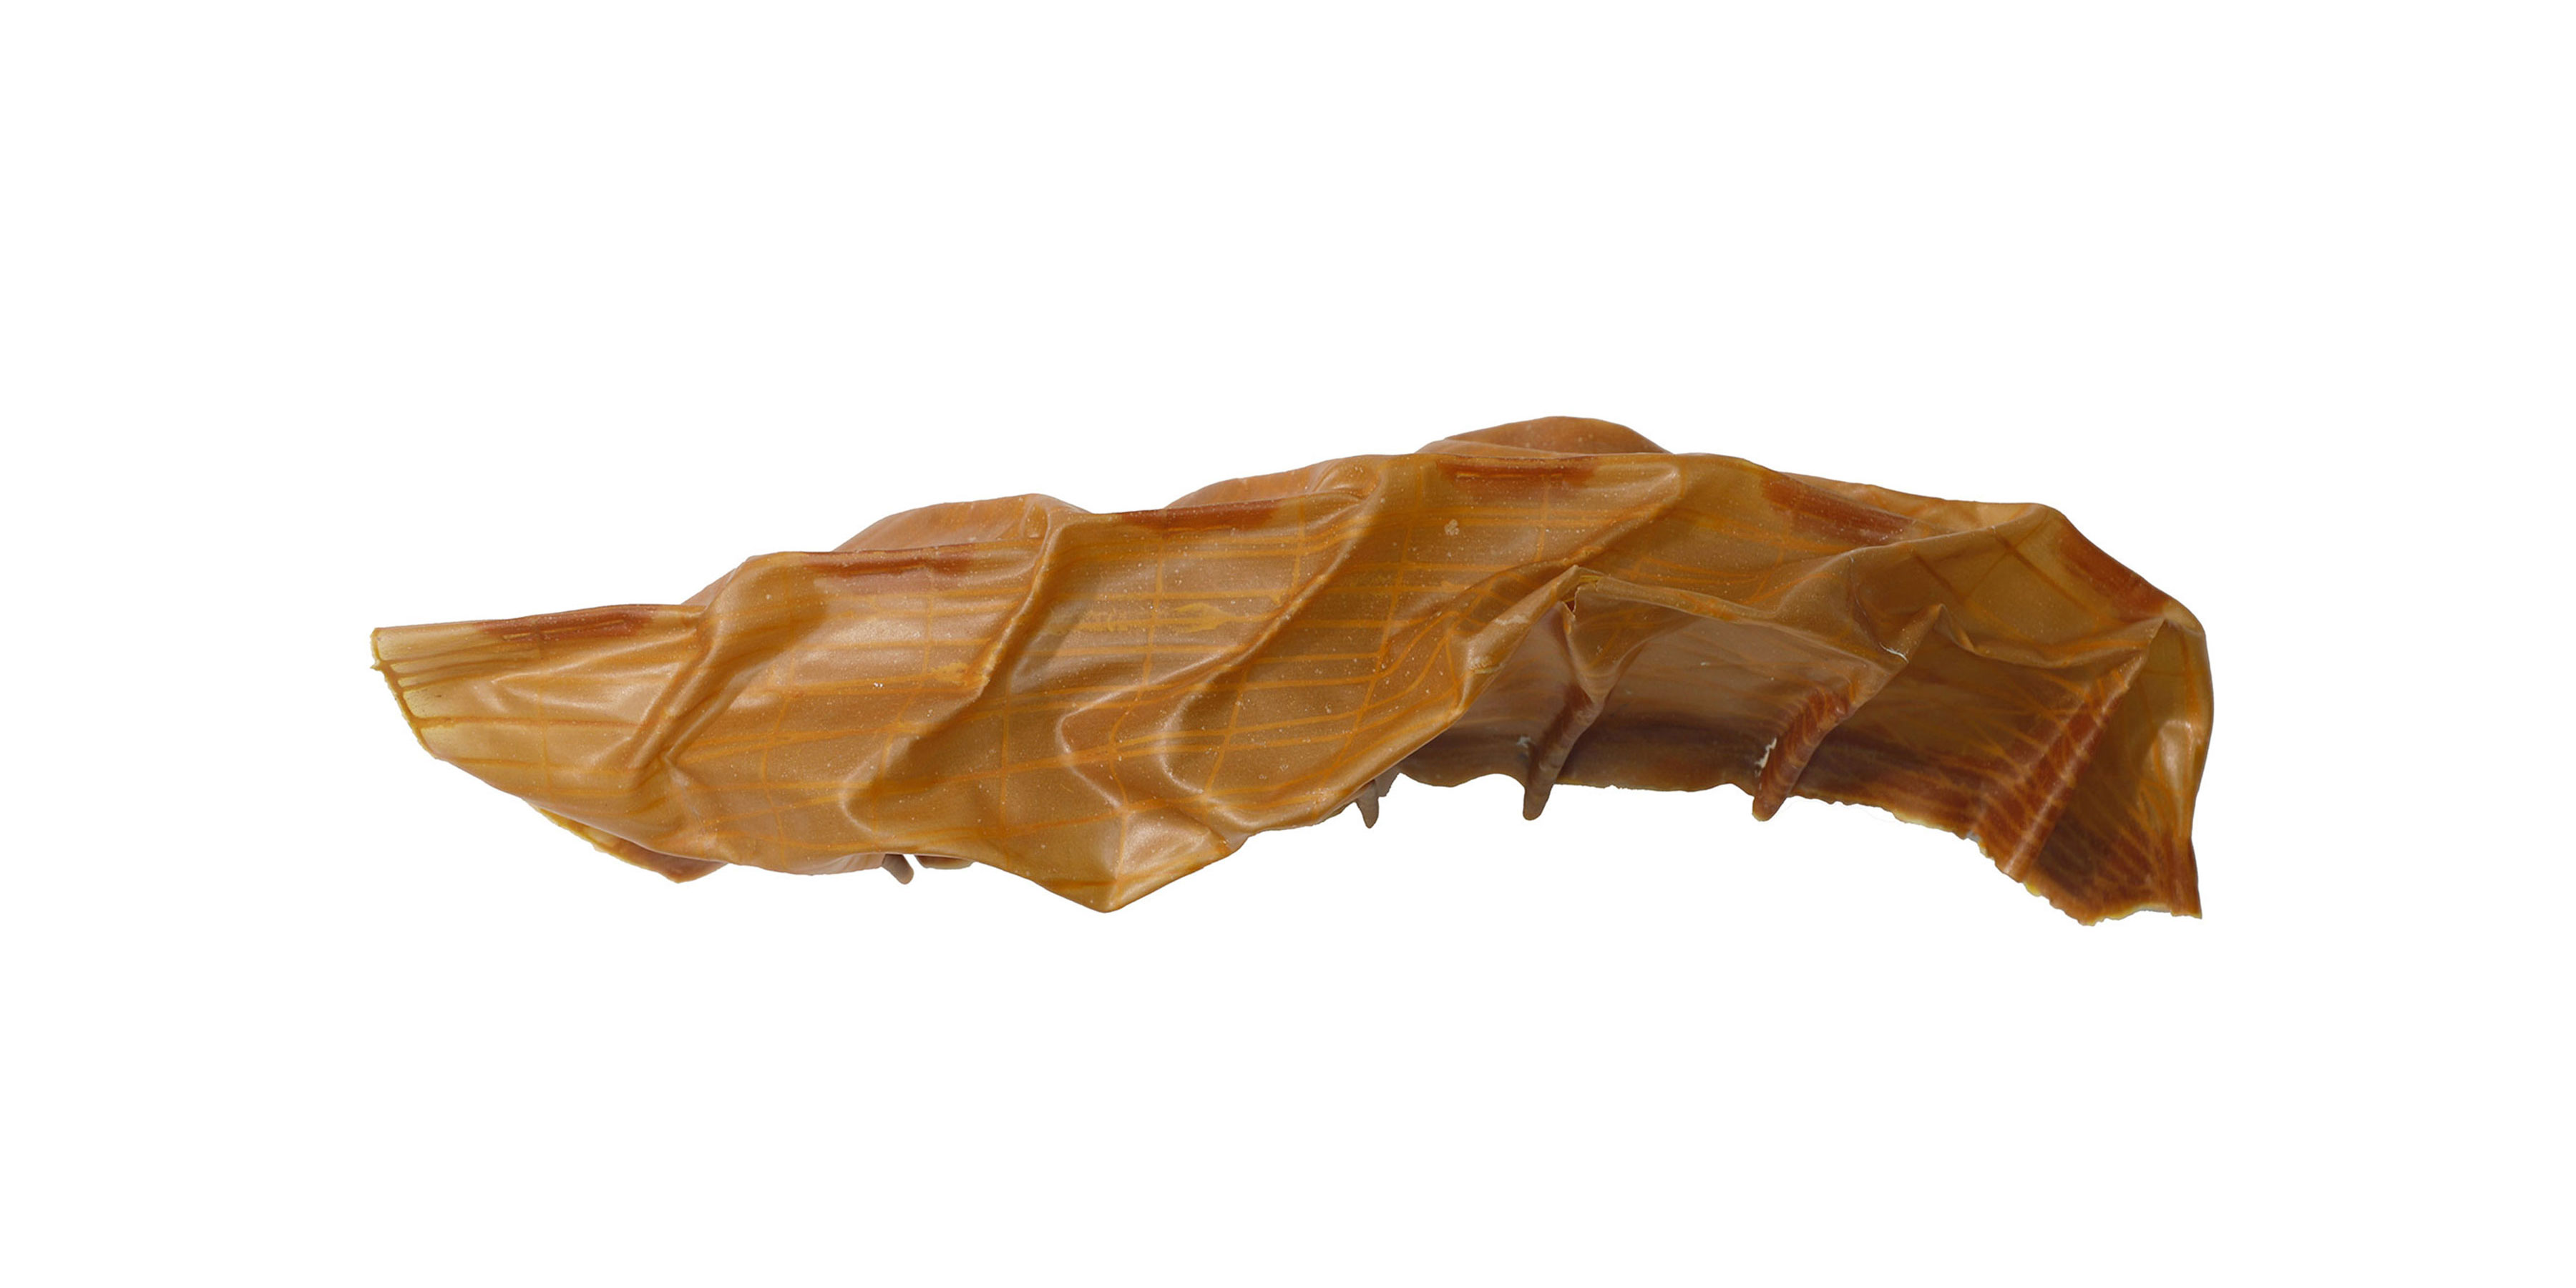
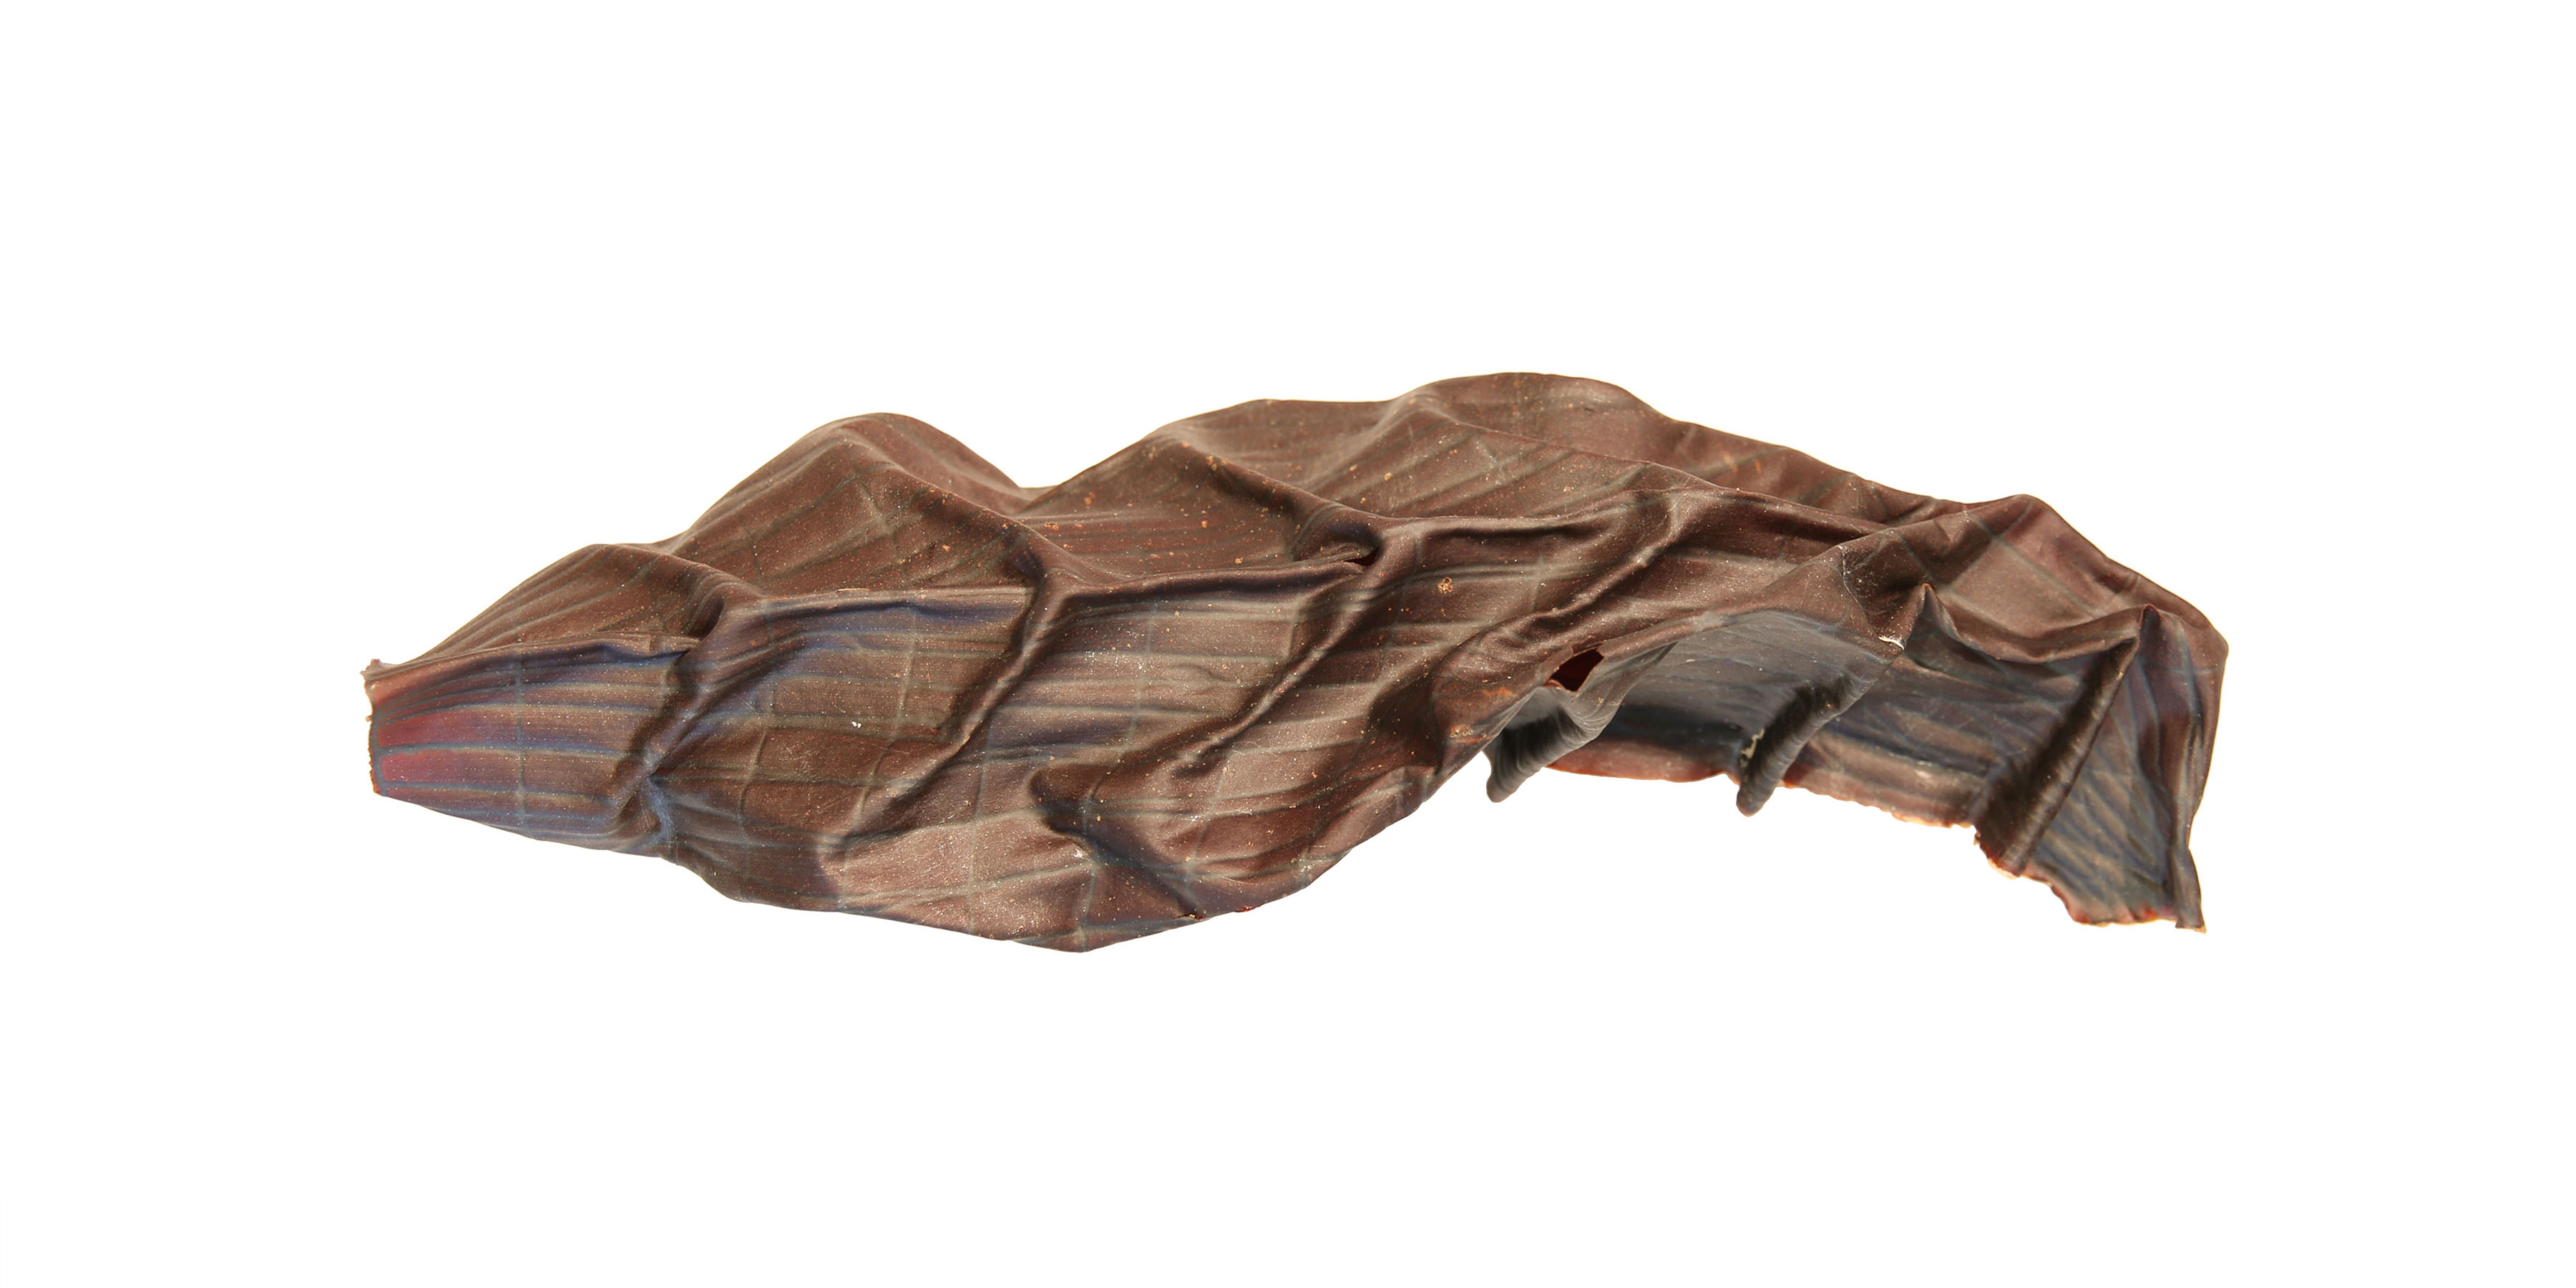
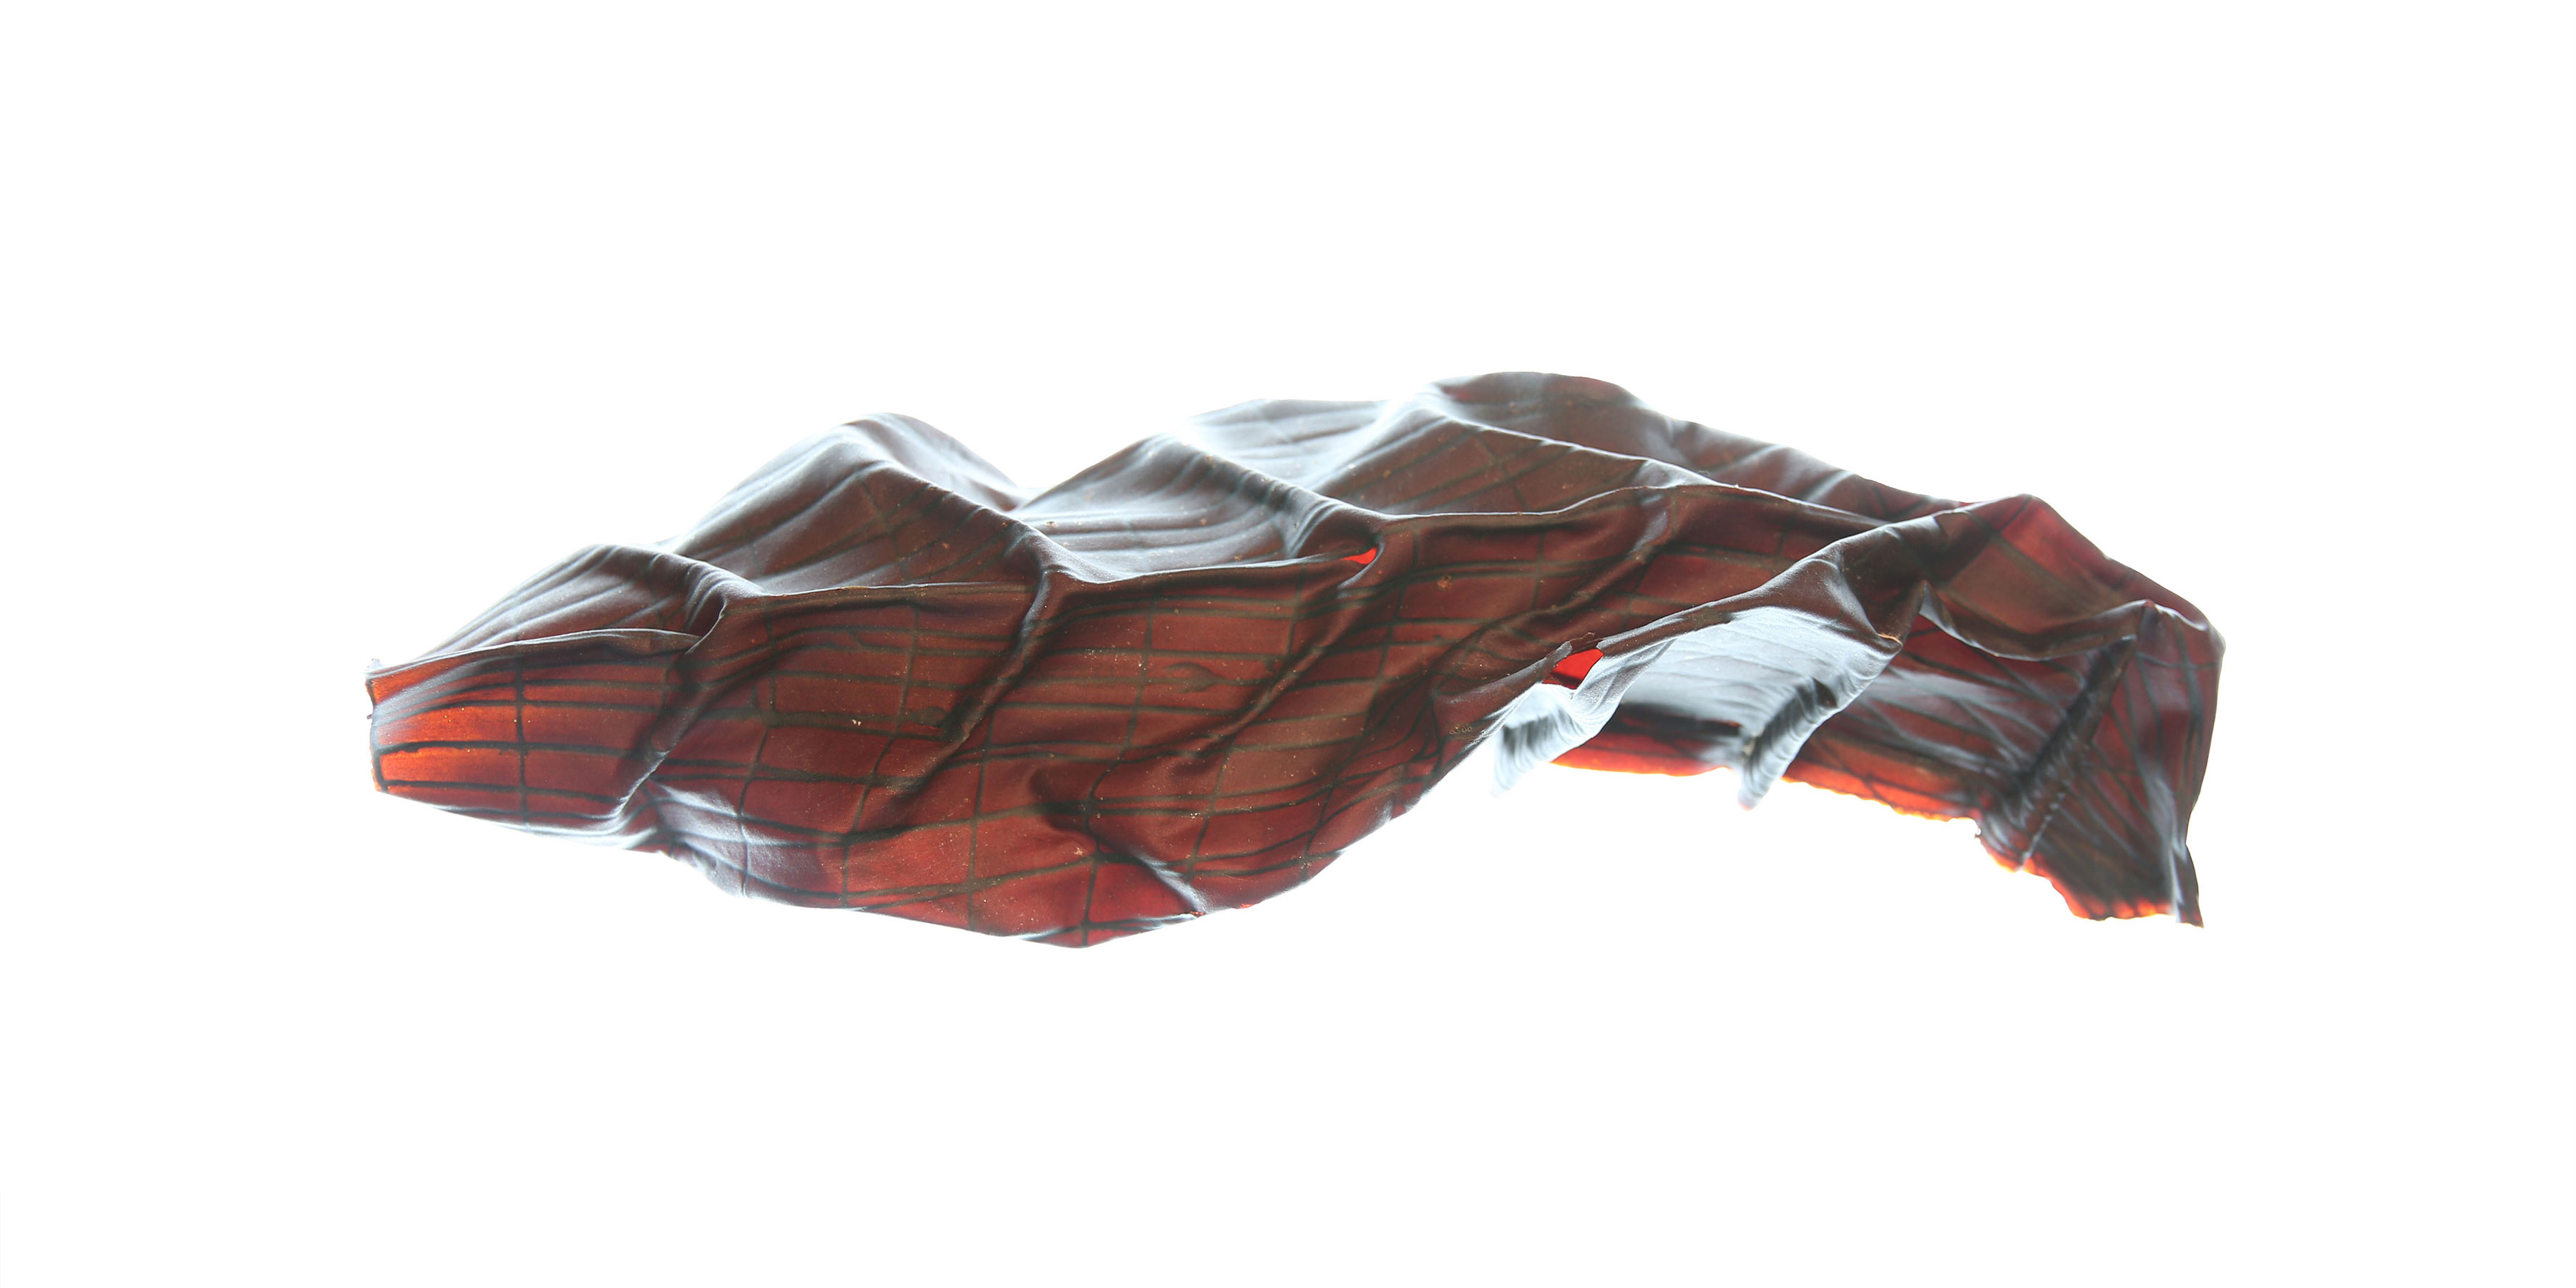

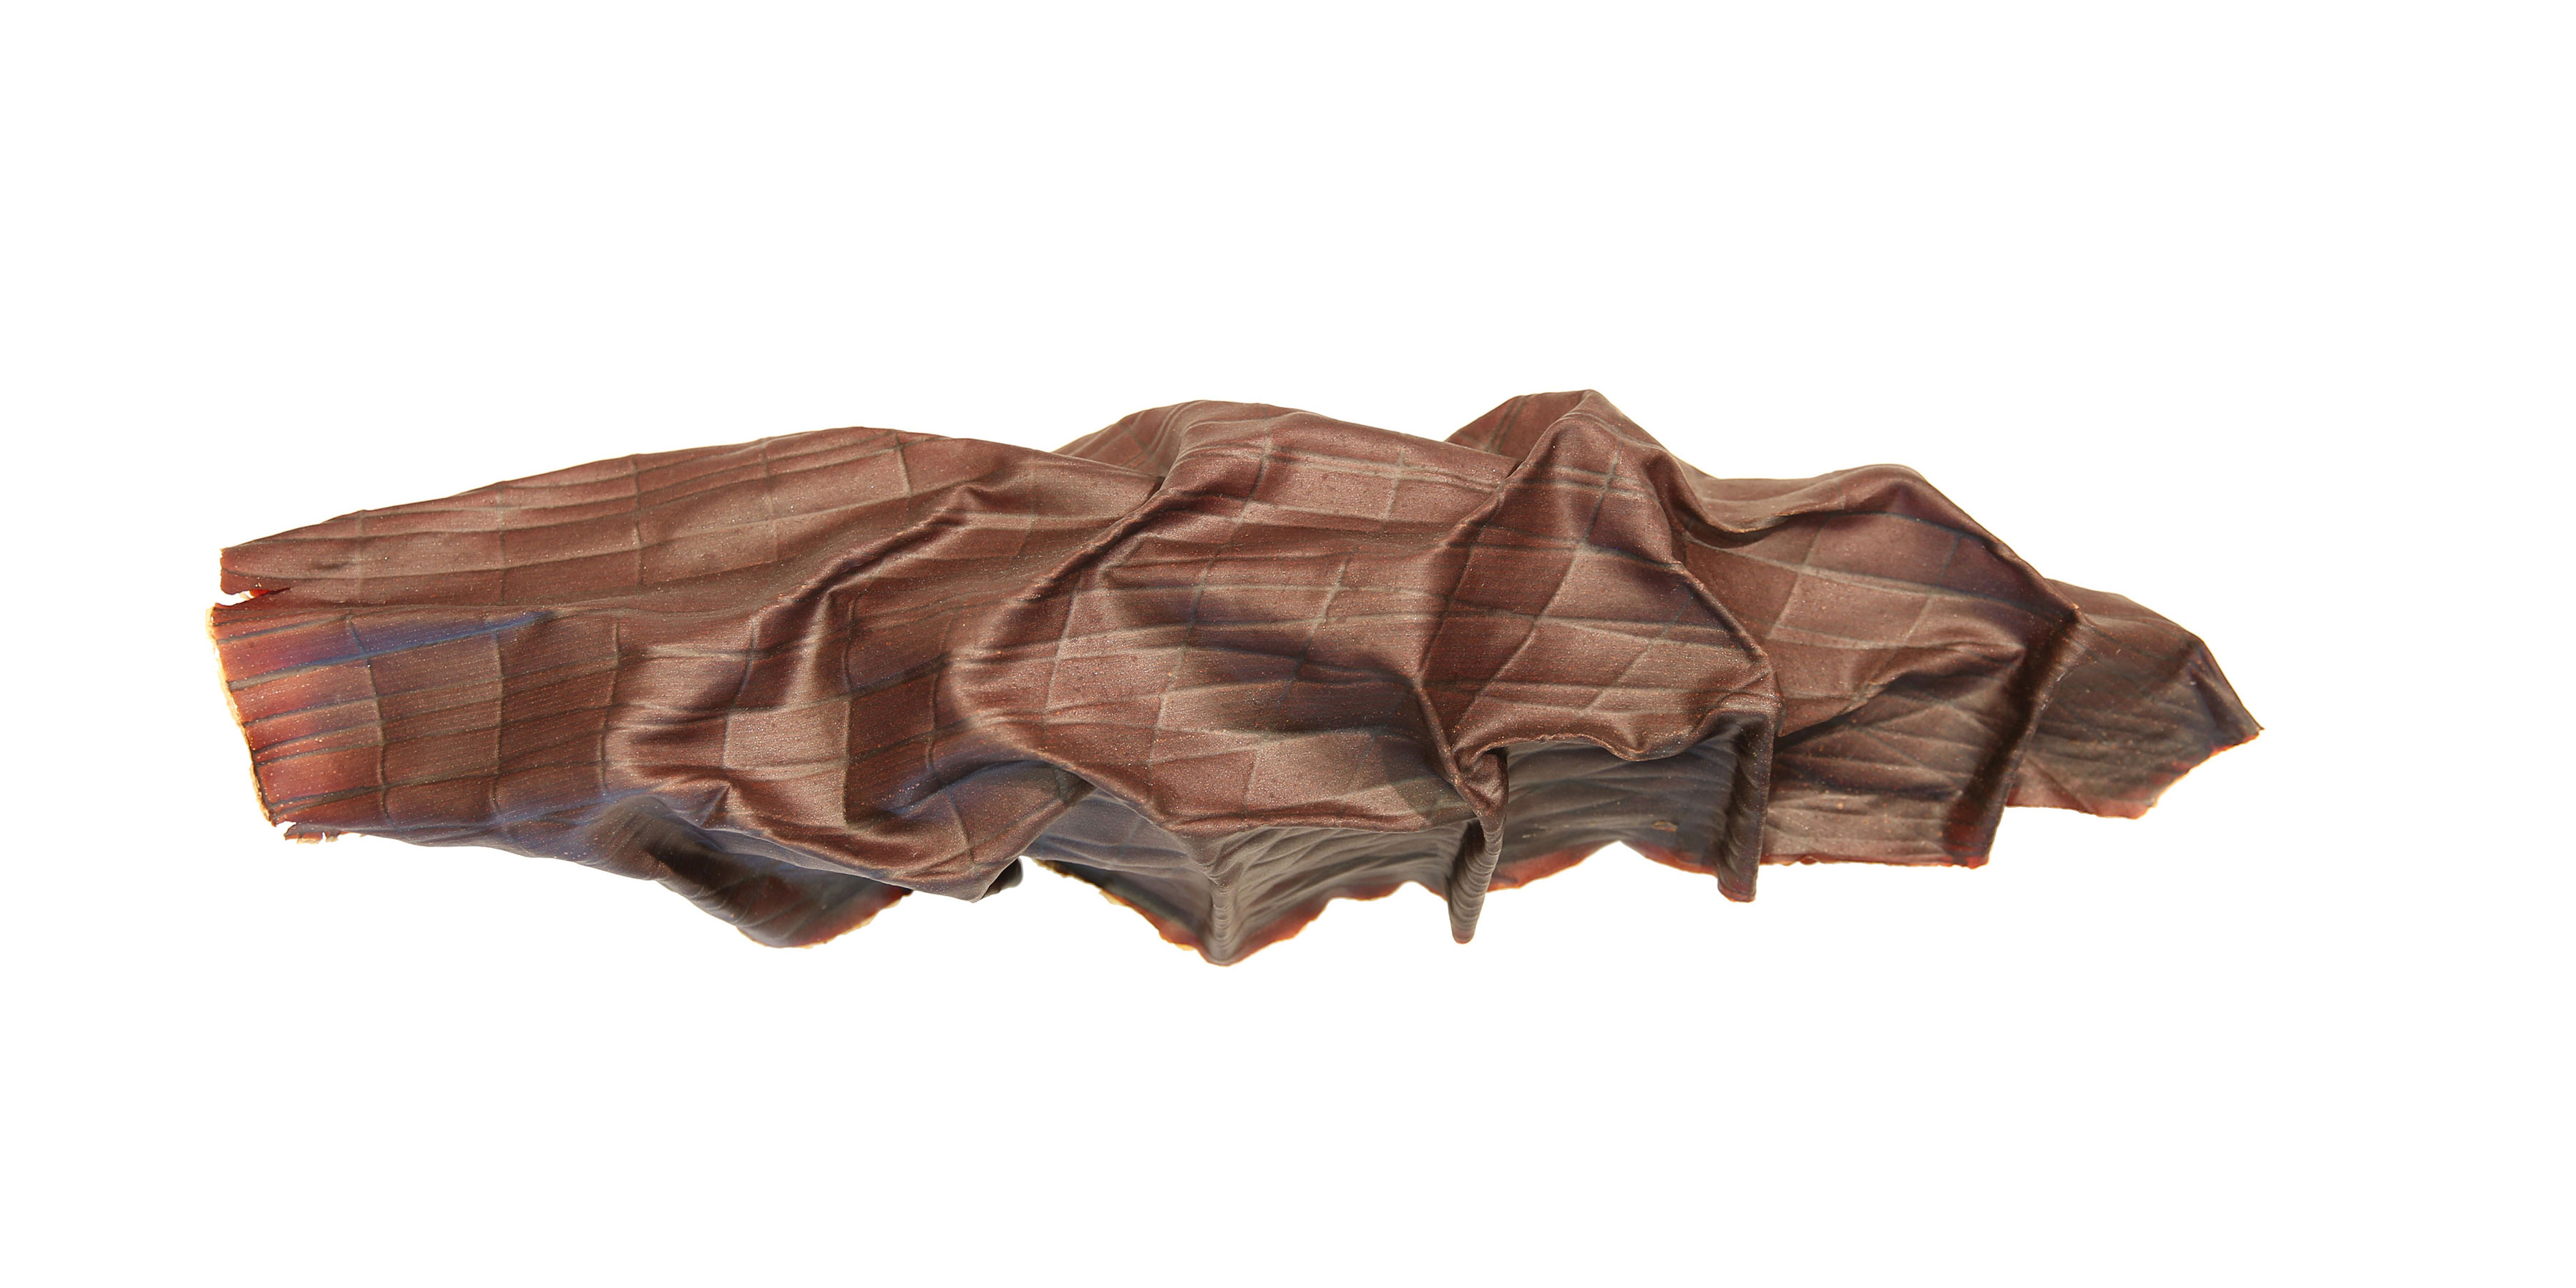
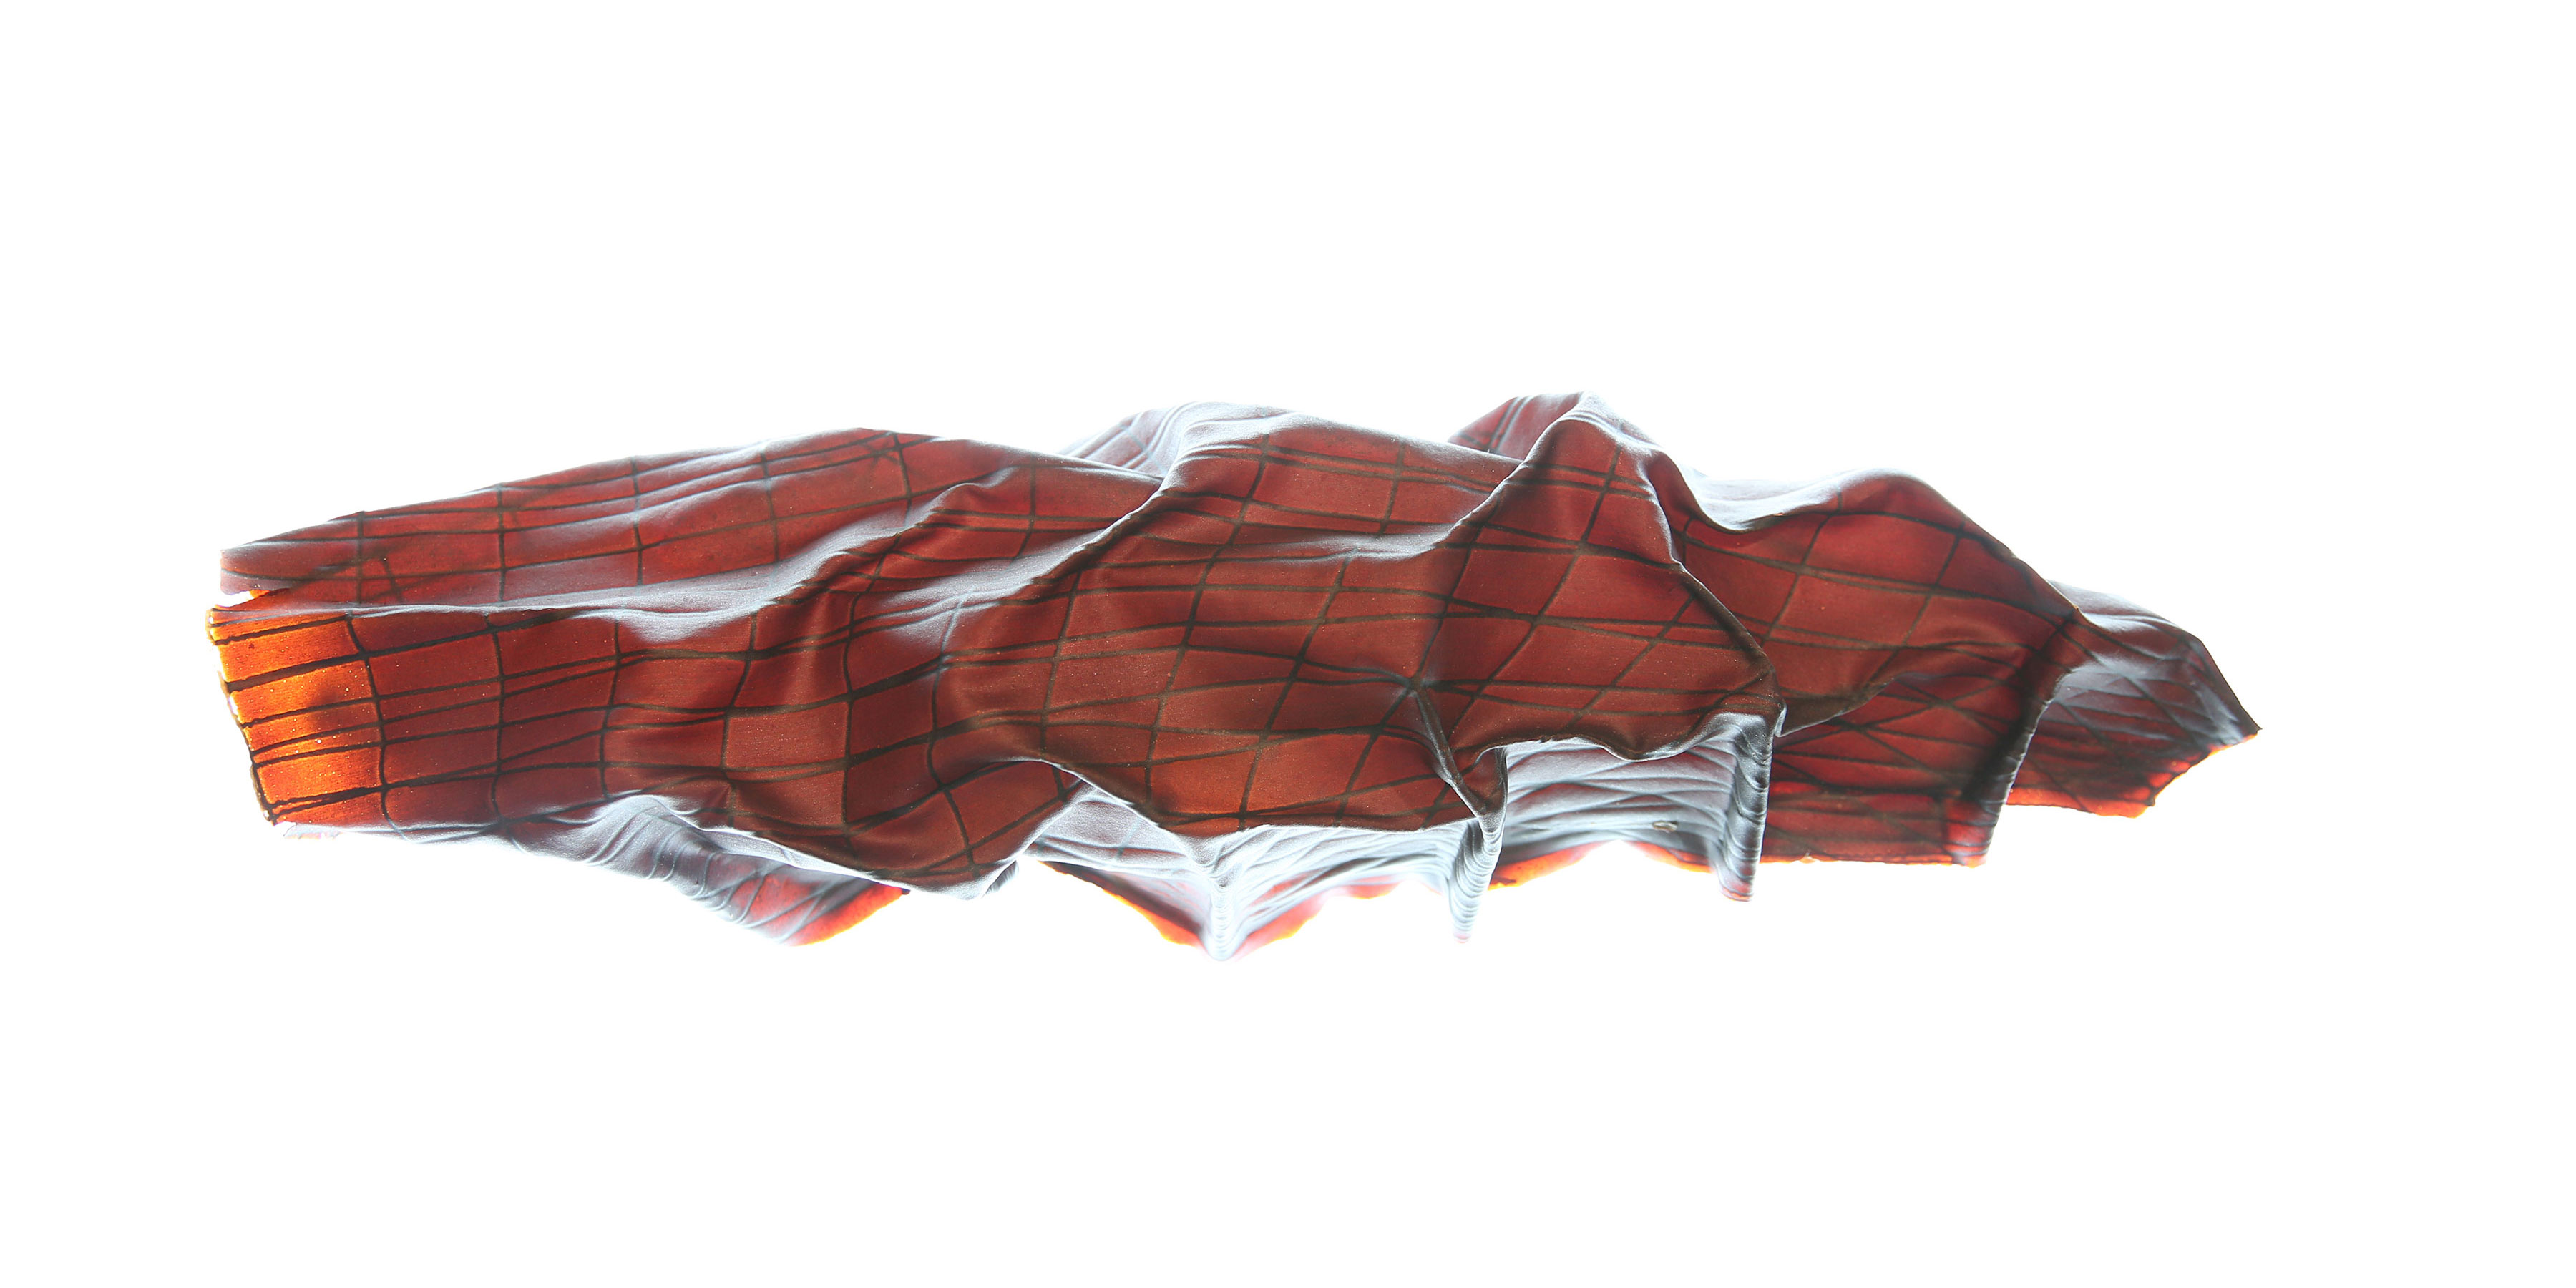


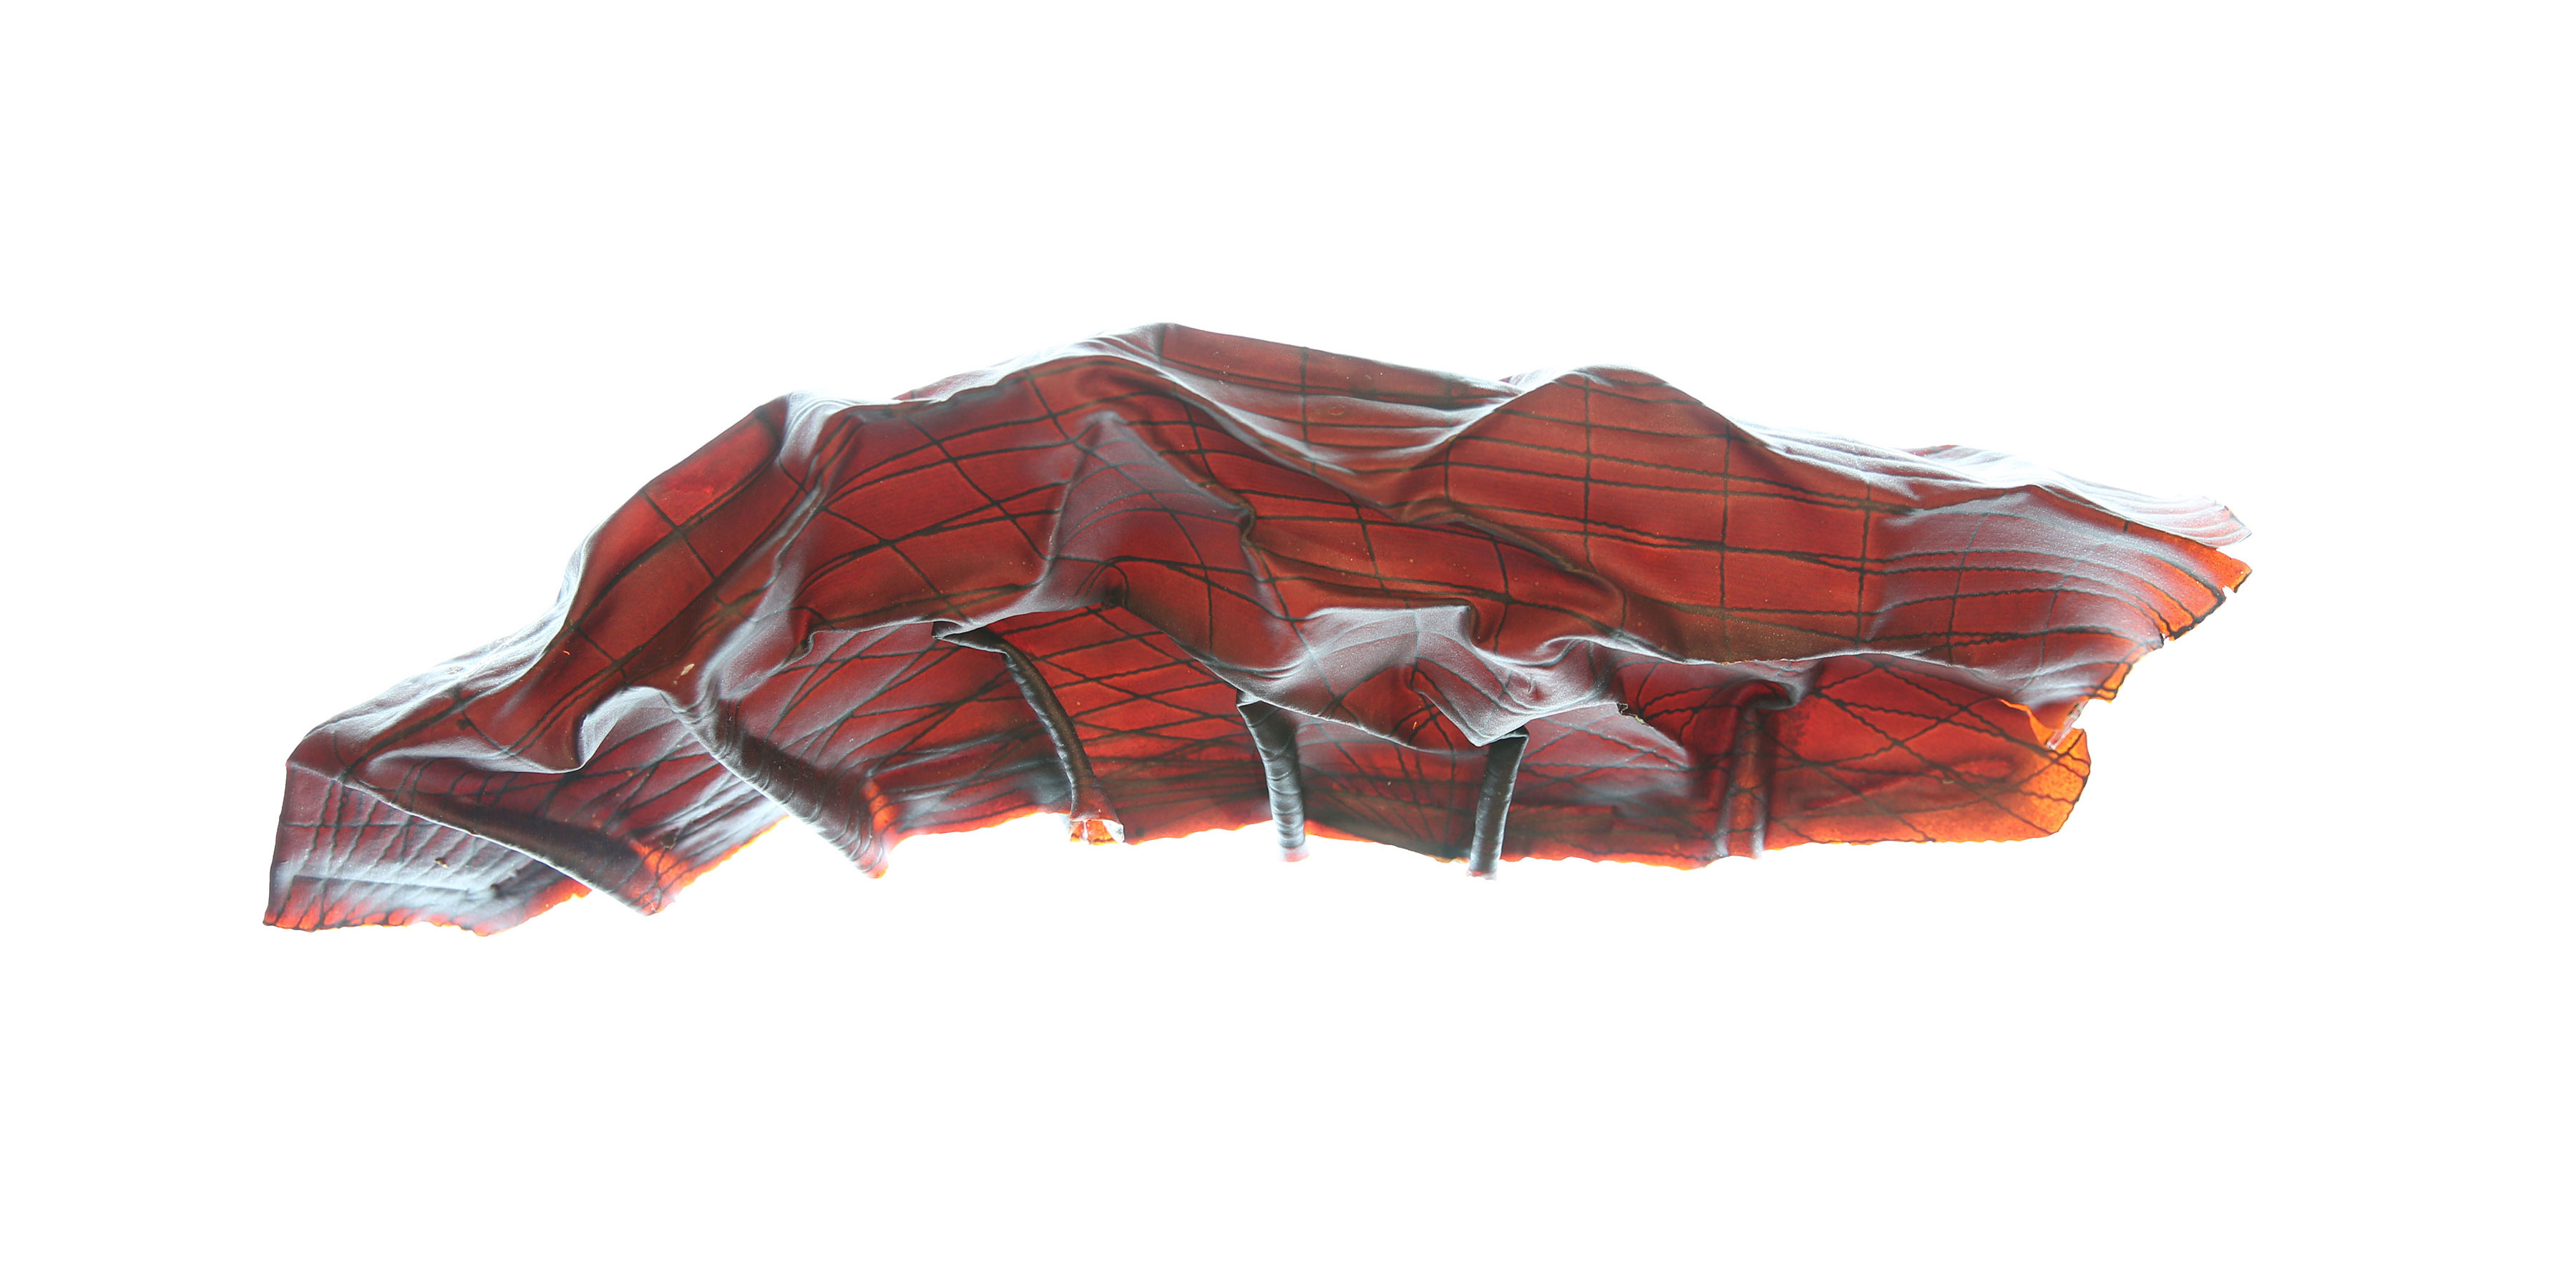

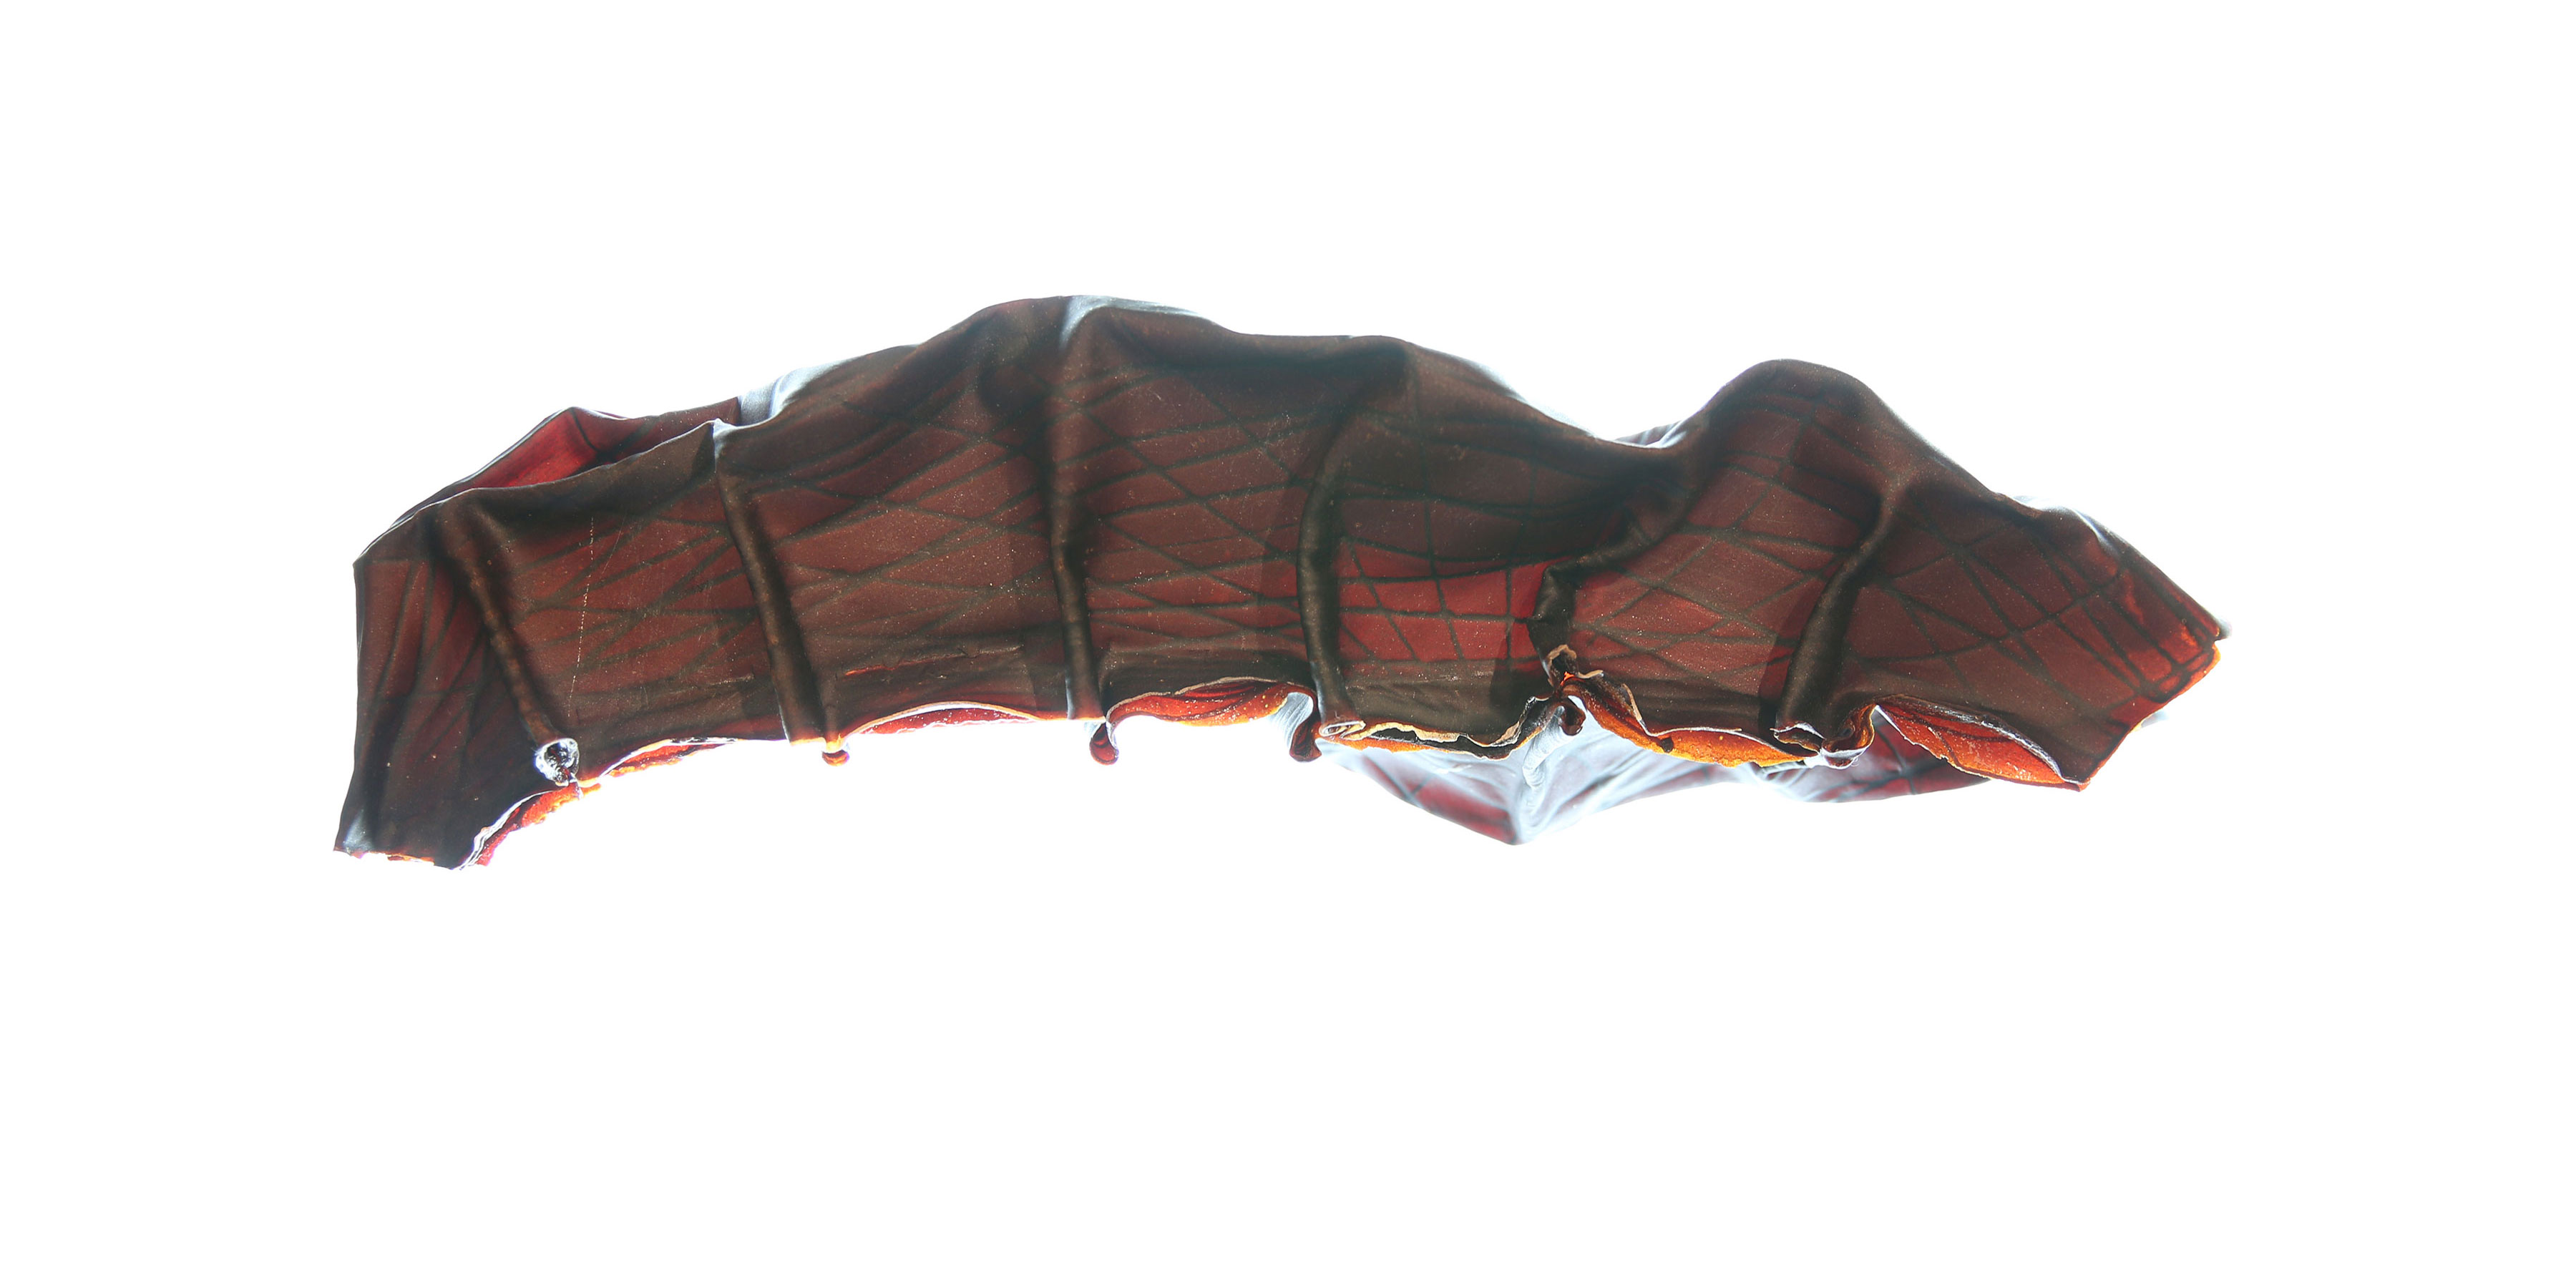
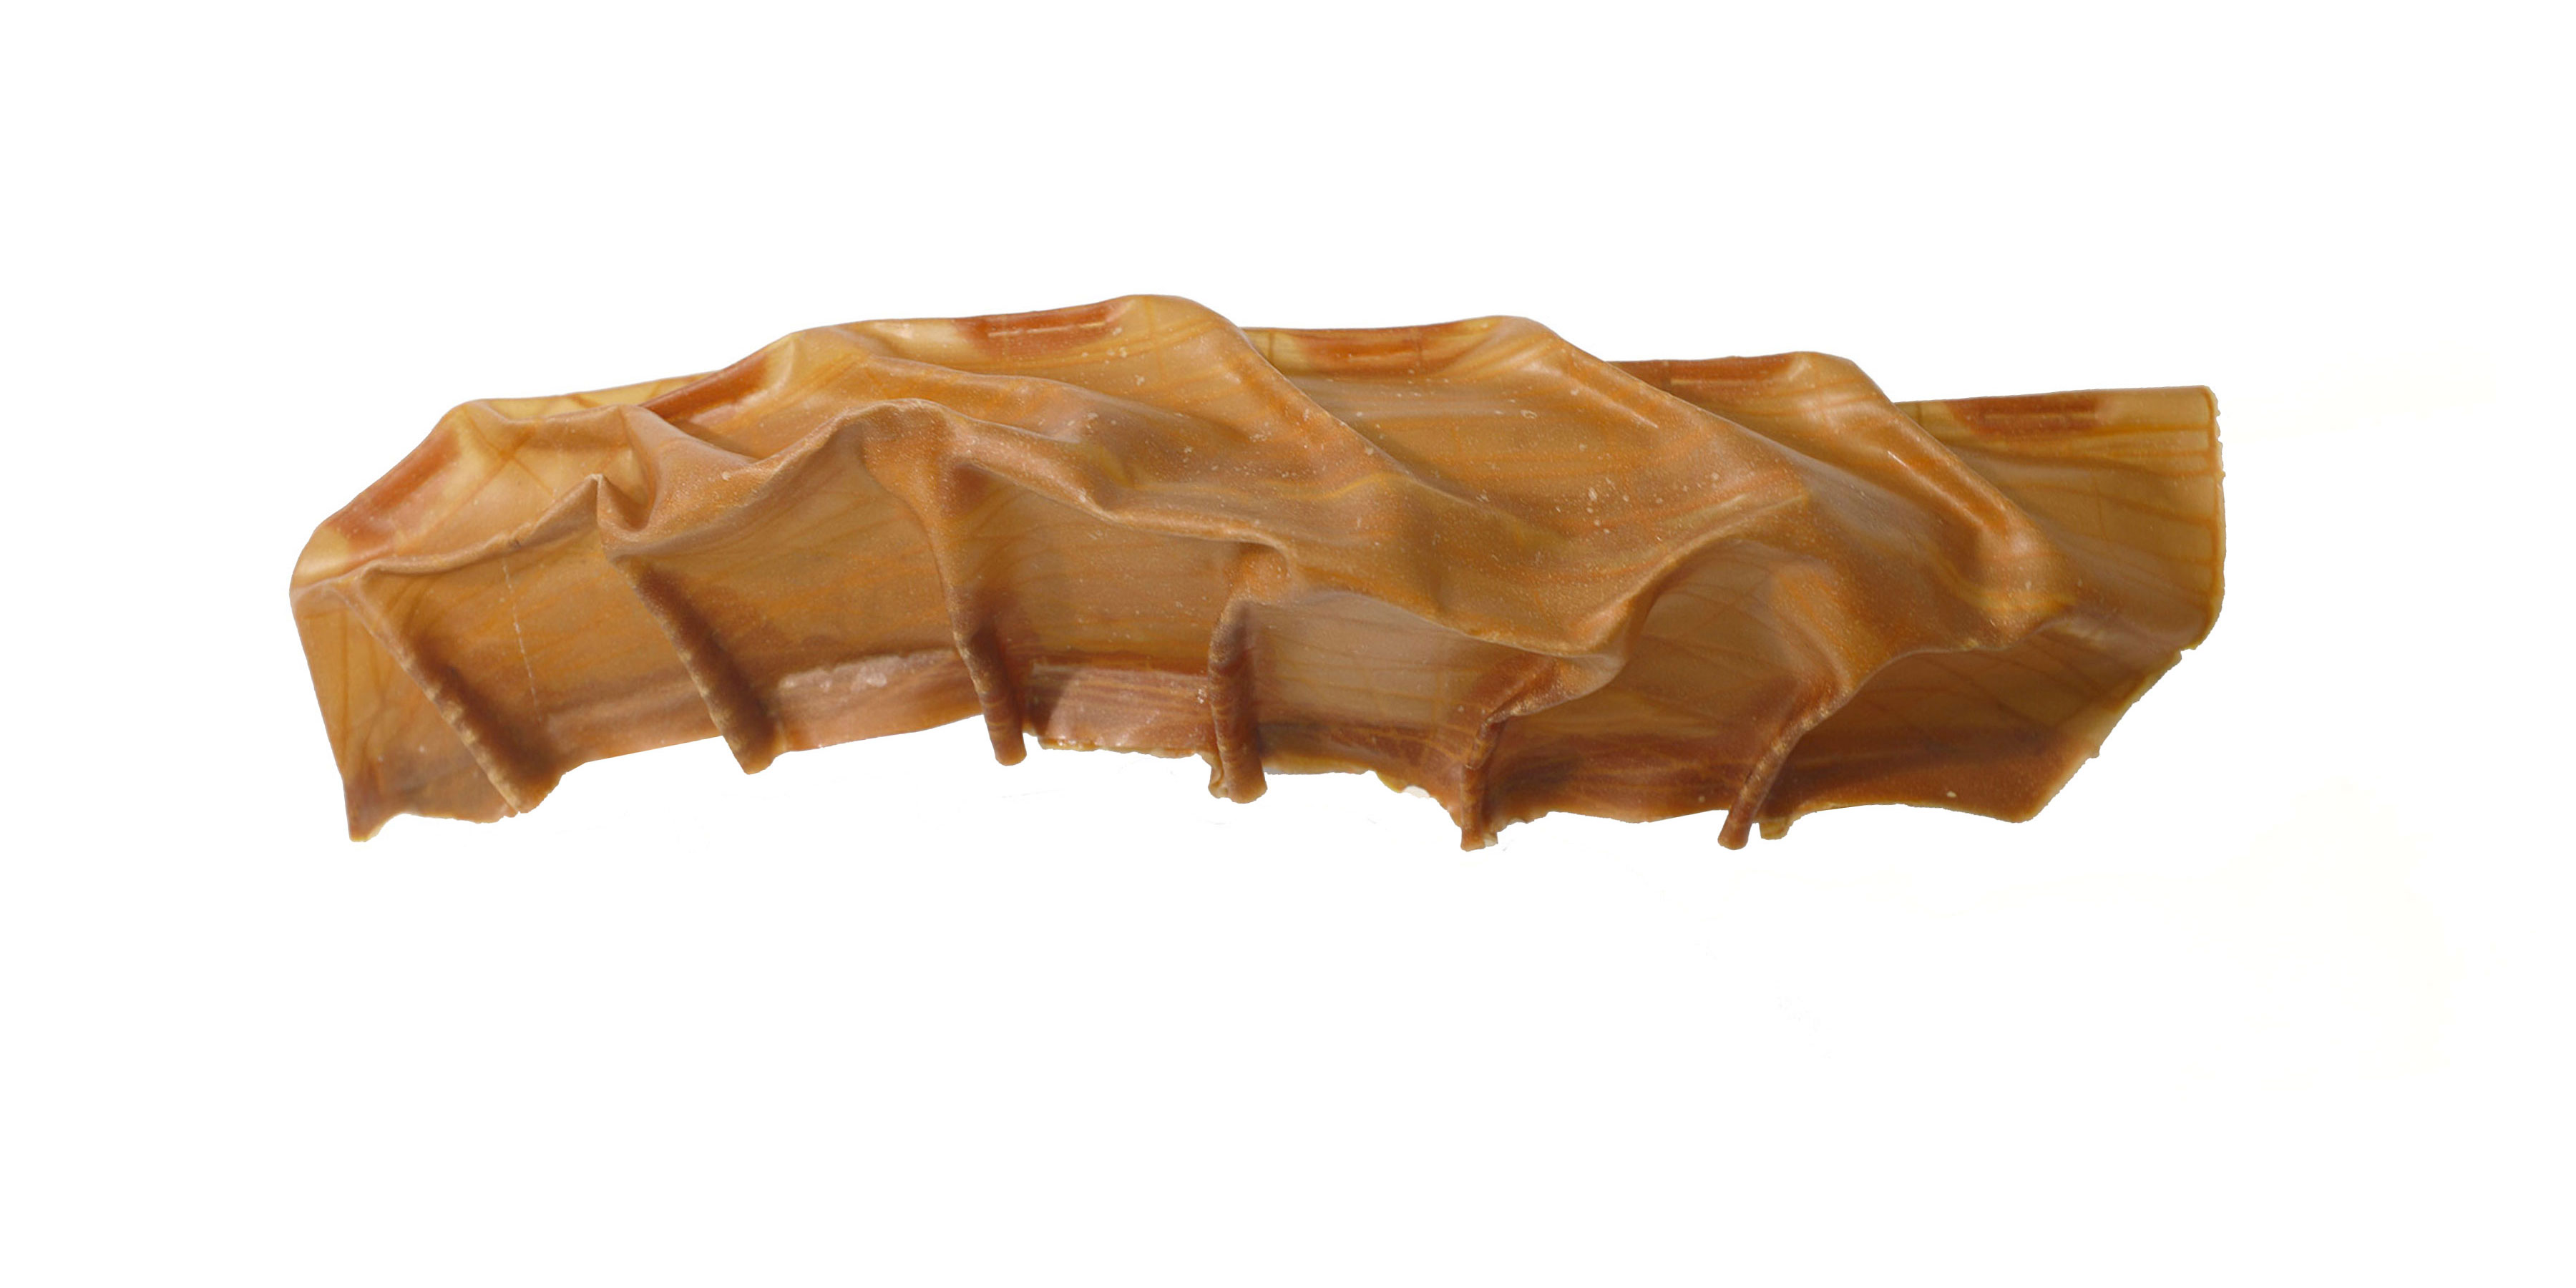
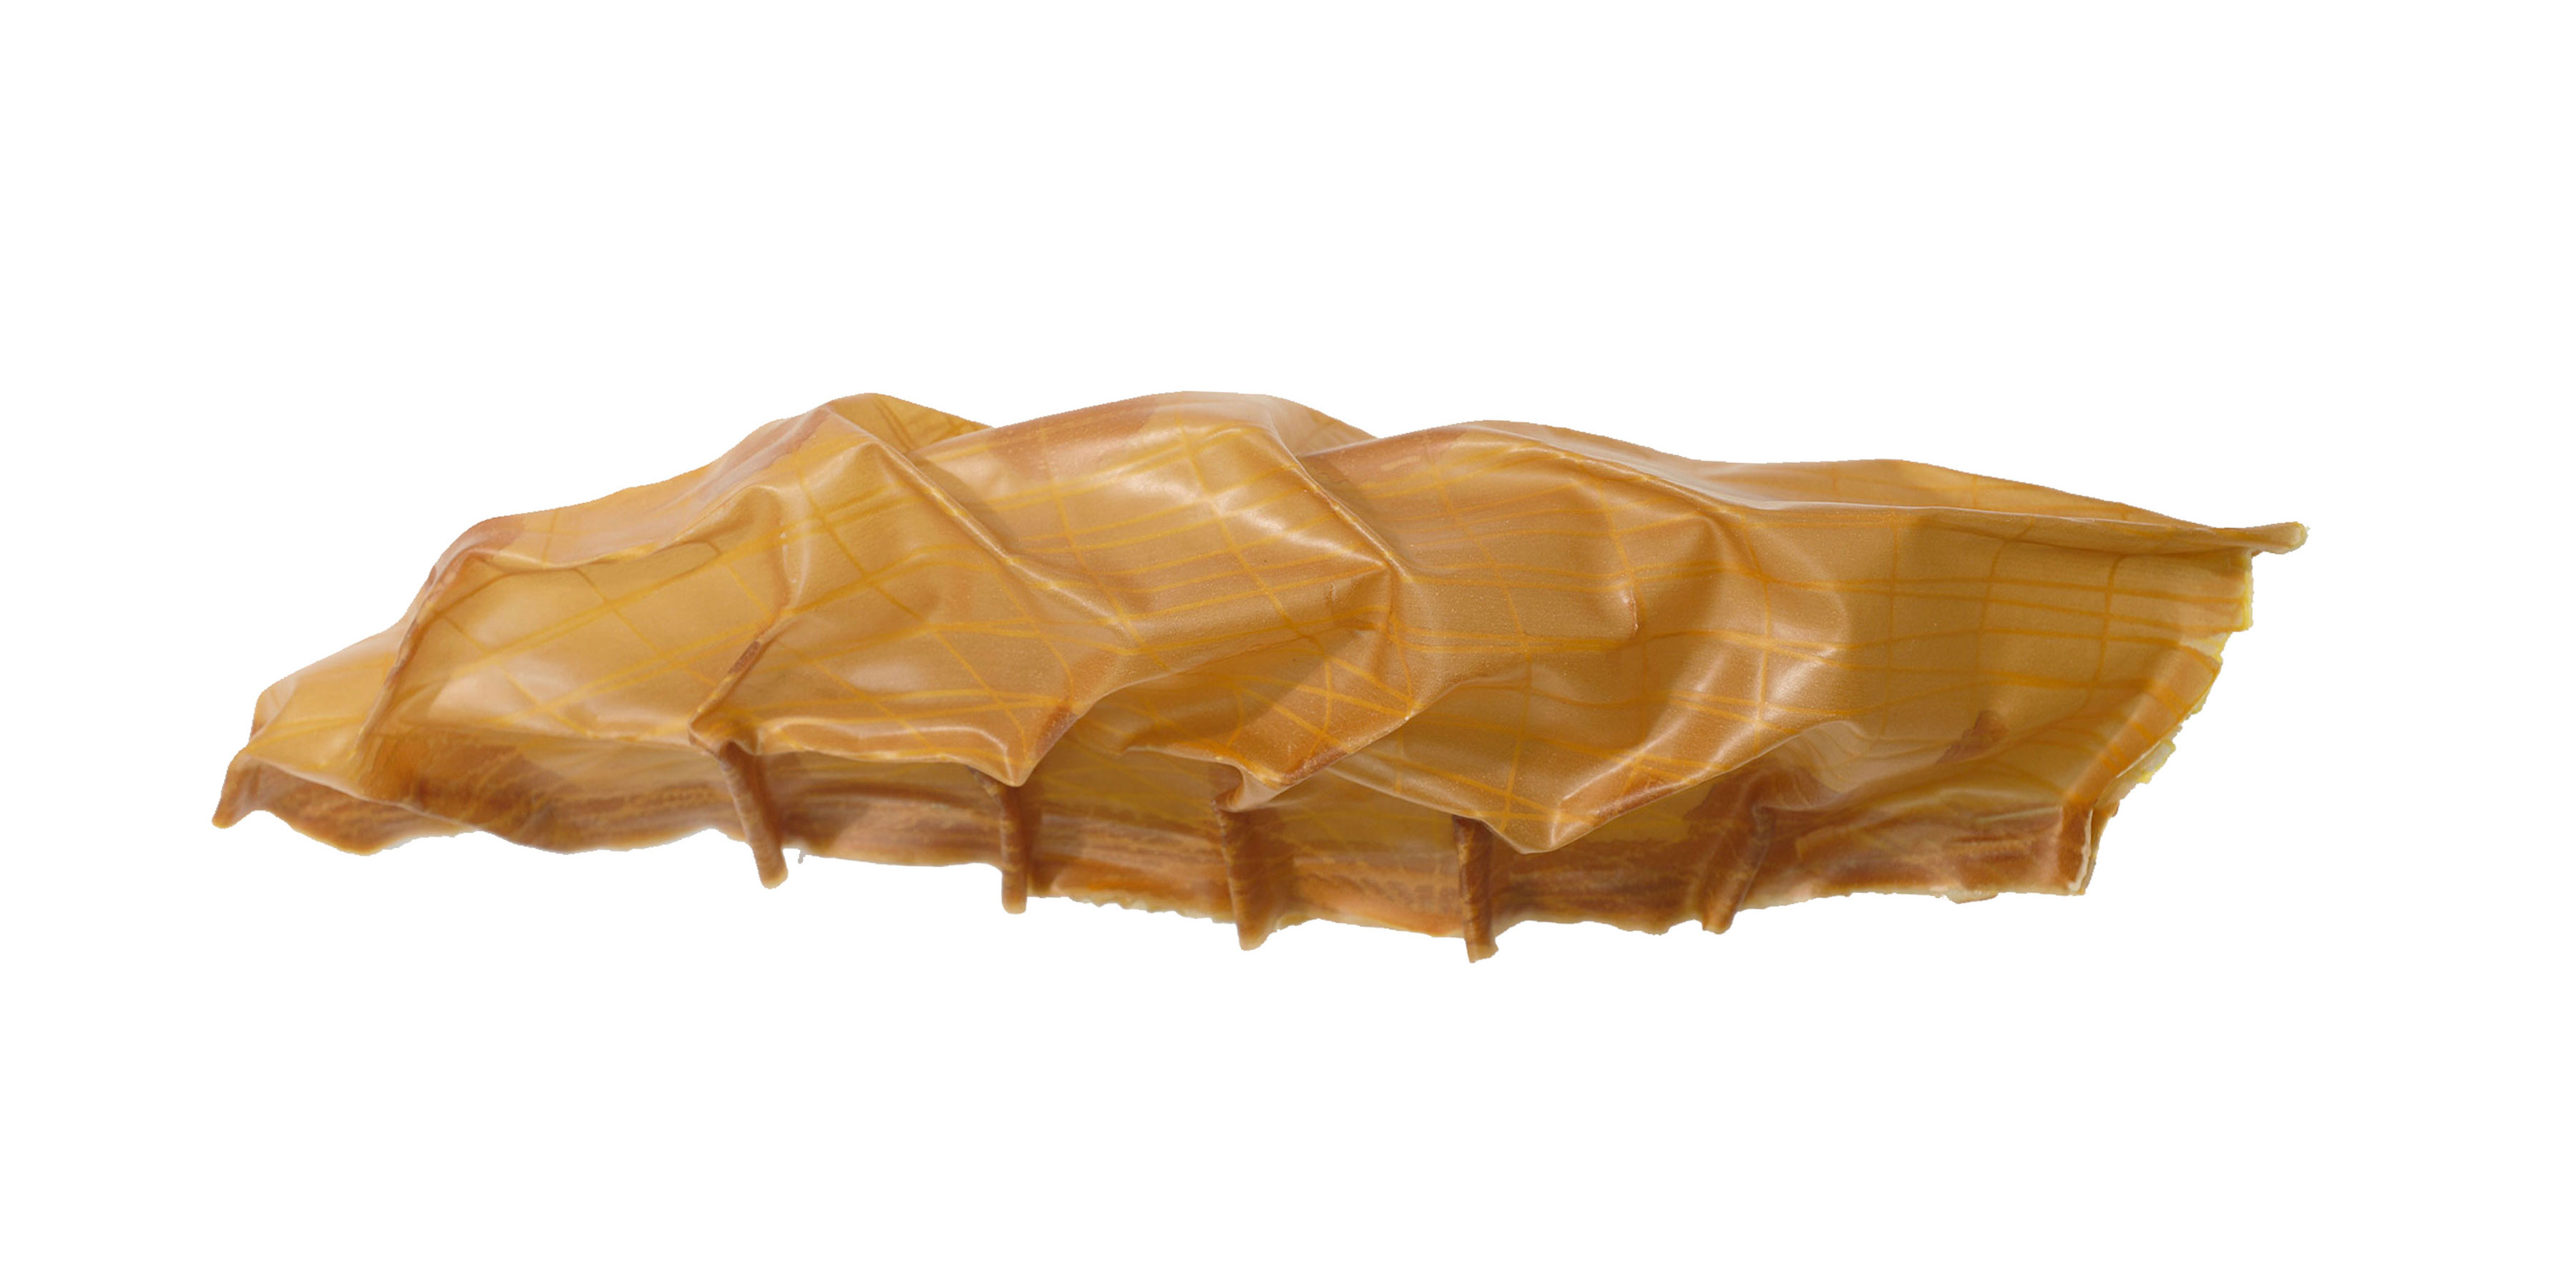
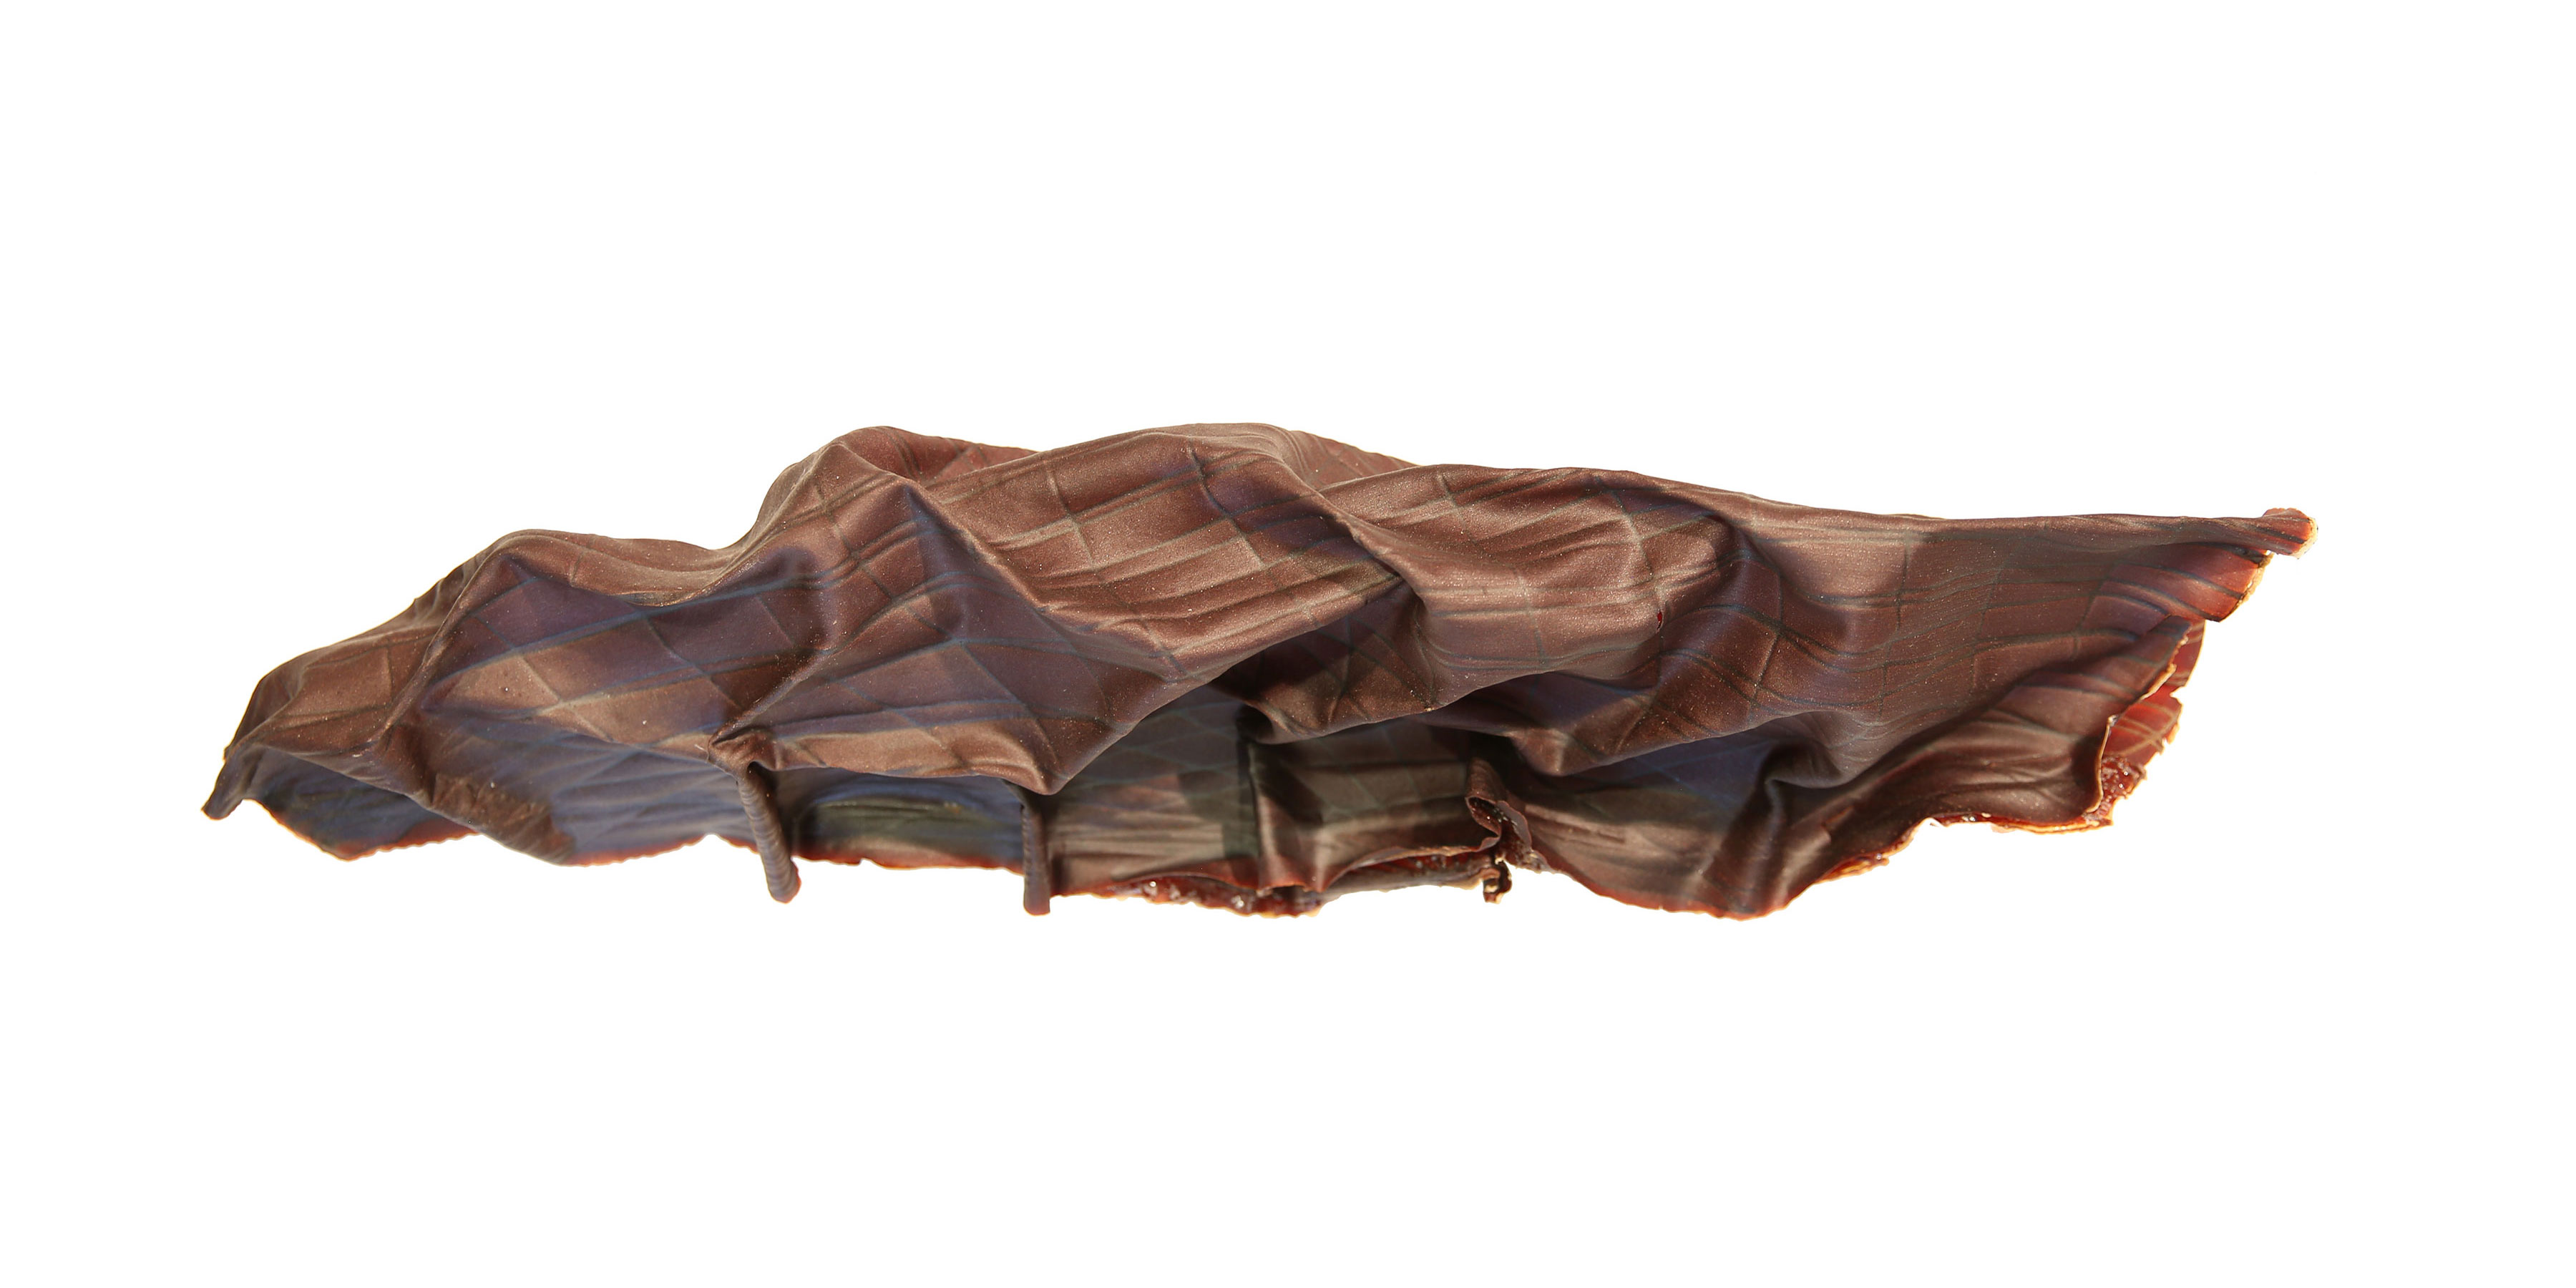
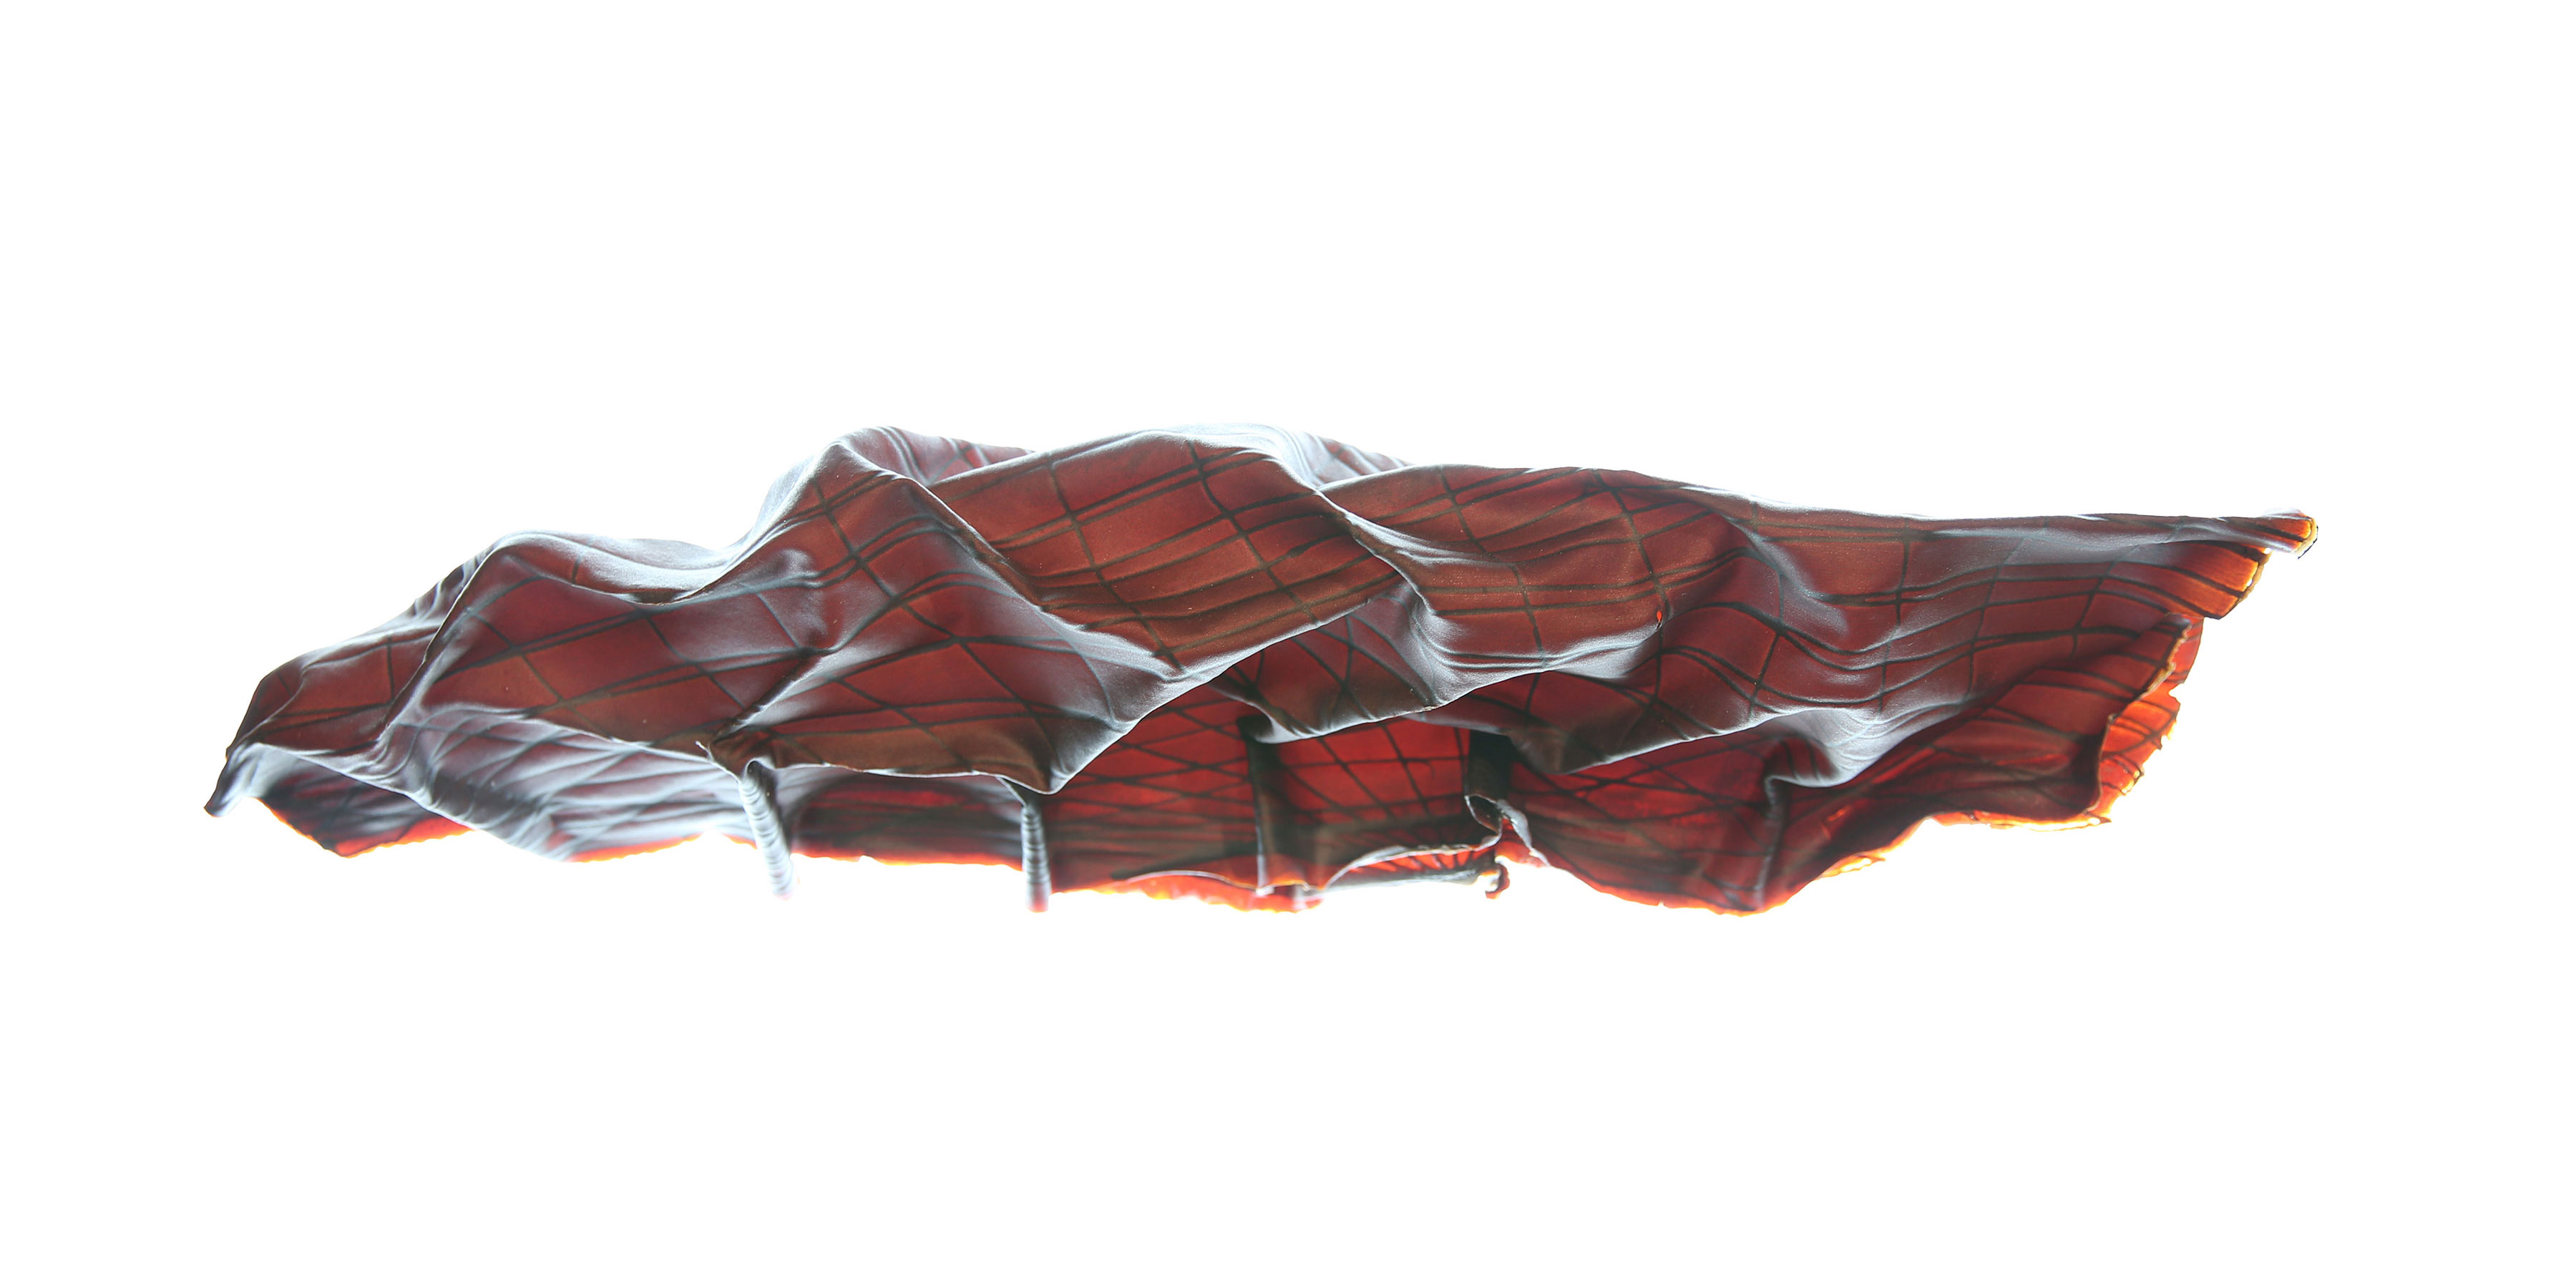
Figure I: Comparison of the deformation and color change of 6 bilaterally creased biopolyme prints aged over 1 year with different 3-dimensional forms.
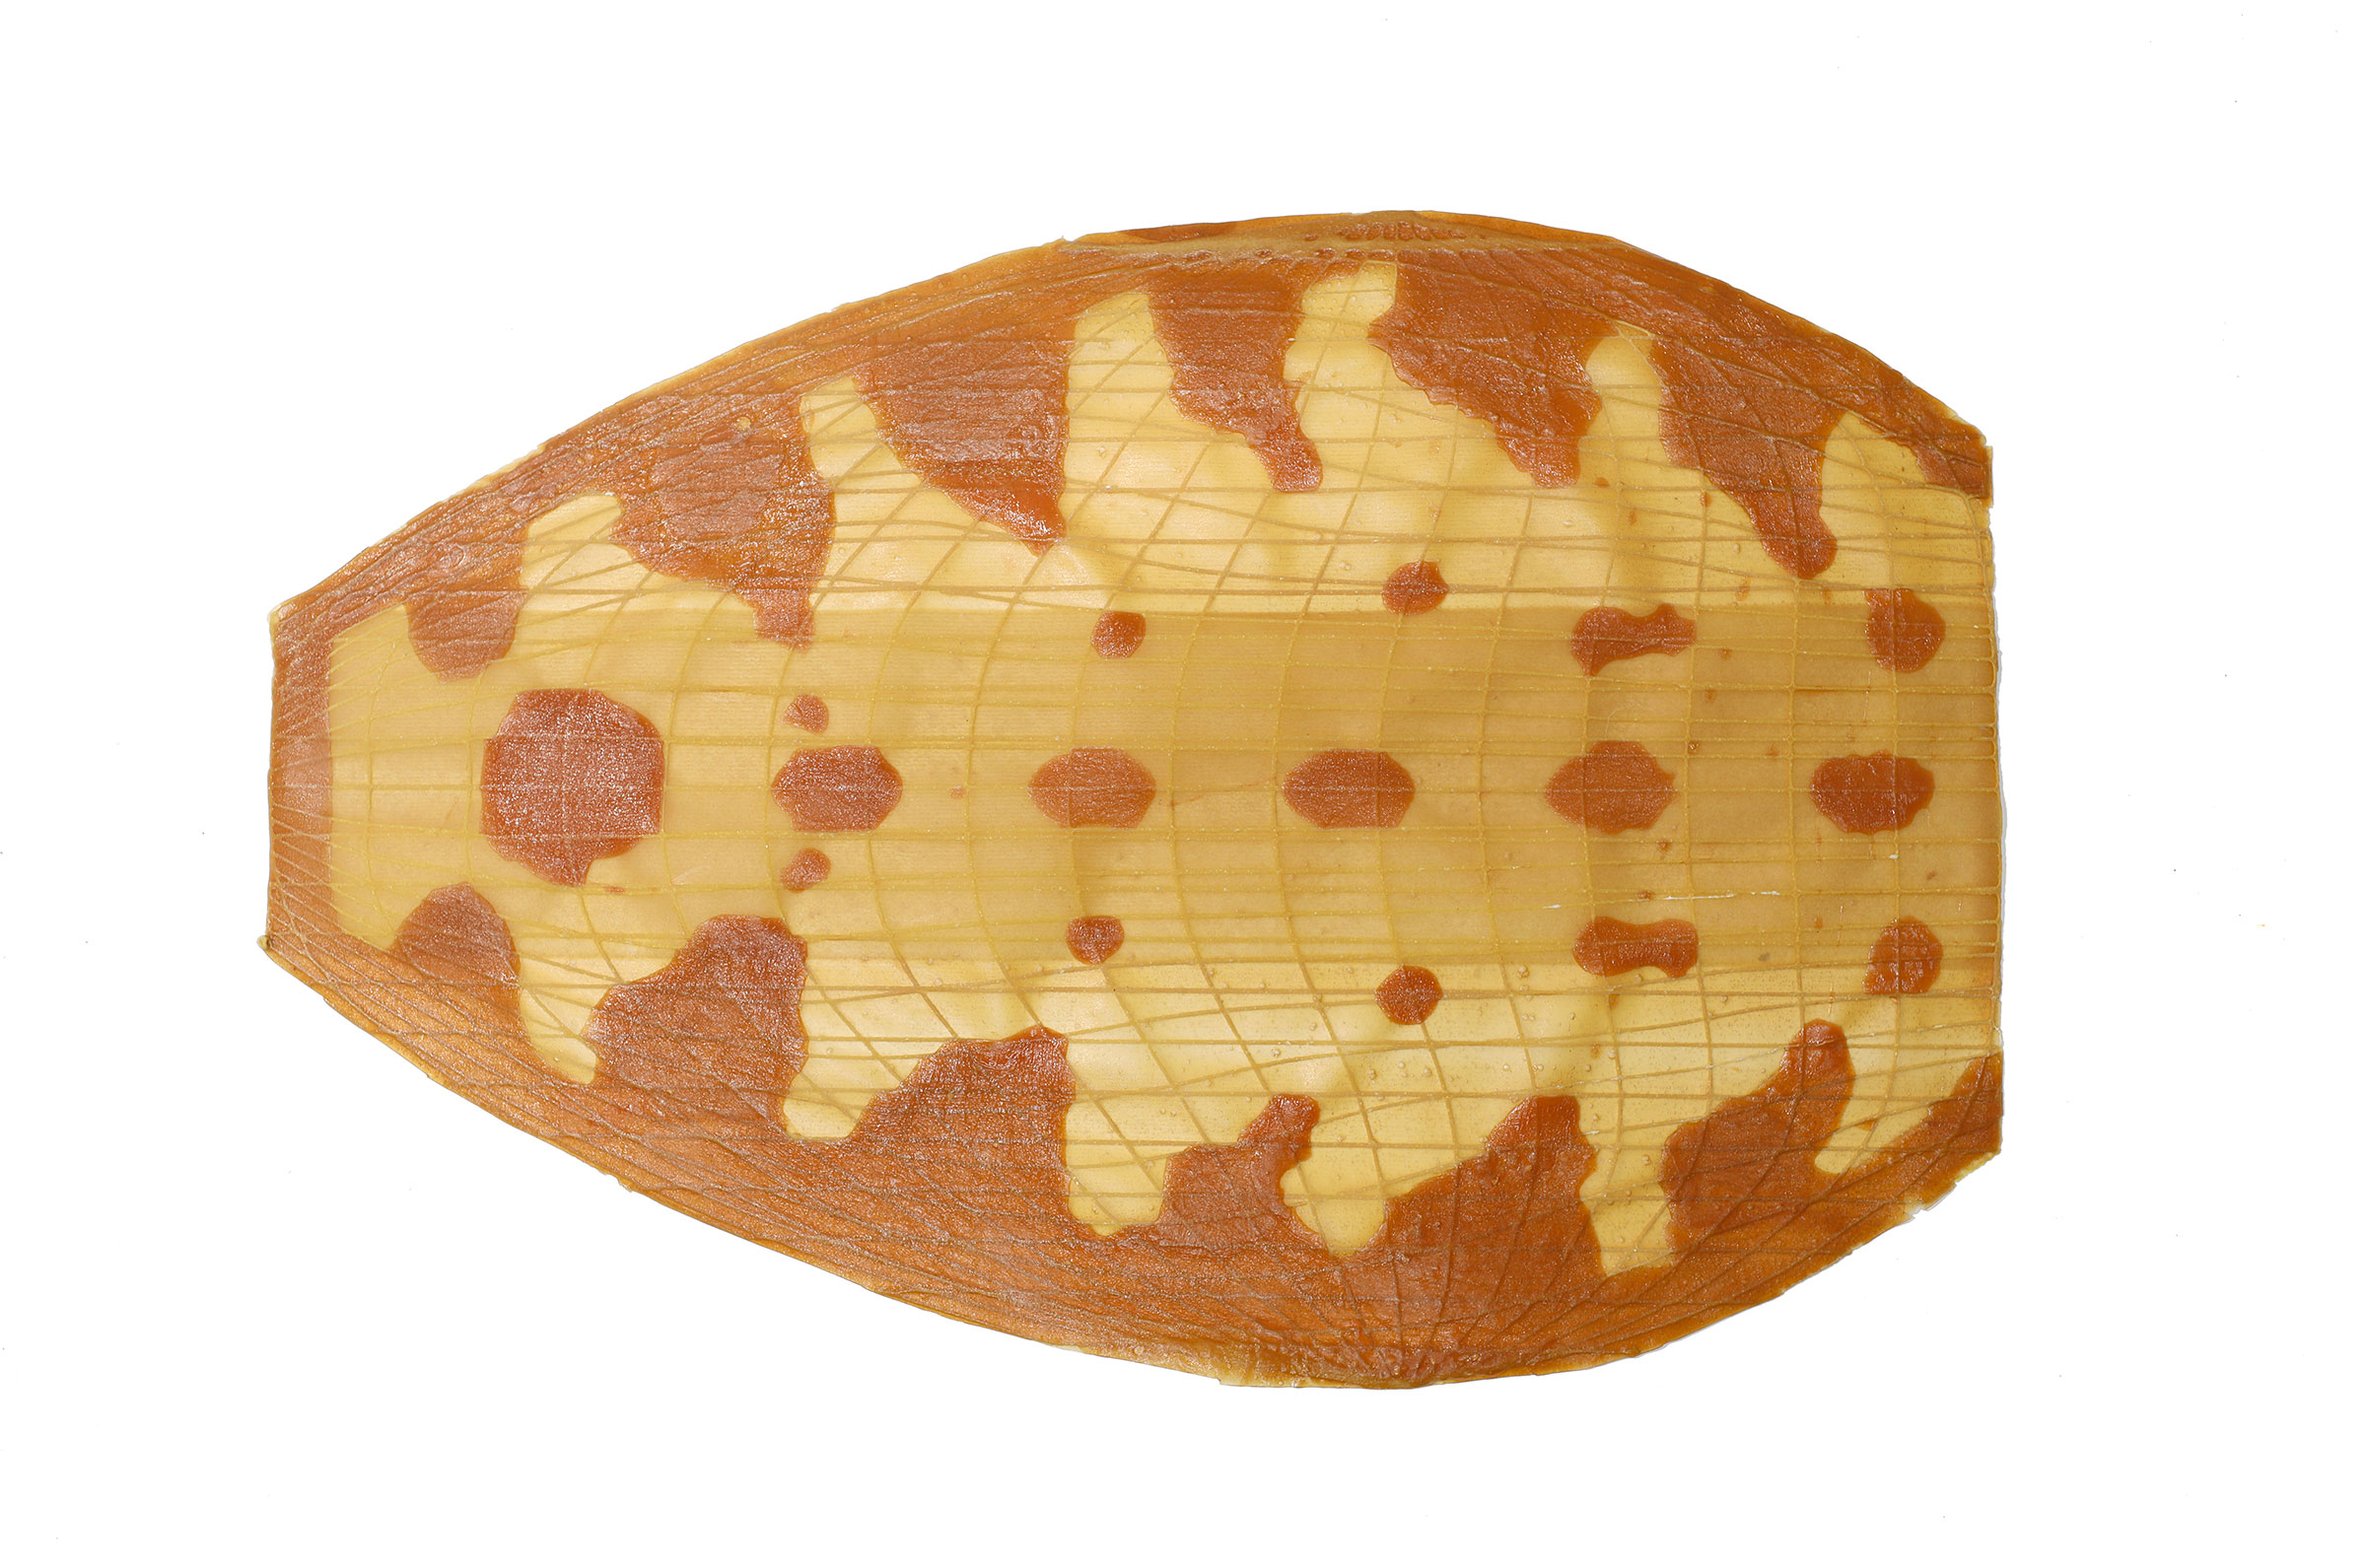

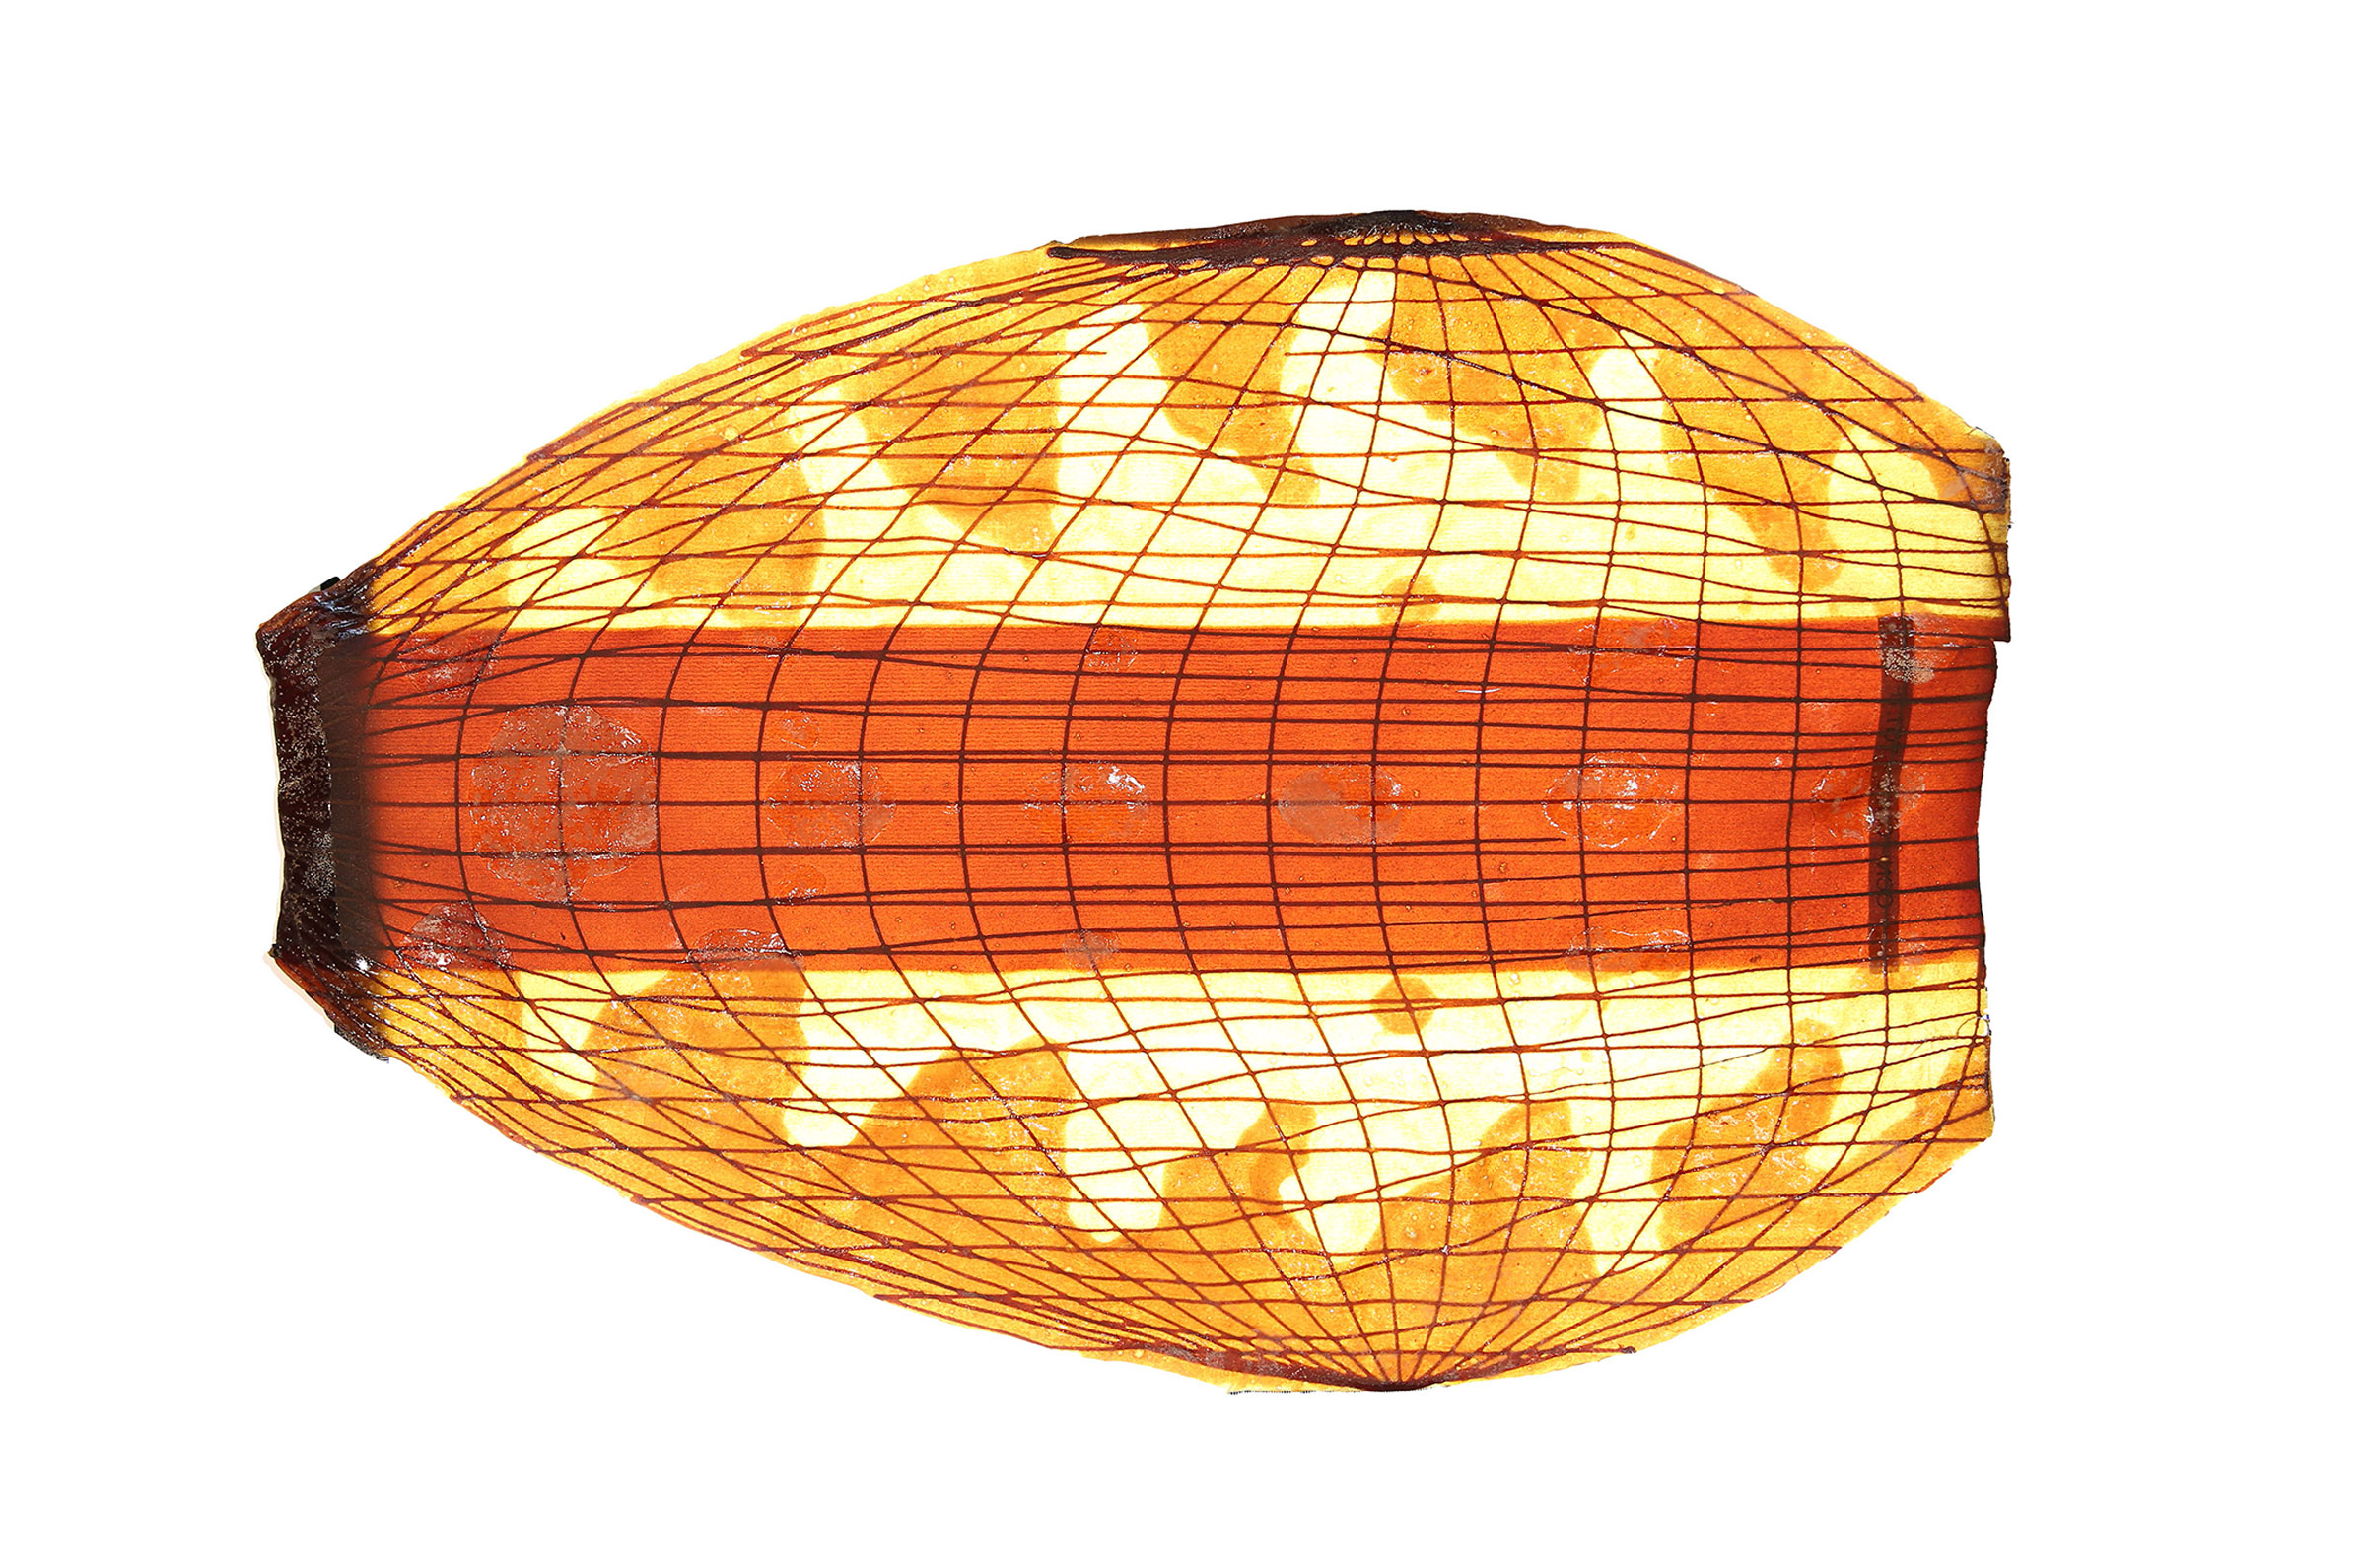
Figure II: Toolpaths from printed biopolymer sheets in set.

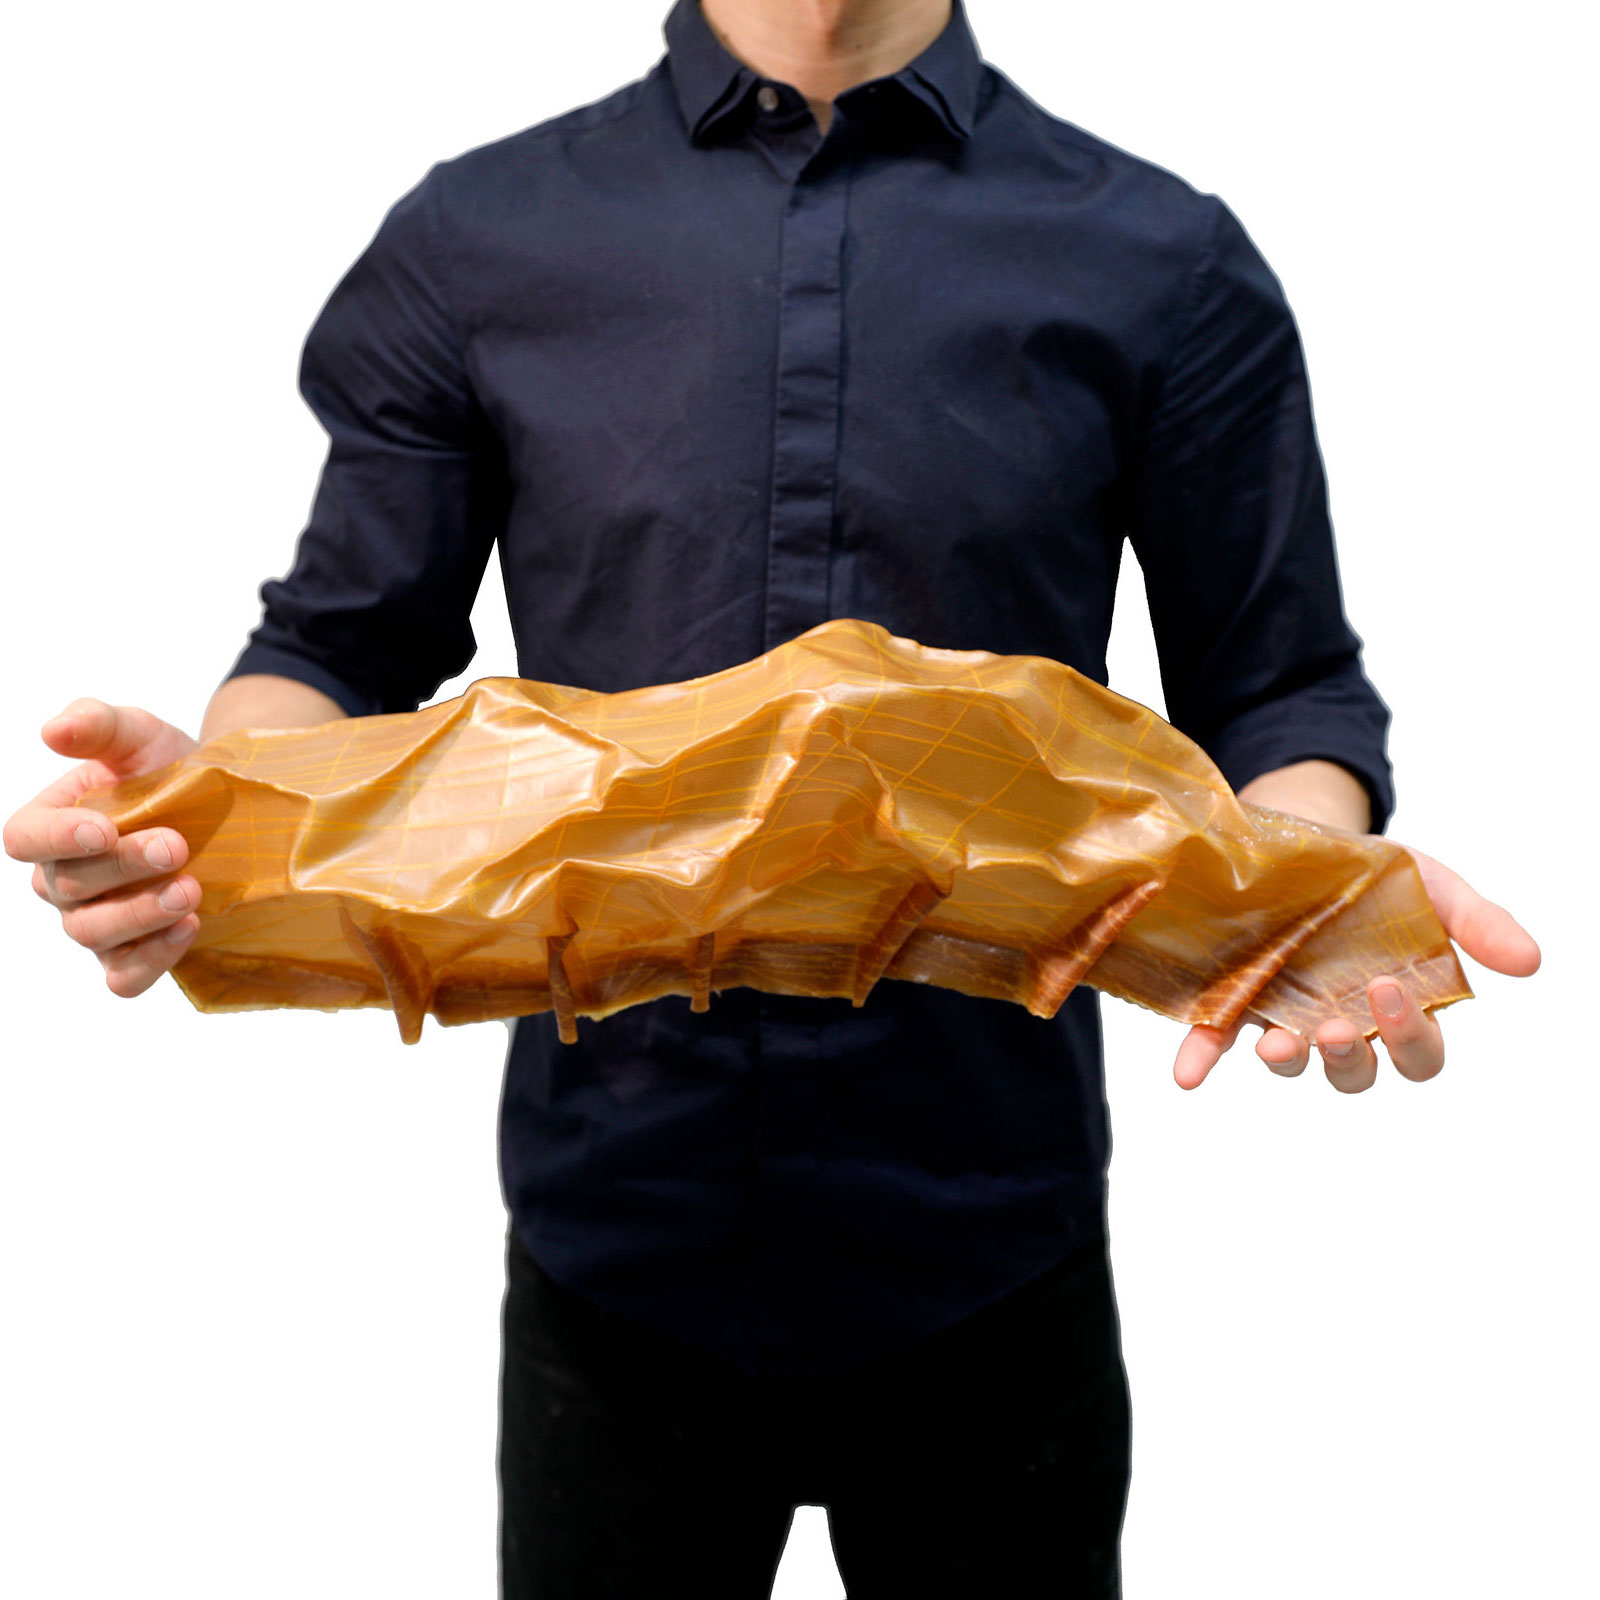
Figure III: Elevation view of 3 different creased forms.
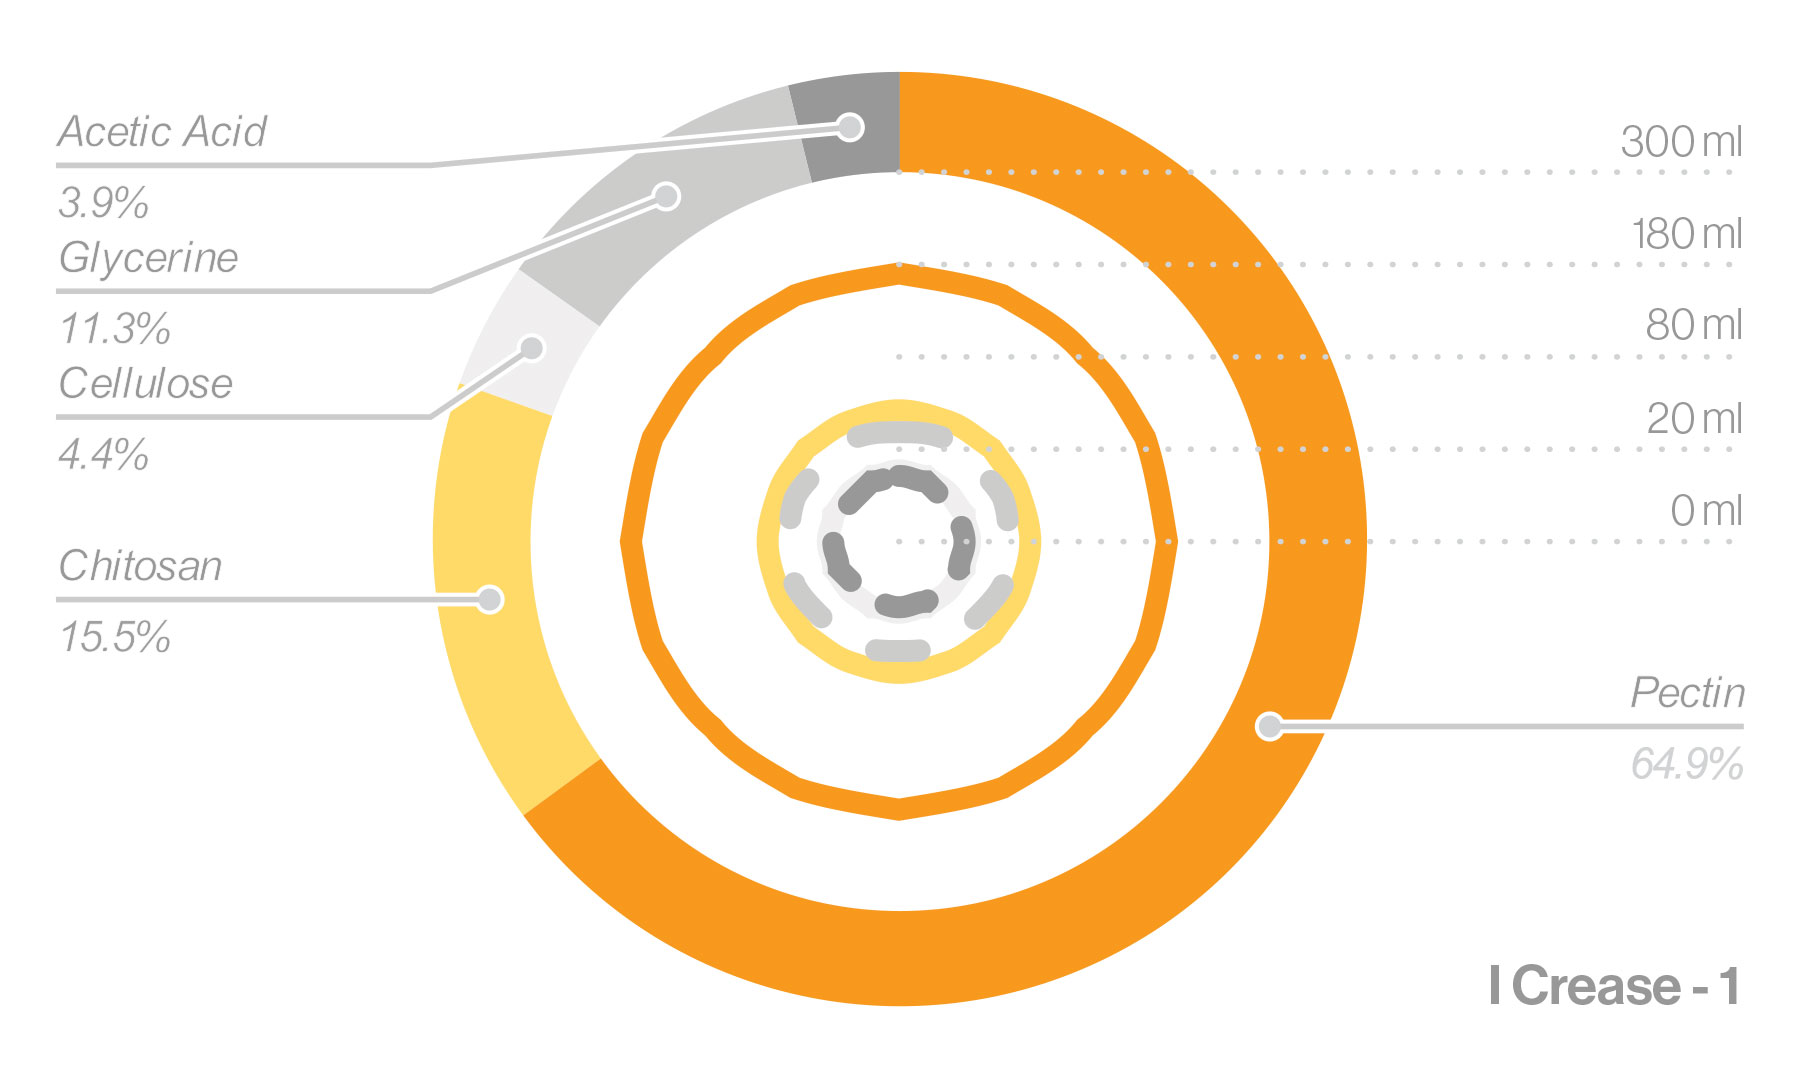
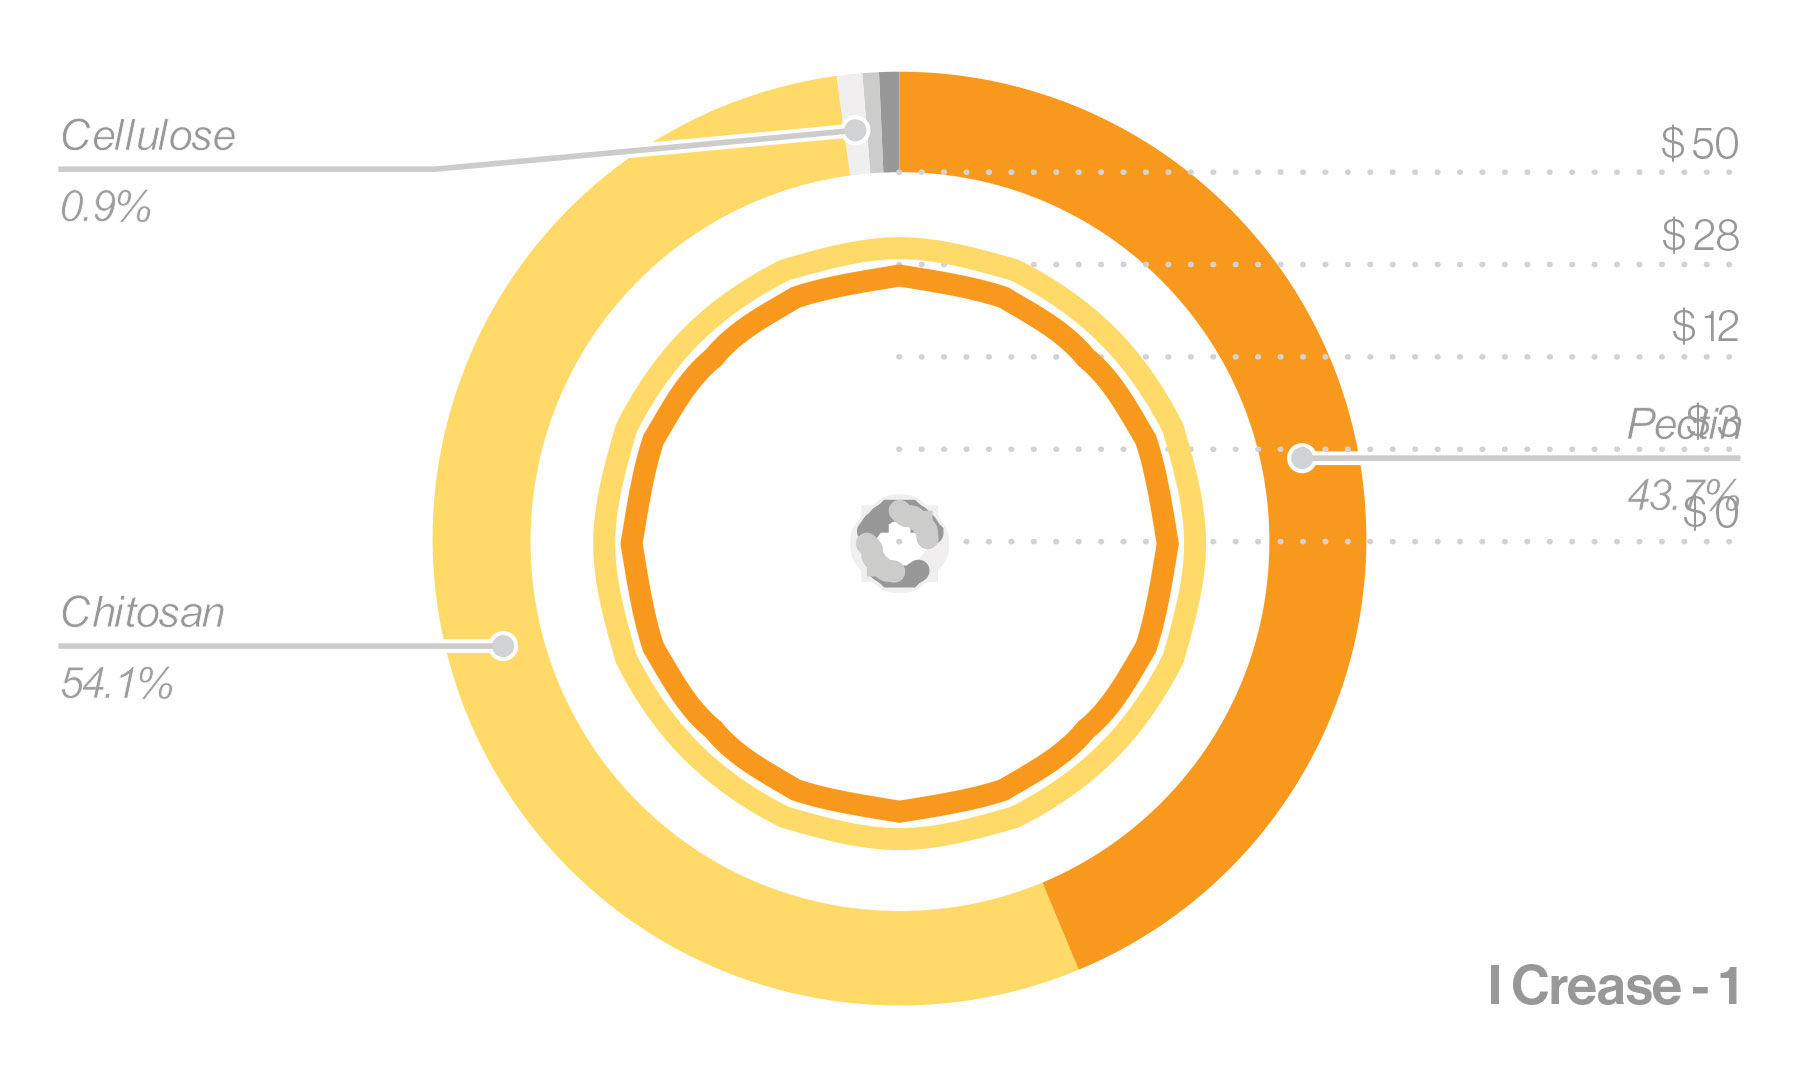
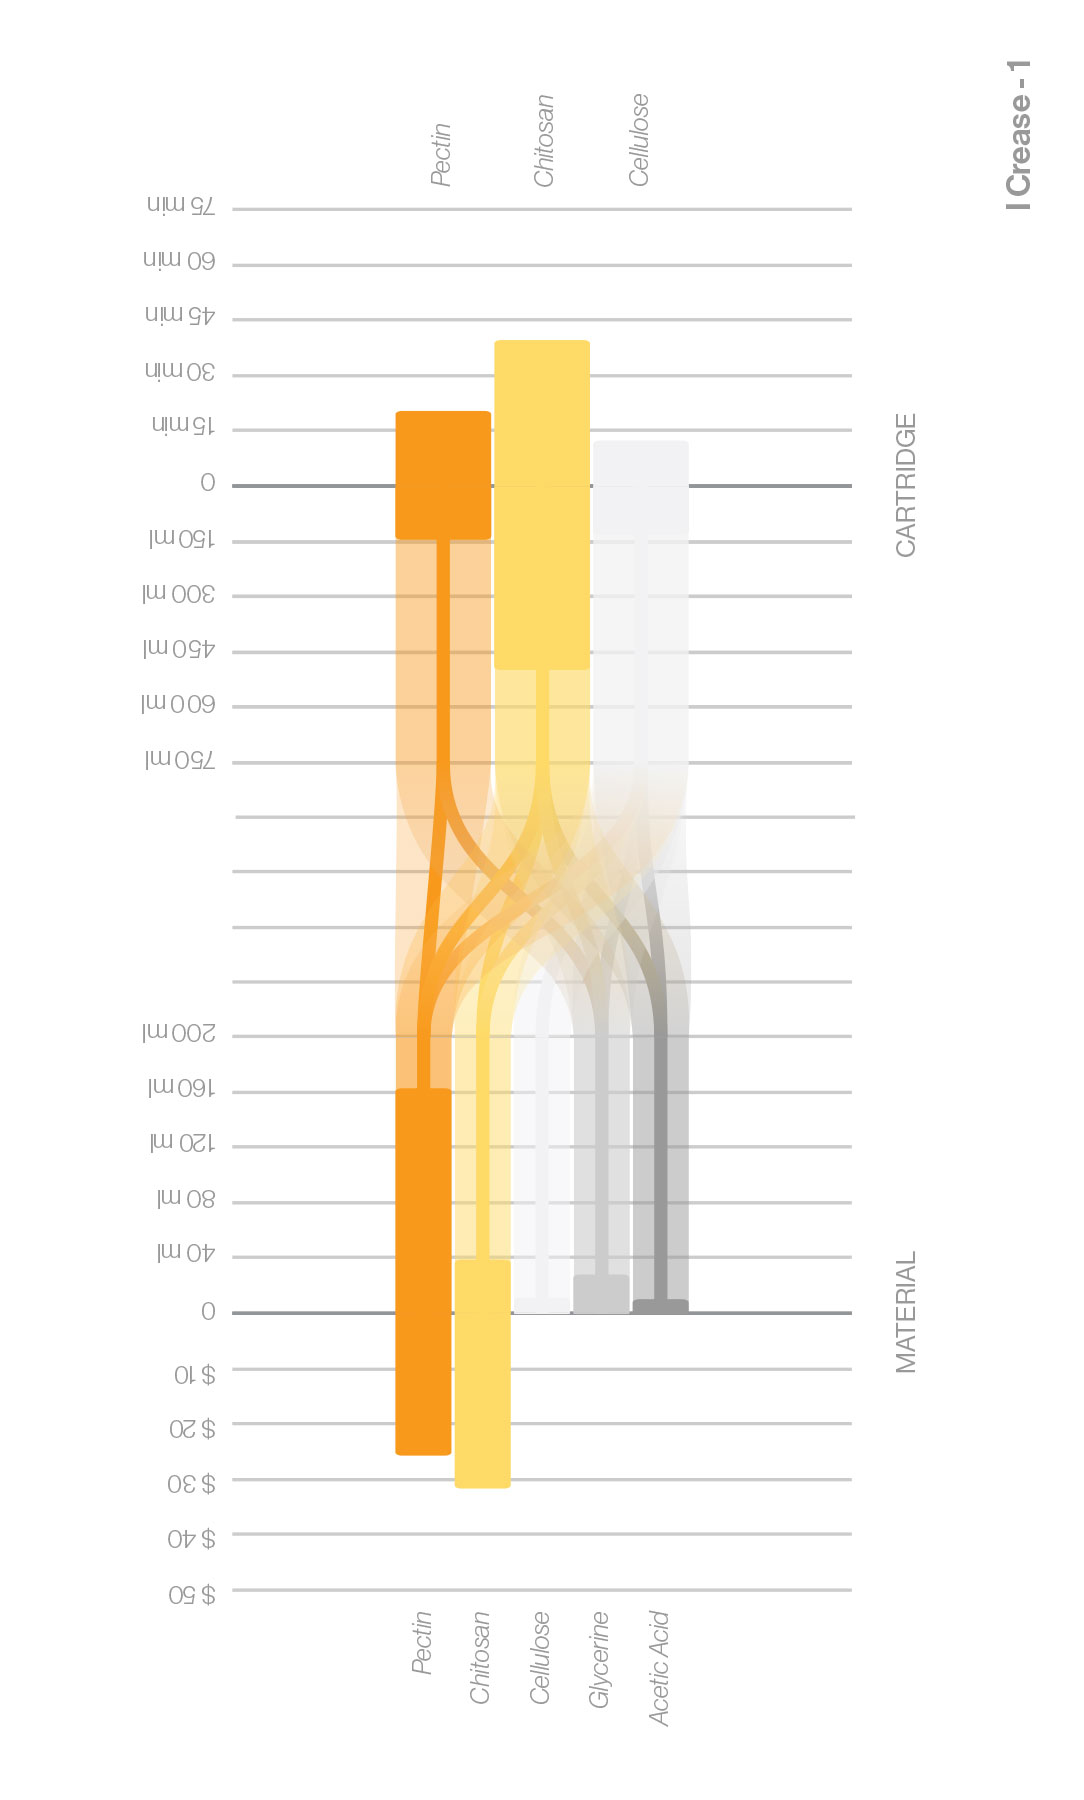
Figure IV: Composite pie chart circle diagram comparing ingredient volume and cost of materials for each single material print (6 types).
+
I Crease
These experiments examine how creased biopolymer surfaces may deform over time. A series of bilaterally symmetric prints are composed of a pectin chitosan infill base layer with a cellulose lattice surface layer. The edges of each print have a region of pectin infill printed above the cellulose lattice. The edges of each of these surfaces are wet and folded over to connect to themselves. The volume is pinched and creased along its ridges.
The visual changes of the creased surfaces are tracked for a period of time.
- Exposure to air is recorded during the first month and at 12 months.
- Folded shapes are imaged in plan and side view.
- Changes in color and shape are visible.
4 creased surfaces are tested that control for the same materials, toolpaths and print orders but vary the 3-dimensional geometries.
The pieces experience moderate shape change and significant color change.